


| ID | Title | Description | |
|---|---|---|---|
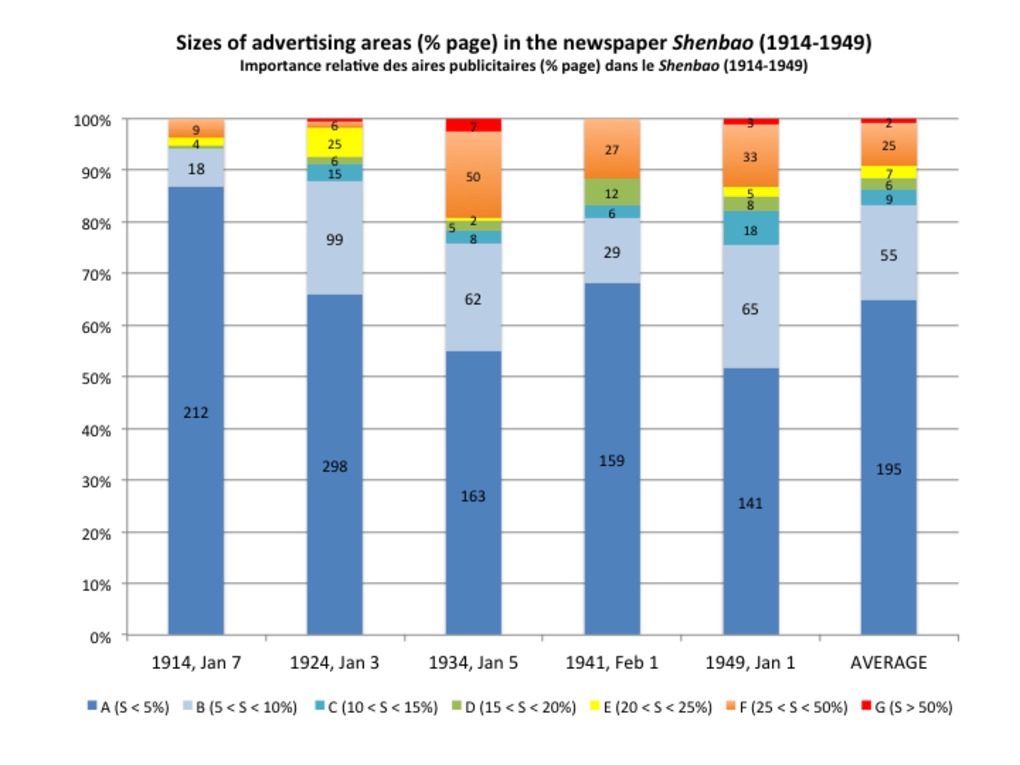 | 220 | Advertising-populated regions in the Chinese newspaper Shenbao (1914-1949) | This set of bar charts aims to measure the surfaces covered by advertisements in the newspaper Shenbao, according to the following gradual scale of areas*:
*For visibility and convenience reasons, each type has been associated with a letter and a color ("S" standing for "surface"): The measurements have been made after our five usual sample issues of the newspaper Shenbao (Jan 9, 1914; Jan 3, 1924; Jan 5, 1934; Feb 1, 1941; Jan 1, 1949). *** Les histogrammes ci-joint mesurent en termes numériques (nombre d’aires relevant de chaque catégorie) : l’importance relative des aires publicitaires dans le Shenbao, selon l'échelle graduée établie par ailleurs :
Par commoditité et par souci de lisibiité, une lettre et un code couleur a été associé à chaque catégorie. Plus la couleur est « froide » (bleu), plus les aires sont petites (types A, B, C : moins de 15% de la page). Inversement, plus les couleurs sont « chaudes » (du jaune au rouge), plus les surfaces sont étendues (type F et G : plus de 25% de la page). Le vert signale finalement les surface intermédiaires (D et E : entre 15 et 25%). La contance de ce code permet de suivre l’évolution des surfaces au fil des âges et de comparer le Shenbao à d'autres quotidiens. Par souci de cohérence, les mesures ont été réalisées à partir de nos cinq échantillons habituels du Shenbao (7 janvier 1914, 3 janvier 1924, 5 janvier 1934, 1er février 1941, 1er janvier 1949). |
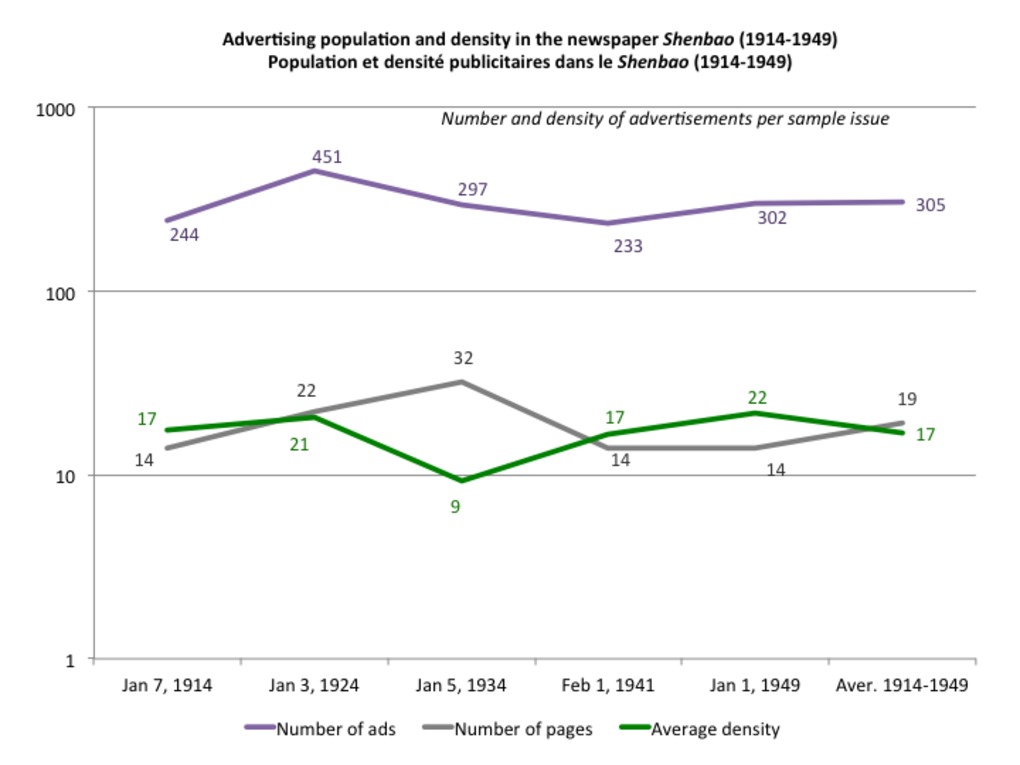 | 223 | Advertising population in the Chinese newspaper Shenbao (1914-1949) | This set of three curves traces the evolutions of advertising population and density in the Chinese newspaper Shenbao between 1914 and 1949. The green curve stands for the total number of advertisements (in each sample issue), the grey line indicates the total number of pages in each sample issue, the purple line indicates the average density of ads (number of ads/number of pages) in each sample issue). The measurements were made after our usual five samples of the Shenbao (January 7, 1914; January 3, 1924; January 5, 1934; February 1, 1941; January 1, 1949). *** Le jeu des trois courbes ci-joint retrace les tendances démographiques globales dans le quotidien chinois Shenbao entre 1914 et 1949 : l’évolution la population totale par numéro (courbe verte), évolution du nombre de pages (en gris), ainsi que l’évolution de la densité moyenne (c’est-à-dire le rapport entre nombre de publicités totale et nombre de pages, en violet). Les mesures ont été réalisées à partir de nos cinq échantillons habituels (7 janvier 1914, 3 janvier 1924, 5 janvier 1934, 1er février 1941, 1er janvier 1949) |
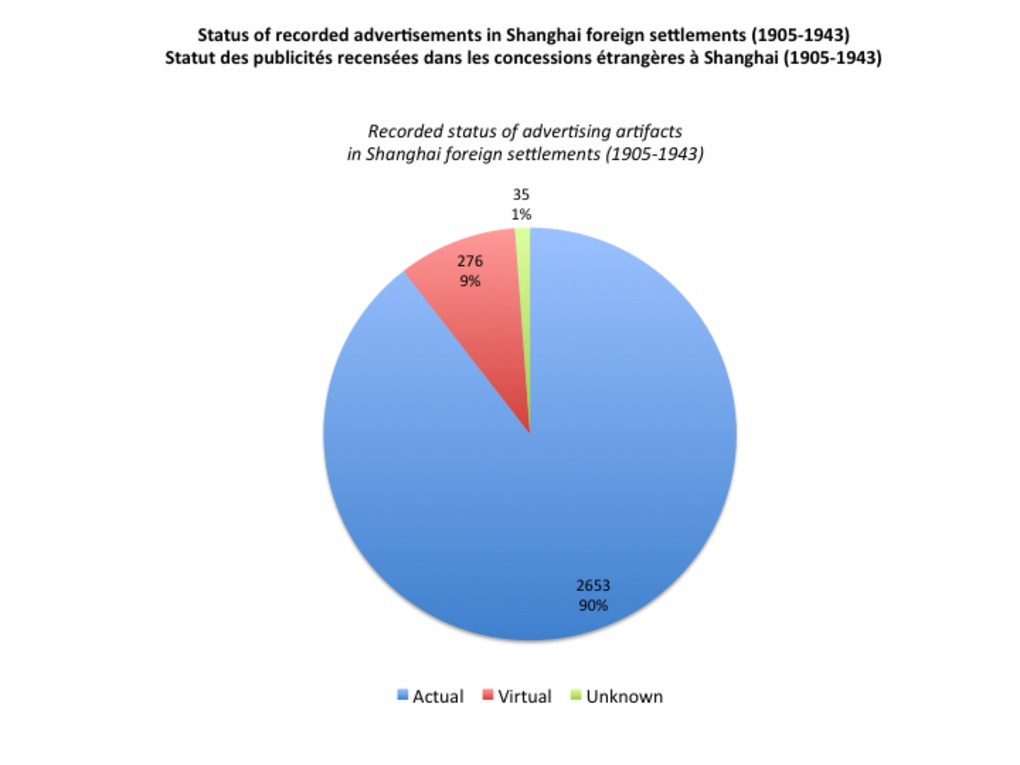 | 227 | Actual and virtual spaces of advertising in Shanghai (1905-1943) | This pie chart shows the global distribution between virtual (imaginary) (in blue) and actual (red) spaces of advertising in Shanghai foreign settlements (1905-1943). Uncertain status is materialized by the green color. This chart has been established after the Shanghai municipal archives. |
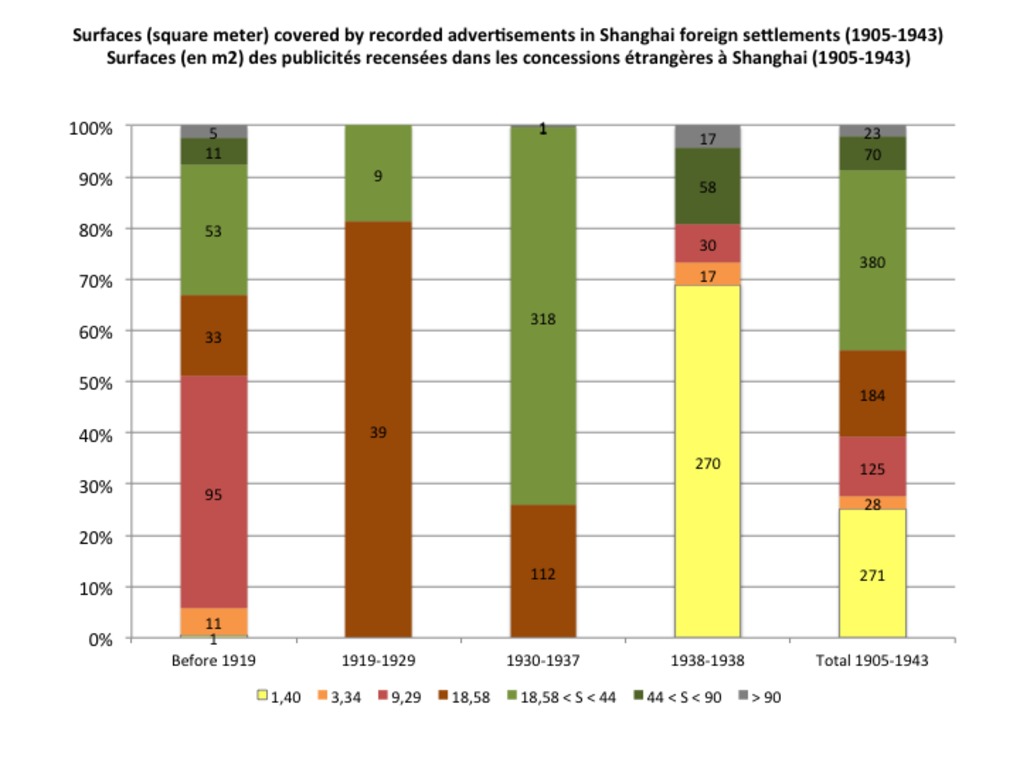 | 228 | Advertising surfaces (standards and size slices) in Shanghai foreign settlements (1905-1943) | This set of bar charts shows the distribution of advertising structures according to their dimensions in Shanghai foreign settlements (1905-1943). The size standards and "slices" have been identified after two main sources: professional handbooks (Crow, 1926, Bacon, 1929) and my own records in the Shanghai municipal archives. |
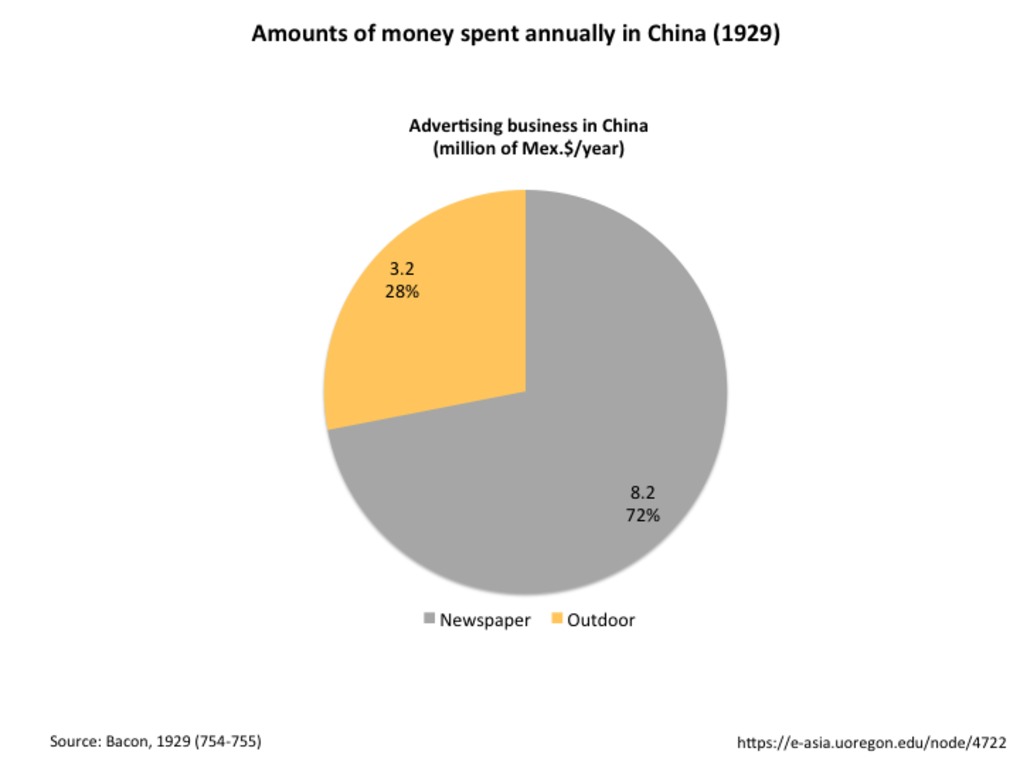 | 230 | Annual advertising expenses in China: distribution betwen newspaper and outdoor advertising (1929) | This pie charts shows the distribution of the money spent in advertising between newspaper and outdoor advertising in China before 1929 (expressed in million of mexican dollars/year). Source: Bacon, 1929 (754-755) |
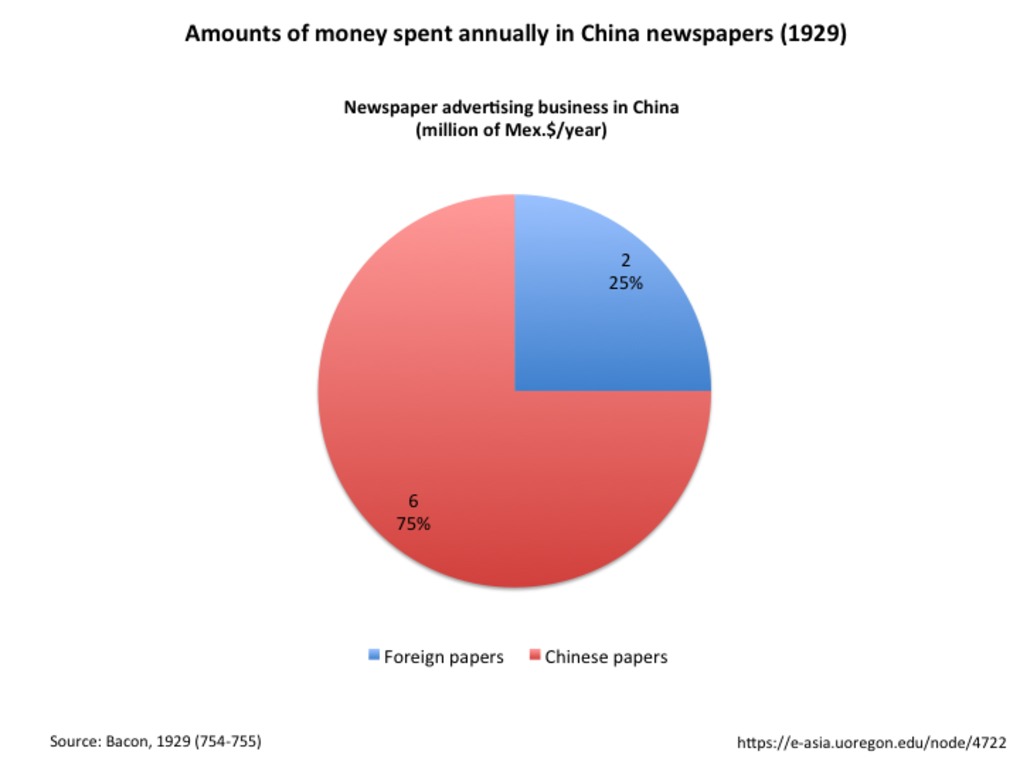 | 231 | Annual advertising expenses in China newspapers: distribution betwen Chinese and foreign newspaper (1929) | This pie charts shows the distribution of the money spent in advertising newspapers between Chinese and foreign newspaper in China before 1929 (expressed in million of mexican dollars/year). Source: Bacon, 1929 (754-755) |
 | 232 | Annual advertising expenses in Shanghai and China newspapers (1929) | This pie charts shows the distribution of the money spent in advertising newspapers in Shanghai and other cities in China before 1929 (expressed in million of mexican dollars/year). Source: Bacon, 1929 (754-755) |
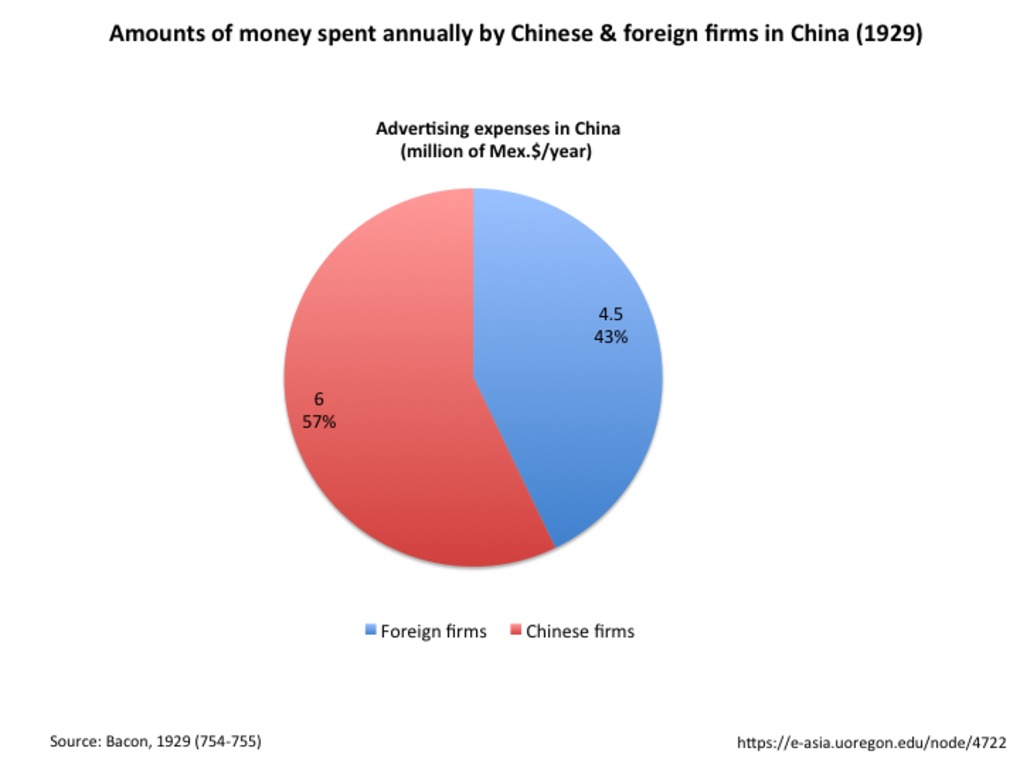 | 233 | Annual advertising expenses by Chinese and foreign firms in China (1929) | This pie charts shows the distribution of the money spent in advertising by Chinese and foreign firms in China before 1929 (expressed in million of mexican dollars/year). Source: Bacon, 1929 (754-755) |
 | 234 | Advertising press media in China: distribution between daily and non daily publications (1929) | This pie chart shows the distribution of press advertising media between daily newspapers and non daily publications (periodicals, magazines) in China before 1929. Source: Bacon, 1929 (755). Daily papers are obviously overwhelming the press business in China before the 1930s (89%). |
 | 239 | Advertising population in the newspaper North China Daily News (1914-1949) | This set of three curves traces the evolutions of advertising population and density in the Shanghai-based British newspaper North China Daily News between 1914 and 1949. The green curve stands for the total number of advertisements (in each sample issue), the grey line indicates the total number of pages in each sample issue, the purple line indicates the average density of ads (number of ads/number of pages) in each sample issue). For consistency reasons, the measurements were made after the same five samples as for the Chinese newspaper Shenbao (January 7, 1914; January 3, 1924; January 5, 1934; February 1, 1941; January 1, 1949). *** Le jeu des trois courbes ci-joint retrace les tendances démographiques globales dans le quotidien britannique North China Daily News entre 1914 et 1949 : l’évolution la population totale par numéro (courbe verte), évolution du nombre de pages (en gris), ainsi que l’évolution de la densité moyenne (c’est-à-dire le rapport entre nombre de publicités totale et nombre de pages, en violet). Par souci de cohérence, les mesures ont été réalisées à partir des mêmes cinq échantillons que pour le Shenbao (7 janvier 1914, 3 janvier 1924, 5 janvier 1934, 1er février 1941, 1er janvier 1949) |
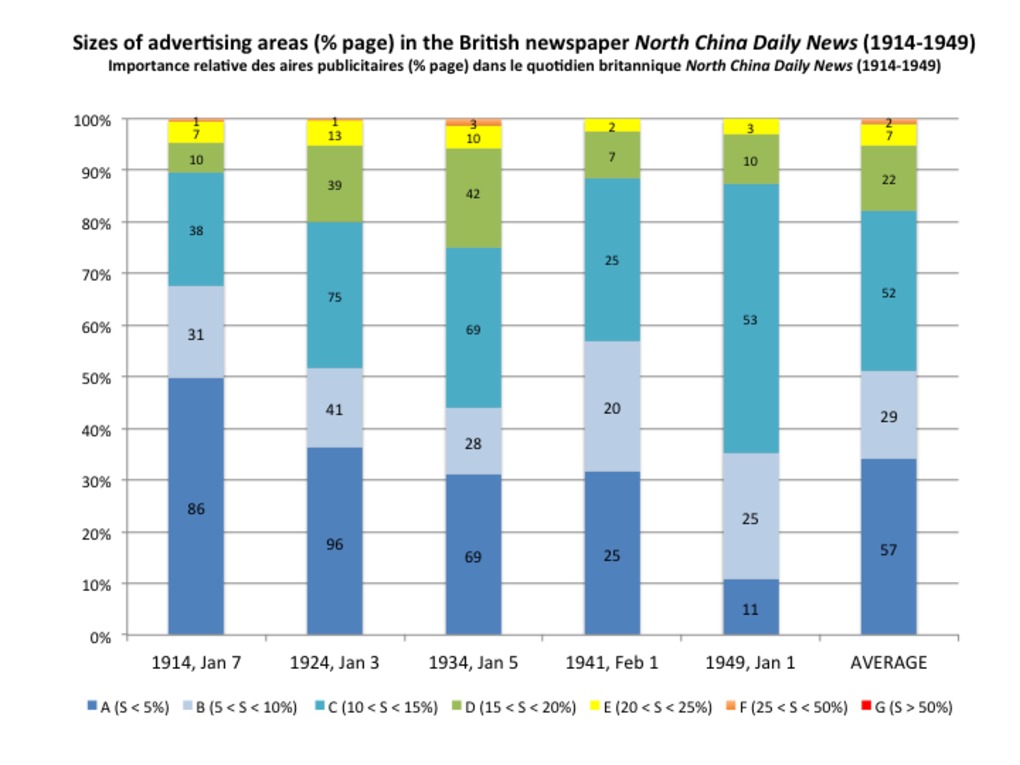 | 240 | Advertising-populated regions in the British newspaper North China Daily News (1914-1949) | This set of bar charts aims to measure the surfaces covered by advertisements in the Shanghai-based British newspaper North China Daily News, according to the following gradual scale of areas*:
*For visibility and convenience reasons, each type has been associated with a letter and a color ("S" standing for "surface"). For consistency reasons, measurements have been made after the same five samples as for the Chinese newspaper Shenbao (Jan 9, 1914; Jan 3, 1924; Jan 5, 1934; Feb 1, 1941; Jan 1, 1949). *** Les histogrammes ci-joint mesurent en termes numériques (nombre d’aires relevant de chaque catégorie) : l’importance relative des aires publicitaires dans le Shenbao, selon l'échelle graduée établie par ailleurs :
Par commoditité et par souci de lisibiité, une lettre et un code couleur a été associé à chaque catégorie. Plus la couleur est « froide » (bleu), plus les aires sont petites (types A, B, C : moins de 15% de la page). Inversement, plus les couleurs sont « chaudes » (du jaune au rouge), plus les surfaces sont étendues (type F et G : plus de 25% de la page). Le vert signale finalement les surface intermédiaires (D et E : entre 15 et 25%). La contance de ce code permet de suivre l’évolution des surfaces au fil des âges et de comparer les deux quotidiens. Par souci de cohérence, les mesures qui suivent ont été réalisées à partir des mêmes échantillons que pour le Shenbao (7 janvier 1914, 3 janvier 1924, 5 janvier 1934, 1er février 1941, 1er janvier 1949). |
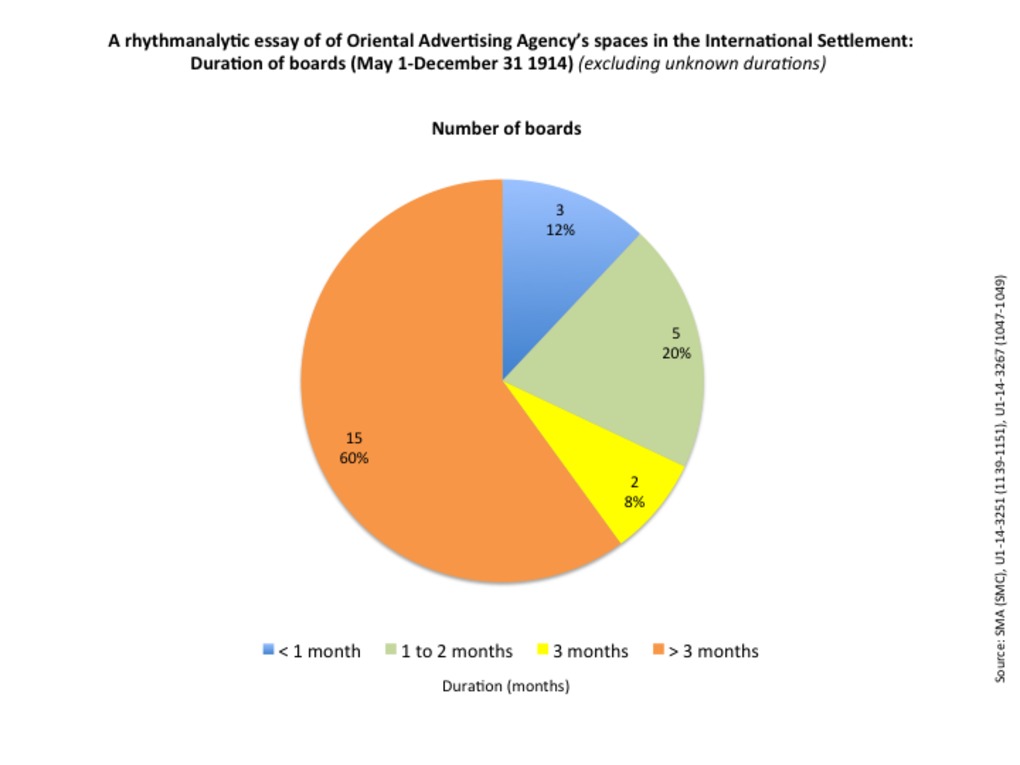 | 262 | A rhythmanalytic essay of Oriental Advertising Agency’s spaces in the International Settlement: Duration of boards (May 1-December 31 1914) | These set of three charts aims to evaluate the lifetimes of Oriental Advertising's boards in the International Settlement during the year 1914. The figure are based on the the census made by the S.M.C. in 1914 and the regular inventories of boards that Oriental Advertising Agency's sent to the Council between May 1 and December 31, 1914. Source: SMA (SMC), U1-14-3251 (1139-1151), U1-14-3267 (1047-1049). The first pie chart ignores the boards for which we do not know the date of removal or end of contract. The second pie chart includes those under-documented artifacts (63%). Both pie charts reveal that despite the war, longer contracts (more than three months) tend to dominate (60%, 22%), followed by contracts between 1 to 2 months (20%, 7%), less than one month (12%, 5%) and eventually three-month contracts (8%, 3%). The last bart chart indicates the average duration of contracts (92 days, about 3 months). Beyond this average figure, it reveals strong gaps between the maximal (153 days) and minimal durations (19 days). |
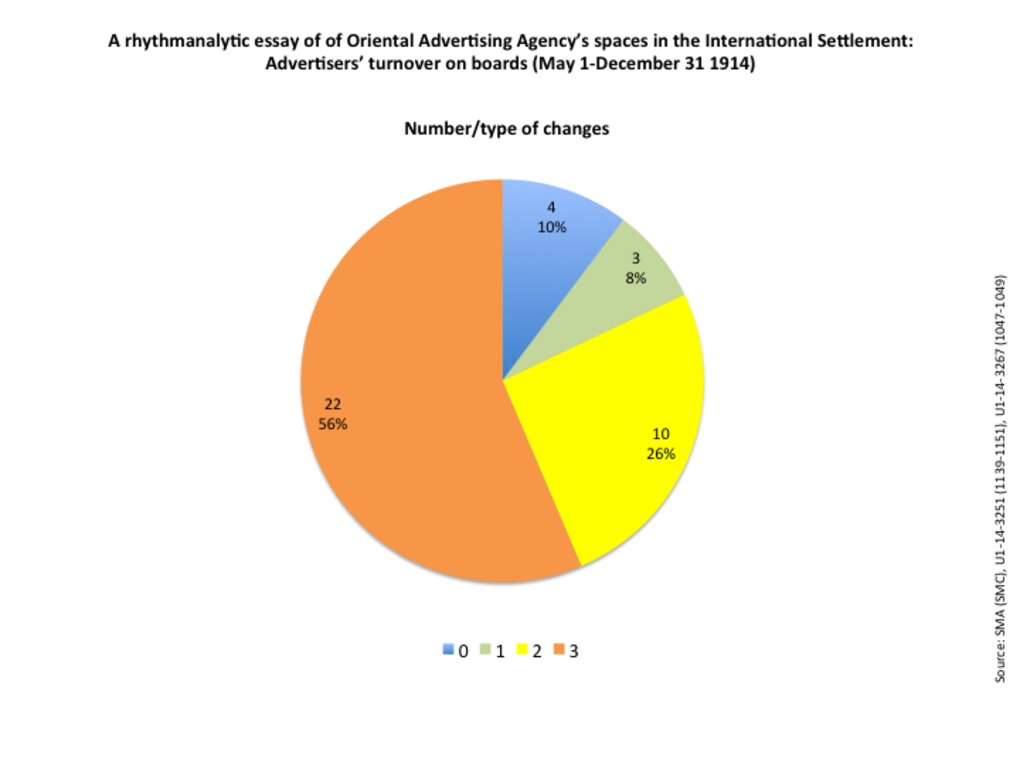 | 263 | Advertisers’ turnover on Oriental Advertising Agency's boards in the International Settlement (May 1-December 31 1914) | These set of three charts aims to refine the rhythmanalysis based on contracts duraction by appreciating the nature and degree of turnover within the same advertising spaces rented by the Oriental Advertising Agency in 1914. For that very purpose, we have established scale of change ranging from 0 to 3:
The pie chart suggests that Oriental Advertising Agency's spaces are marked by a high degree of instability in wartime. The maximal degree of change (3) represent 56% of the changes, followed by changes of location (26%), identical revewal (10%) and change of dimensions. The measurements are based on the the census made by the S.M.C. in 1914 and the regular inventories of Oriental Advertising Agency's boards sent to the Council by the company itself, between May 1 and December 31, 1914. Source: SMA (SMC), U1-14-3251 (1139-1151), U1-14-3267 (1047-1049). |
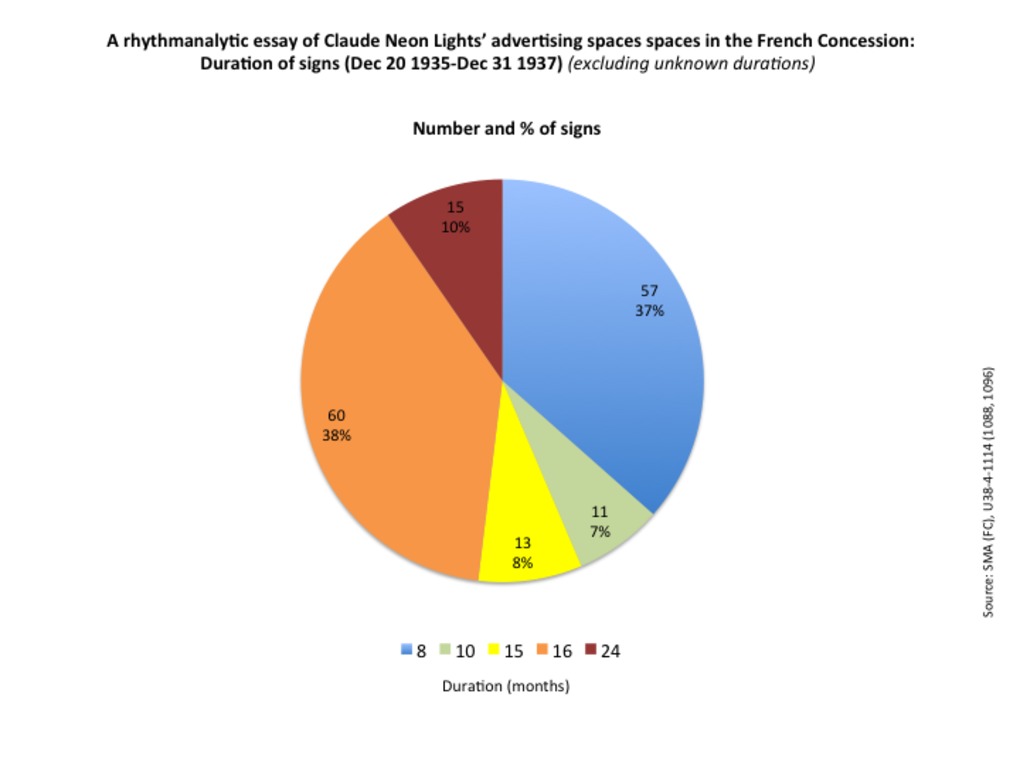 | 272 | A rhythmanalytic essay of Claude Neon Lights’ advertising spaces spaces in the French Concession: Duration of signs (Dec 20 1935-Dec 31 1937) | These set of three charts aims to evaluate the lifetime of Claude Neon Lights' signs in the French Concession between Dec 20, 1935 and Dec 31, 1937. The figures are based on the regular lists of signs that Claude Neon Lights sent to the French Municipal Council between December, 20 1935 and December, 31 1937, plus a few scattered signs recorded in other files in the Shanghai Municipal Archives (French concession and International Settlement in 1931 and 1941). Source: SMA (FC), U38-4-1114; SMA (SMC), U1-14-3261 (0246). The first pie chart ignores the boards for which we do not know the date of removal or end of contract. The second pie chart includes those under-documented artifacts (48%). The last bar charts compare the average, minimal, and maximal duration of contracts. Both pie charts reveal that Claude Neon Lights' signs enjoyed a longer lifetime than Oriental Advertising's boards in 1914. While the latter had lived for less than a year, 66% of the former lasted more than one year, 10% of which had lived for at least 2 years. This temporal lag may be due to the nature of the medium (boards being more temporary than signs, attached to a shop or a building), as well as the relative period of prosperity in the 1930 (in contrast with the war period). Yet it remains questionable to compare figures based on documentation of variable quality and length. |
 | 273 | A rhythmanalytic essay of Claude Neon Lights’ advertising spaces spaces in the French Concession: Duration of contracts/occupation of signs by advertisers (Dec 20 1935-Dec 31 1937) | These set of three charts aims to evaluate the duration of Claude Neon Lights' contracts with various clients in the French Concession between Dec 20, 1935 and Dec 31, 1937. The figures are based on the regular lists of signs that Claude Neon Lights sent to the French Municipal Council between December, 20 1935 and December, 31 1937, plus a few scattered signs recorded in other files in the Shanghai Municipal Archives (French concession and International Settlement in 1931 and 1941). Source: SMA (FC), U38-4-1114; SMA (SMC), U1-14-3261 (0246). The first pie chart ignores the boards for which we do not know the date of removal or end of contract. The second bar chart show the average, minimal and maximal duractions of contracts.
|
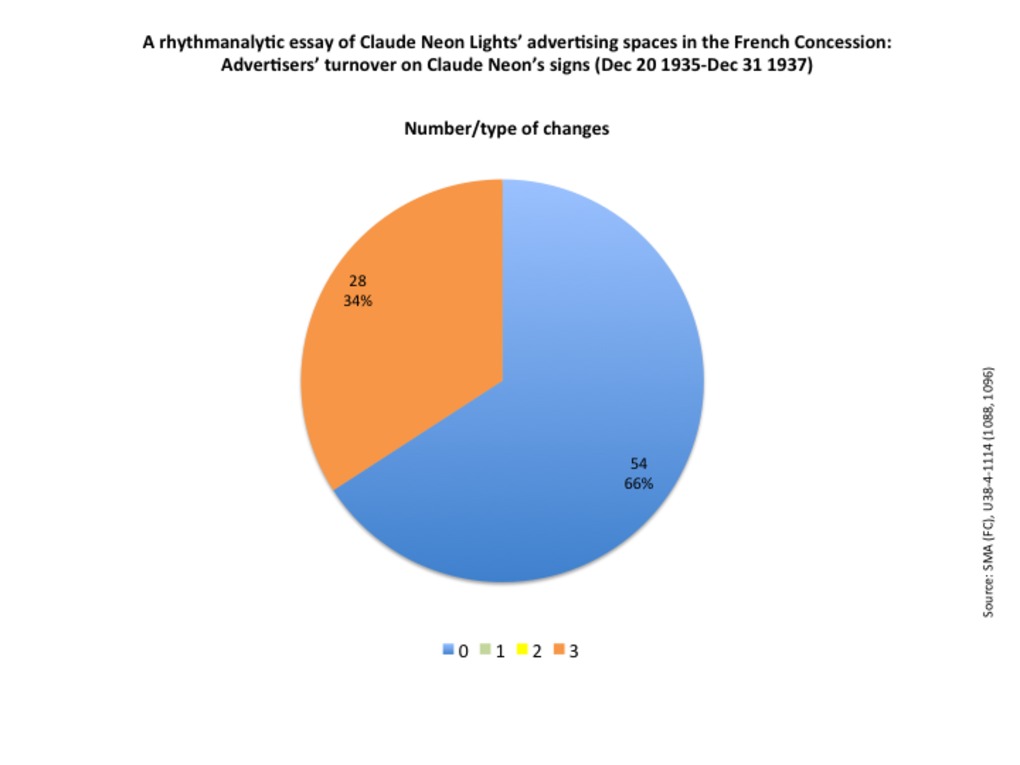 | 274 | Advertiser’s turnover on Claude Neon’s signs in the French Concession (Dec 20 1935-Dec 31 1937) | These set of three charts aims to refine the rhythmanalysis based on contracts duraction by appreciating the nature and degree of turnover within the advertising spaces owned by Claude Neon Lights between 1935 and 1937. For that very purpose, we have established scale of change ranging from 0 to 3:
The pie chart clearly reveals that Claude Neon Lights' signs enjoyed a relatively high degree of stability: 2/3 of signs remained unchanged during the entire period, while only 1/3 had experienced a change of advertiser. On can note that there is no intermediary changes, in terms of location or dimension (either a change of owner, either no change at all). This is due to the nature of the sign itsefl, firmly attached to the shop or building, with fixed dimensions. The measurements are based on the regular lists of signs that Claude Neon Lights sent to the French Municipal Council between December, 20 1935 and December, 31 1937, plus a few scattered signs recorded in other files in the Shanghai Municipal Archives (French concession and International Settlement in 1931 and 1941). Source: SMA (FC), U38-4-1114; SMA (SMC), U1-14-3261 (0246). |
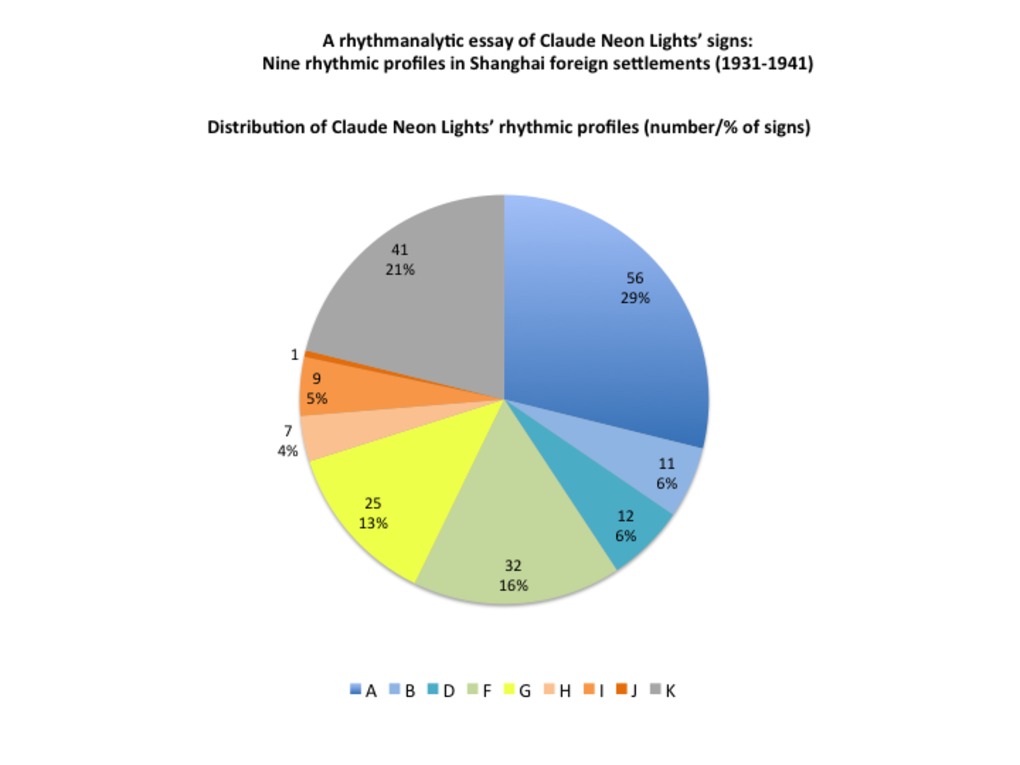 | 275 | A rhythmanalytic essay of Claude Neon Lights’ signs: Nine rhythmic profiles in Shanghai foreign settlements (1931-1941) | This table and the related pie aims to further refine the rhythmanalysis based on signs or advertisers' duraction by combining signs duration and the number of advertisers they respectfully hosted. Such combination has resulted in establishing nine rythmic profiles, noted by a letter from A to K (unknown). The typology is explained in the table, and the share occupied by each rhythmic profile is measured on the pie chart.
The pie chart shows that signs that enjoyed the shortest lifetime with a single advertiser lead the way (almost 30%), followed by longer signs with a single advertiser as well. Signs hosting two or more advertisers represent only a small minority, and the longer, the fewer (13% for shorter signs, and less than 10% for the longest signs). The measurements are based on the regular lists of signs that Claude Neon Lights sent to the French Municipal Council between December, 20 1935 and December, 31 1937, plus a few scattered signs recorded in other files in the Shanghai Municipal Archives (French concession and International Settlement in 1931 and 1941). Source: SMA (FC), U38-4-1114; SMA (SMC), U1-14-3261 (0246). |
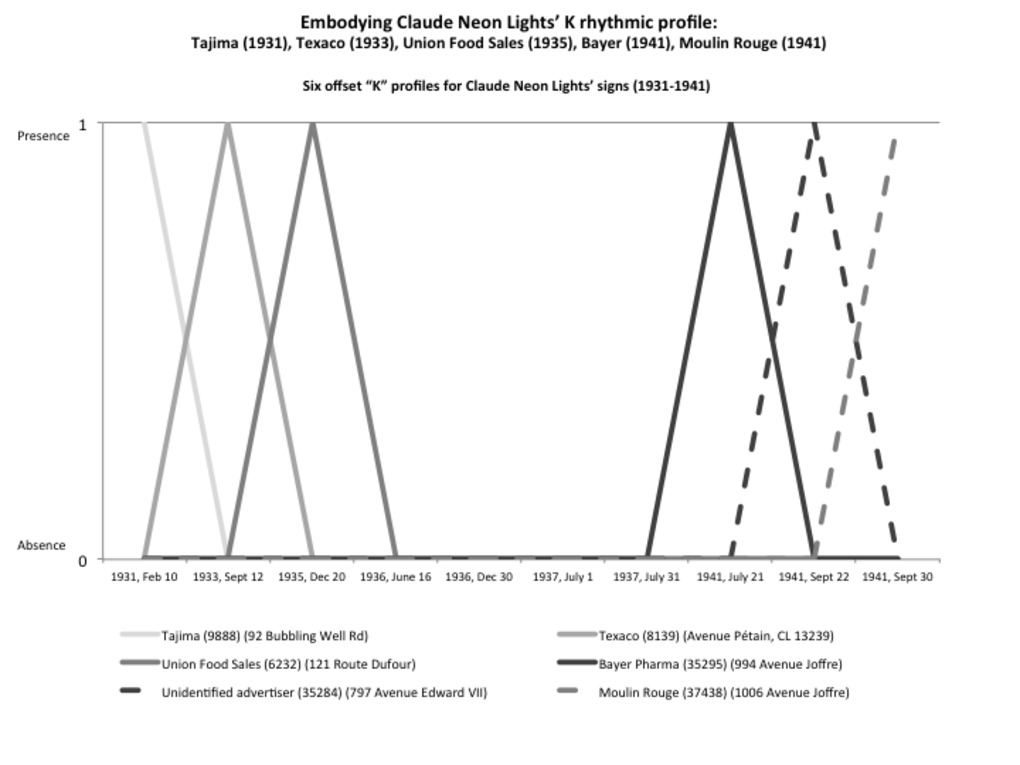 | 276 | A rhythmanalytic essay of Claude Neon Lights’ signs: Embodying the K rhythmic profile (1931-1941) | In order to re-embody to figure and abstract typology of rhythms, this set of graphs aims to trace the lifetime a well-identified sign for each rhythmic profile as described in the related table (see "Related Document"). On this graph, five case studies have been selected to embody the "K" profile (unknown duration). The measurements are based on the regular lists of signs that Claude Neon Lights sent to the French Municipal Council between December, 20 1935 and December, 31 1937, plus a few scattered signs recorded in other files in the Shanghai Municipal Archives (French concession and International Settlement in 1931 and 1941). Source: SMA (FC), U38-4-1114; SMA (SMC), U1-14-3261 (0246). |
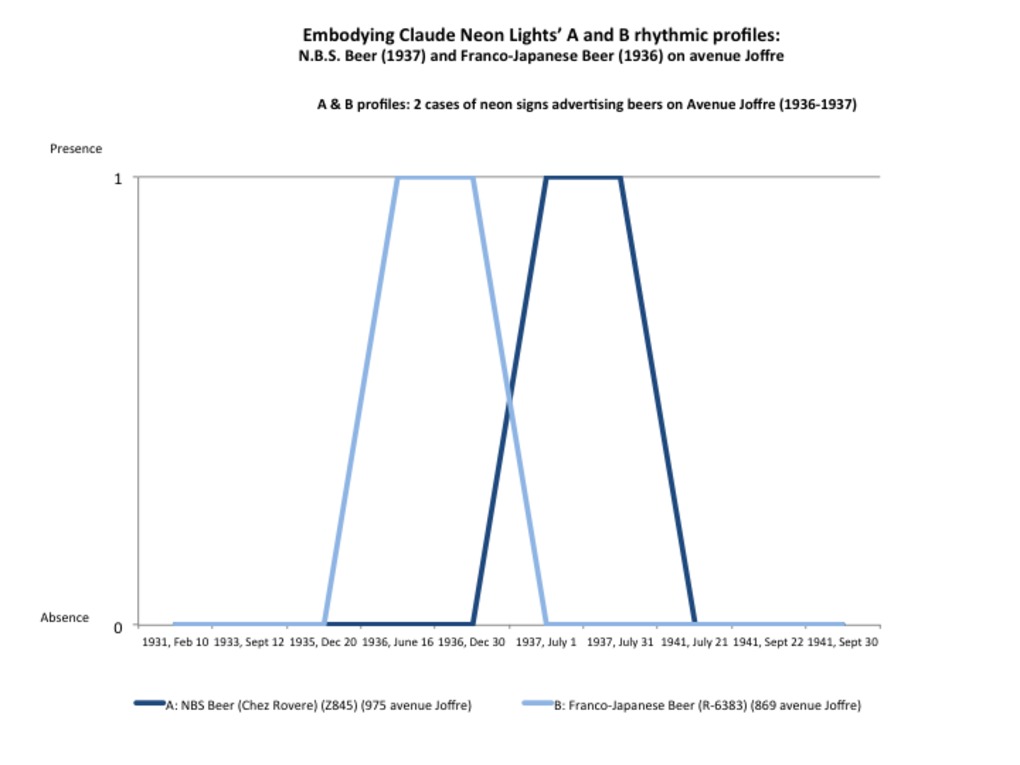 | 277 | A rhythmanalytic essay of Claude Neon Lights’ signs: Embodying the A, B, D, F and H rhythmic profiles (1935-1937) | In order to re-embody to figure and abstract typology of rhythms, this set of graphs aims to trace the lifetime a well-identified sign for each rhythmic profile as described in the related table (see "Related Document"). This set of five graphs precisely aim to embody the profiles with a single advertiser - namely A, B, D, F and H. The measurements are based on the regular lists of signs that Claude Neon Lights sent to the French Municipal Council between December, 20 1935 and December, 31 1937, plus a few scattered signs recorded in other files in the Shanghai Municipal Archives (French concession and International Settlement in 1931 and 1941). Source: SMA (FC), U38-4-1114; SMA (SMC), U1-14-3261 (0246). |
 | 278 | A rhythmanalytic essay of Claude Neon Lights’ signs: Embodying the G, I and J rhythmic profiles (1935-1937) | In order to re-embody to figure and abstract typology of rhythms, this set of graphs aims to trace the lifetime a well-identified sign for each rhythmic profile as described in the related table (see "Related Document"). This set of five graphs precisely aim to embody the profiles with a two or more advertisers - namely G, I and J. The measurements are based on the regular lists of signs that Claude Neon Lights sent to the French Municipal Council between December, 20 1935 and December, 31 1937, plus a few scattered signs recorded in other files in the Shanghai Municipal Archives (French concession and International Settlement in 1931 and 1941). Source: SMA (FC), U38-4-1114; SMA (SMC), U1-14-3261 (0246). |
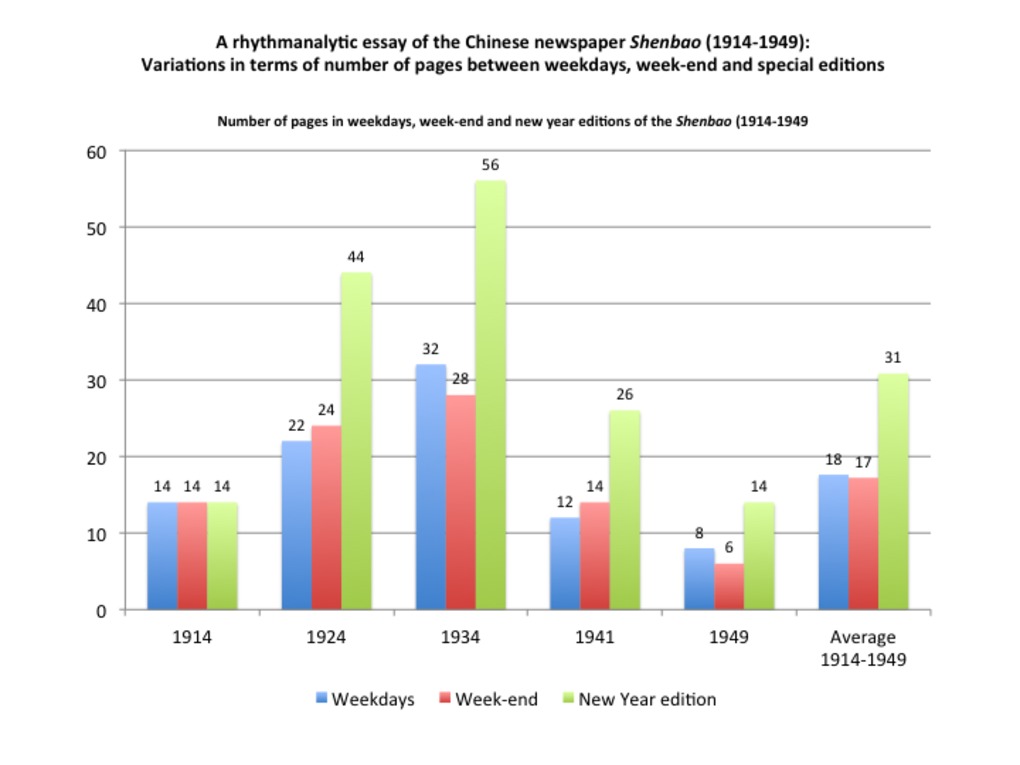 | 280 | A rhythmanalytic essay of the Chinese newspaper Shenbao: three ways of measuring variations between weekdays, week-end and special editions (1914-1949) | This set of three bar charts aims to compare weekdays, week-end and special editions (New Year) of the Chinese newspaper Shenbao between 1914 and 1949. My purpose here is to identify variations in the material dimensions of the newspaper and its advertising spaces. For that very purpose, our five usual samples (Jan 7, 1914, Jan 3 1924, Jan , 1934, Feb 1, 1941, Jan 1, 1949) have been contrasted to week-end and special editions published more or less at the same time. The list of selected samples is provided in the associated table (see the "Tables" section). In each sample issue, we have then measured the three following criteria, directly borrowed from the first and second chapters of my dissertation: number of pages in the issue, advertsing population (number of advertisements in the same issue), advertising area (precisely, the maximal area covered by a single advertisement, on a scale ranging from 0, for subdistricts covering less than 10% of the page, to 4, refering to advertising "empires", i.e. full-page advertisements). The first set of bar charts aims to measure variations in terms of number of pages between weekdays (in blue), week-end (red) and New Year (green) editions. The second bar charts does the same in terms of advertising population, while the third and last graph proceeds in a similar fashion for measuring advertising areas. These graphs reveal two main findings: (1) While there are no obvious differences between weekdays and week-end or special editions at early times (1914) - especially in the North China Daily News (NCDN), which was not published on Sundays, and whose New Year edition is not available that year - and very slight variations at the end of the period (1941-1949), the strongest contrasts are to be found in the 1920-1930s editions, especially in Chinese newspaper Shenbao, whose number of pages more than doubled in New Year editons (Jan 1 1924 and 1934). (2) The number of pages and advertisements are more subject to variations than advertising areas, which usually remained the same, except for New Year editions which are more encouraging to full-page advertisements, especially in the 1930s. By juxtaposing the graphs of the Chinese and British newspapers, two further observations shall be made: (3) The Chinese newspaper Shenbao shows stronger contrasts (between weekdays, week-end and New Year editions) than the British newspaper. Compared to the Chinese newspaper, the NCDN appeared very stable, if not conservative, from one day to another. In 1914 and 1924, it was not published on Sundays (the Sunday edition was probably replaced by its weekly edition, the North China Herald). The sharpest contrasts are to be found in the 1930s, due to the publications of Sunday magazines and special editions (70th Anniversary supplement on July 29, 1934). At the end of the period, (1941-1949), the NCDN appeared more repetitive than ever, probably due to the reduction of expenses and creativity during wartime. (4) Paradoxically, the Chinese newspaper proved more affected by the Western New Year than its British counterpart NCDN. The Chinese editors seemed to have cleverly appropriated the Western tradition as a profitable opportunity for expanding newspaper and advertising spaces. By contrast, the NCDN New Year edition had nothing special. From 1914 to 1949, it appeared quite similar to ordinary editions. |
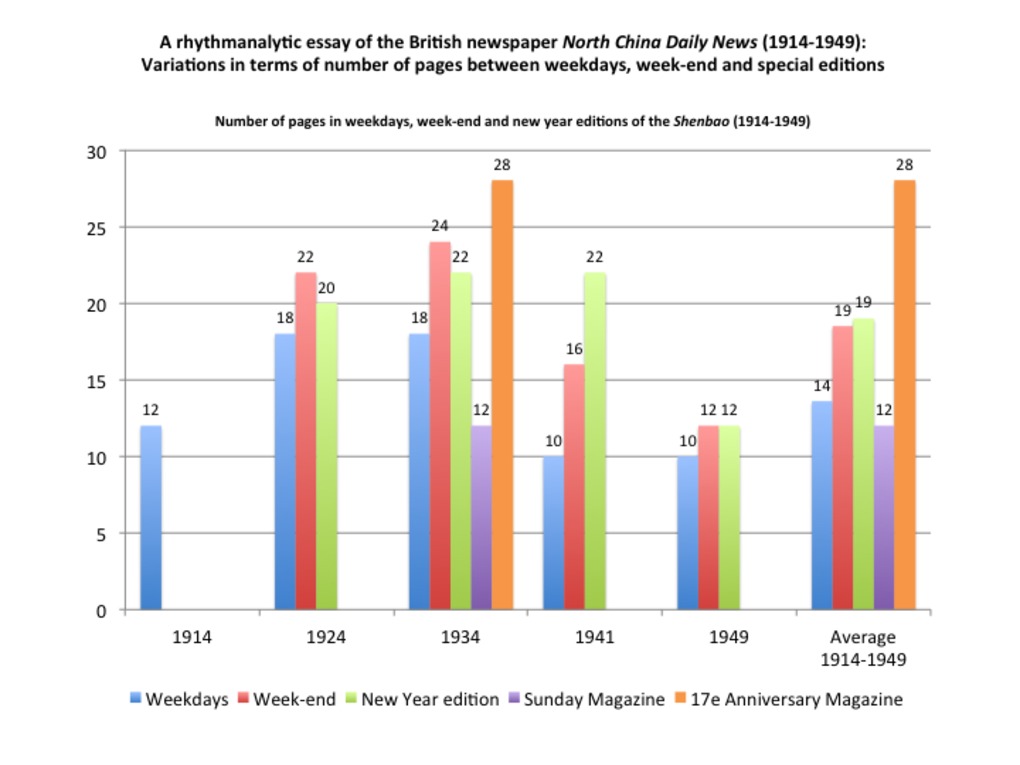 | 281 | A rhythmanalytic essay of the British newspaper North China Daily news: three ways of measuring variations between weekdays, week-end and special editions (1914-1949) | This set of three bar charts aims to compare weekdays, week-end and special editions (New Year) of the Biriths newspaper North China Daily News between 1914 and 1949. My purpose here is to identify variations in the material dimensions of the newspaper and its advertising spaces. For that very purpose, our five usual samples (Jan 7, 1914, Jan 3 1924, Jan , 1934, Feb 1, 1941, Jan 1, 1949) have been contrasted to week-end and special editions published more or less at the same time. The list of selected samples is provided in the associated table (see the "Tables" section). In each sample issue, we have then measured the three following criteria, directly borrowed from the first and second chapters of my dissertation: number of pages in the issue, advertsing population (number of advertisements in the same issue), advertising area (precisely, the maximal area covered by a single advertisement, on a scale ranging from 0, for subdistricts covering less than 10% of the page, to 4, refering to advertising "empires", i.e. full-page advertisements). The first set of bar charts aims to measure variations in terms of number of pages between weekdays (in blue), week-end (red), New Year editions (green), 1930s Sunday magazine (orange) and special Anniversary magazine (purple) in the 1930s. The second bar charts does the same in terms of advertising population, while the third and last graph proceeds in a similar fashion for measuring advertising areas. These graphs reveal two main findings: (1) While there are no obvious differences between weekdays and week-end or special editions at early times (1914) - especially in the North China Daily News (NCDN), which was not published on Sundays, and whose New Year edition is not available that year - and very slight variations at the end of the period (1941-1949), the strongest contrasts are to be found in the 1920-1930s editions, especially in Chinese newspaper Shenbao, whose number of pages more than doubled in New Year editons (Jan 1 1924 and 1934). (2) The number of pages and advertisements are more subject to variations than advertising areas, which usually remained the same, except for New Year editions which are more encouraging to full-page advertisements, especially in the 1930s. By juxtaposing the graphs of the Chinese and British newspapers, two further observations shall be made: (3) The Chinese newspaper Shenbao shows stronger contrasts (between weekdays, week-end and New Year editions) than the British newspaper. Compared to the Chinese newspaper, the NCDN appeared very stable, if not conservative, from one day to another. In 1914 and 1924, it was not published on Sundays (the Sunday edition was probably replaced by its weekly edition, the North China Herald). The sharpest contrasts are to be found in the 1930s, due to the publications of Sunday magazines and special editions (70th Anniversary supplement on July 29, 1934). At the end of the period, (1941-1949), the NCDN appeared more repetitive than ever, probably due to the reduction of expenses and creativity during wartime. (4) Paradoxically, the Chinese newspaper proved more affected by the Western New Year than its British counterpart NCDN. The Chinese editors seemed to have cleverly appropriated the Western tradition as a profitable opportunity for expanding newspaper and advertising spaces. By contrast, the NCDN New Year edition had nothing special. From 1914 to 1949, it appeared quite similar to ordinary editions. |
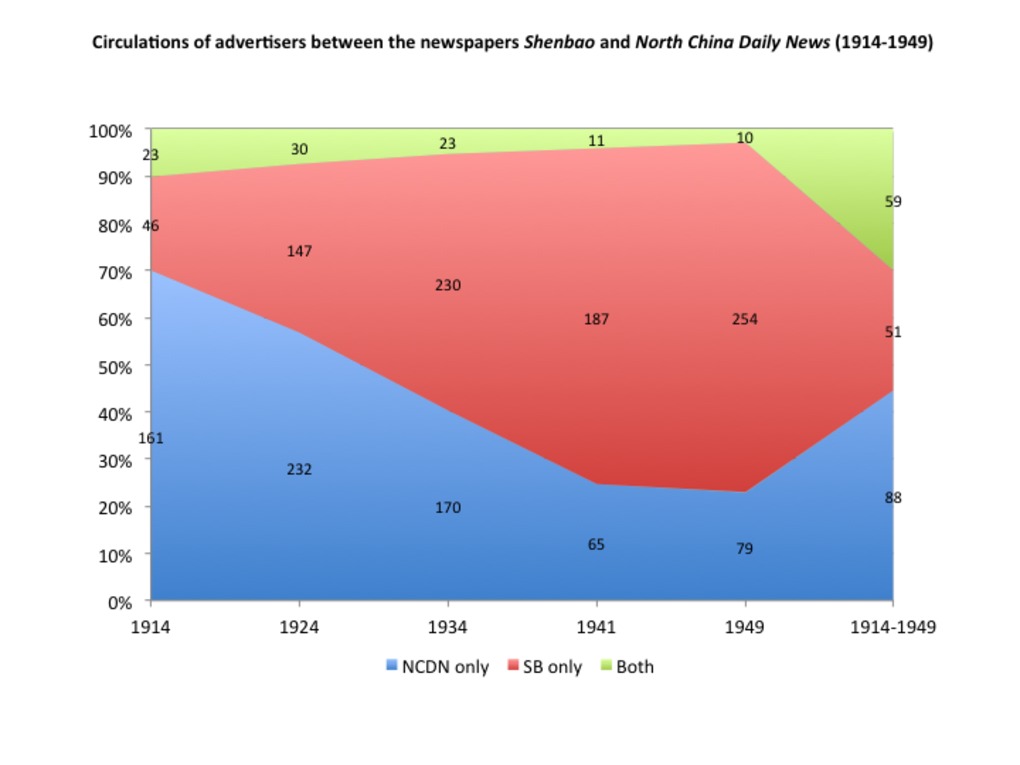 | 282 | Advertisers circulating between the newspapers Shenbao and North China Daily News (1914-1949) | Ce graphique a été réalisé à partir de la table associée : http://madspace.org/cooked/Tables?ID=158 |
 | 283 | Advertisers circulating between the press and streets of Shanghai (1905-1949) | Ce graphique a été réalisé à partir de la table associée : http://madspace.org/cooked/Tables?ID=158 |
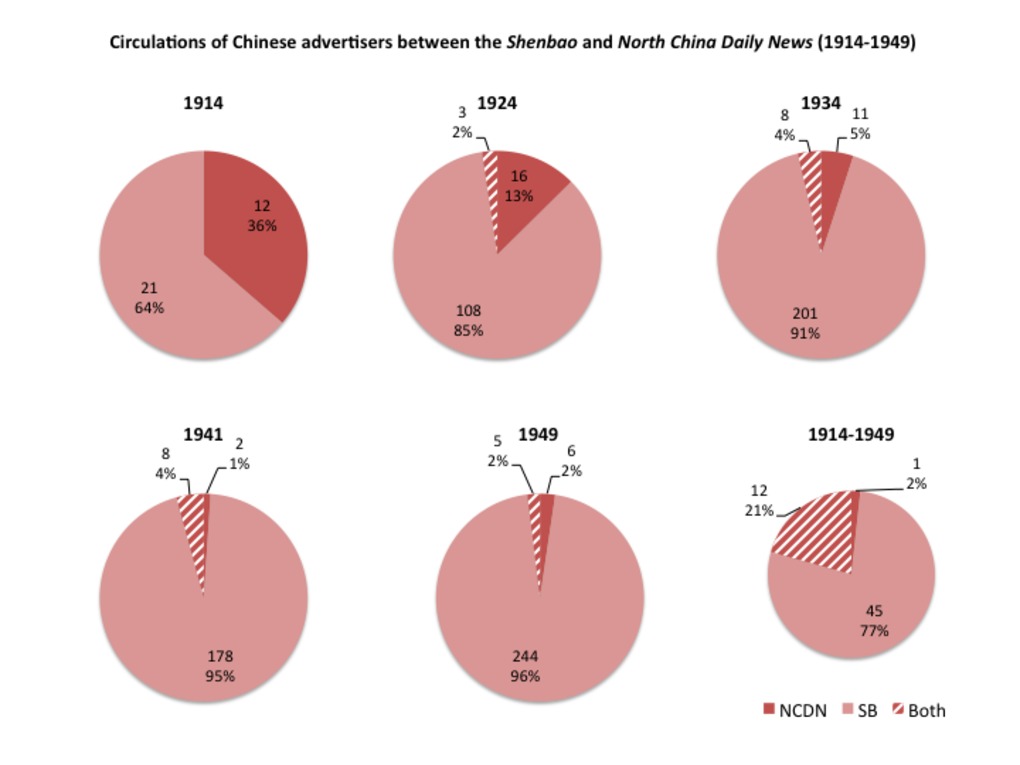 | 284 | Advertisers circulating within the Shanghai press, according to their nationalities: Chinese, Western, Japanese (1914-1949) | Ce triple jeu de six camemberts chacun suit les circulations (ou les blocages) des annonceurs entre le quotidien chinois Shenbao et son homologue britannique North China Daily News, en fonction de leur nationalité. L'objectif est de savoir si certaines "nationalités" sont plus mobiles que d'autres, si les circulations sont multilatérales ou unilatérales d'un journal à l'autre. Ce tableau a été réalisé à partir de la table associée : http://madspace.org/cooked/Tables?ID=158 Le premier ensemble de camemberts suit les annonceurs chinois (rouge), le deuxième les annonceurs "occidentaux" (européens et américains) en bleu, le troisième procède de même pour les annonceurs japonais (en jaune). |
 | 285 | Advertisers circulating between the press and streets of Shanghai, according to their nationalities: Chinese, Western, Japanese (1905-1949) | Ce triple jeu de six camemberts chacun suit les circulations (ou les blocages) des annonceurs la presse et les rues de Shanghai, en fonction de leur nationalité. L'objectif est de savoir si certaines "nationalités" sont plus mobiles que d'autres, si les circulations sont multilatérales ou unilatérales d'un espace à l'autre. Ce tableau a été réalisé à partir de la table associée : http://madspace.org/cooked/Tables?ID=158 Le premier ensemble de camemberts suit les annonceurs chinois (rouge), le deuxième les annonceurs "occidentaux" (européens et américains) en bleu, le troisième procède de même pour les annonceurs japonais (en jaune). |
 | 286 | Advertisers circulating within the Shanghai press, according to their business sector: appearance (B) and culture (C) (1914-1949) | Ce triple jeu de six camemberts chacun suit les circulations (ou les blocages) des annonceurs entre le quotidien chinois Shenbao et son homologue britannique North China Daily News, en fonction de leur secteur d'activité (selon le code adopté dans le quatrième chapitre, associant une lettre et une couleur à chaque secteur: http://madspace.org/cooked/Tables?ID=103). L'objectif est de savoir si certains secteurs productifs sont plus mobiles que d'autres, et si les circulations sont multilatérales ou unilatérales d'un journal à l'autre. Ce tableau a été réalisé à partir de la table associée : http://madspace.org/cooked/Tables?ID=158 Le premier ensemble de camemberts concerne la culture des apparences (B, en rose : cosmétiques, parures, objects décoratifs pour la maison, etc); le second la culture et les produits dits "culturels" (C, en marron). On rappelle que cette catégorie globale inclut les livres, radio, musique, annonces scolaires, cinéma, photographie, matériel bureautique, etc). |
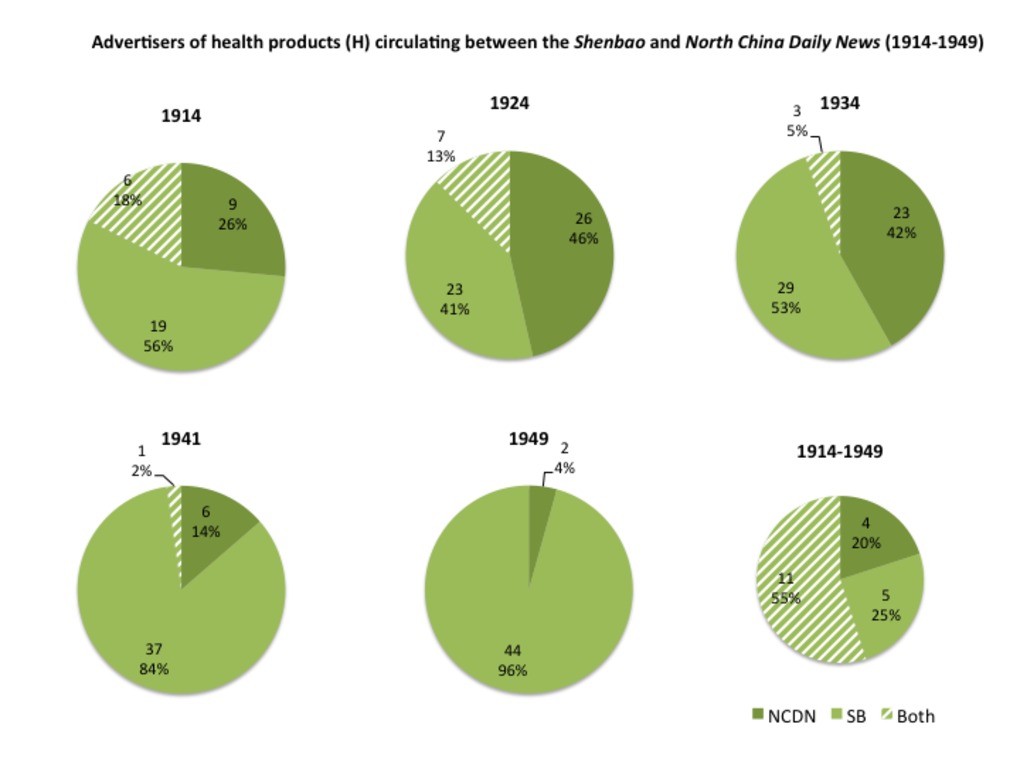 | 287 | Advertisers circulating within the Shanghai press, according to their business sector: health (H) and nutrition (N) (1914-1949) | Ce triple jeu de six camemberts chacun suit les circulations (ou les blocages) des annonceurs entre le quotidien chinois Shenbao et son homologue britannique North China Daily News, en fonction de leur secteur d'activité (selon le code adopté dans le quatrième chapitre, associant une lettre et une couleur à chaque secteur: http://madspace.org/cooked/Tables?ID=103). L'objectif est de savoir si certains secteurs productifs sont plus mobiles que d'autres, et si les circulations sont multilatérales ou unilatérales d'un journal à l'autre. Ce tableau a été réalisé à partir de la table associée : http://madspace.org/cooked/Tables?ID=158 Le premier ensemble de camemberts concerne la santé (H, en vert); le second les aliments et les boissons (N, en marron-vert). |
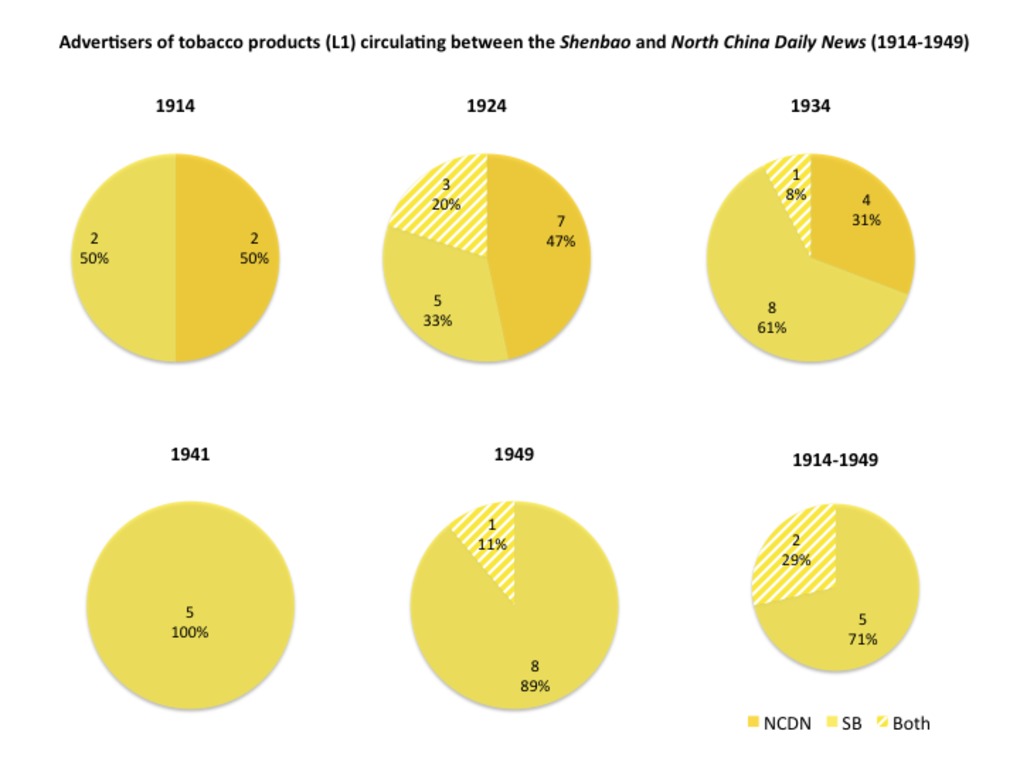 | 288 | Advertisers circulating within the Shanghai press, according to their business sector: tobacco (L1), alcohol (L2) and leisure (L3-L5) (1914-1949) | Ce triple jeu de six camemberts chacun suit les circulations (ou les blocages) des annonceurs entre le quotidien chinois Shenbao et son homologue britannique North China Daily News, en fonction de leur secteur d'activité (selon le code adopté dans le quatrième chapitre, associant une lettre et une couleur à chaque secteur: http://madspace.org/cooked/Tables?ID=103). L'objectif est de savoir si certains secteurs productifs sont plus mobiles que d'autres, et si les circulations sont multilatérales ou unilatérales d'un journal à l'autre. Ce tableau a été réalisé à partir de la table associée : http://madspace.org/cooked/Tables?ID=158 Le premier jeu de camemberts concerne le tabac (L1, en jaune); le deuxième les boissons alcoolisées (L2, en orange foncé); le troisième les loisirs et autres formes de plaisirs (L3-L5) (théâtre, cinéma, bar, restaurant, grand magasin, etc). |
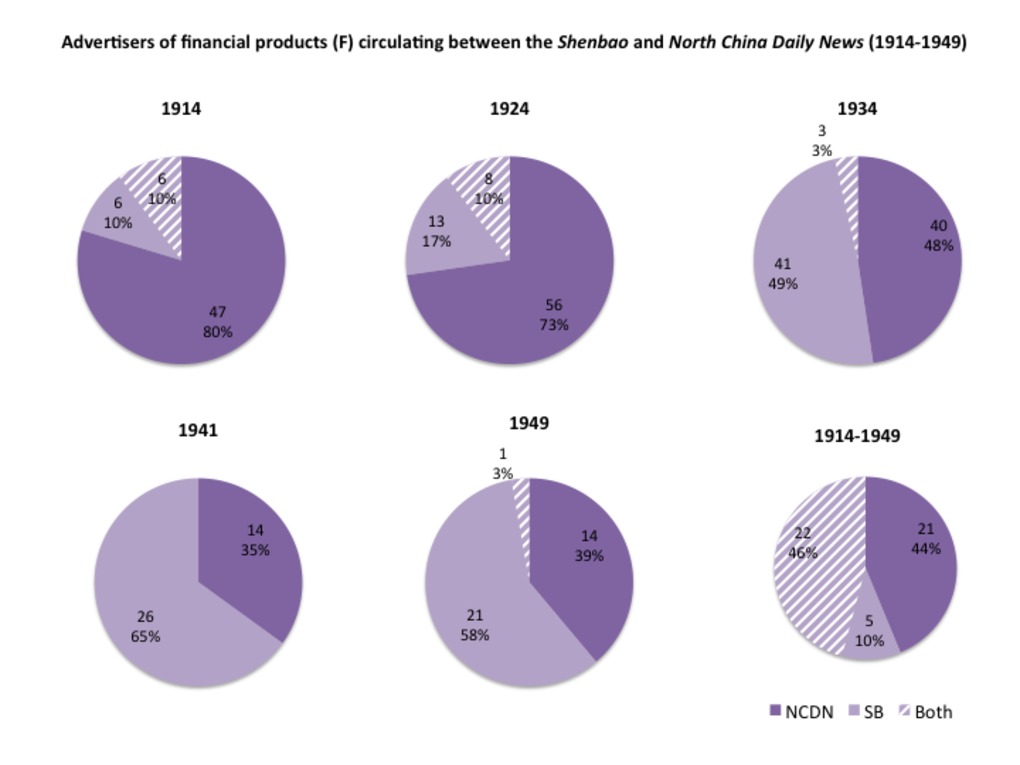 | 289 | Advertisers circulating within the Shanghai press, according to their business sector: industry (E), finance (F) and urban services (U) (1914-1949) | Ce triple jeu de six camemberts chacun suit les circulations (ou les blocages) des annonceurs entre le quotidien chinois Shenbao et son homologue britannique North China Daily News, en fonction de leur secteur d'activité (selon le code adopté dans le quatrième chapitre, associant une lettre et une couleur à chaque secteur: http://madspace.org/cooked/Tables?ID=103). L'objectif est de savoir si certains secteurs productifs sont plus mobiles que d'autres, et si les circulations sont multilatérales ou unilatérales d'un journal à l'autre. Ce tableau a été réalisé à partir de la table associée : http://madspace.org/cooked/Tables?ID=158 Le premier jeu de camemberts concerne le secteur financier (F, en violet); le deuxième l'industrie (E, en gris); le troisième les services (énergie et transports) (U, en bleu). |
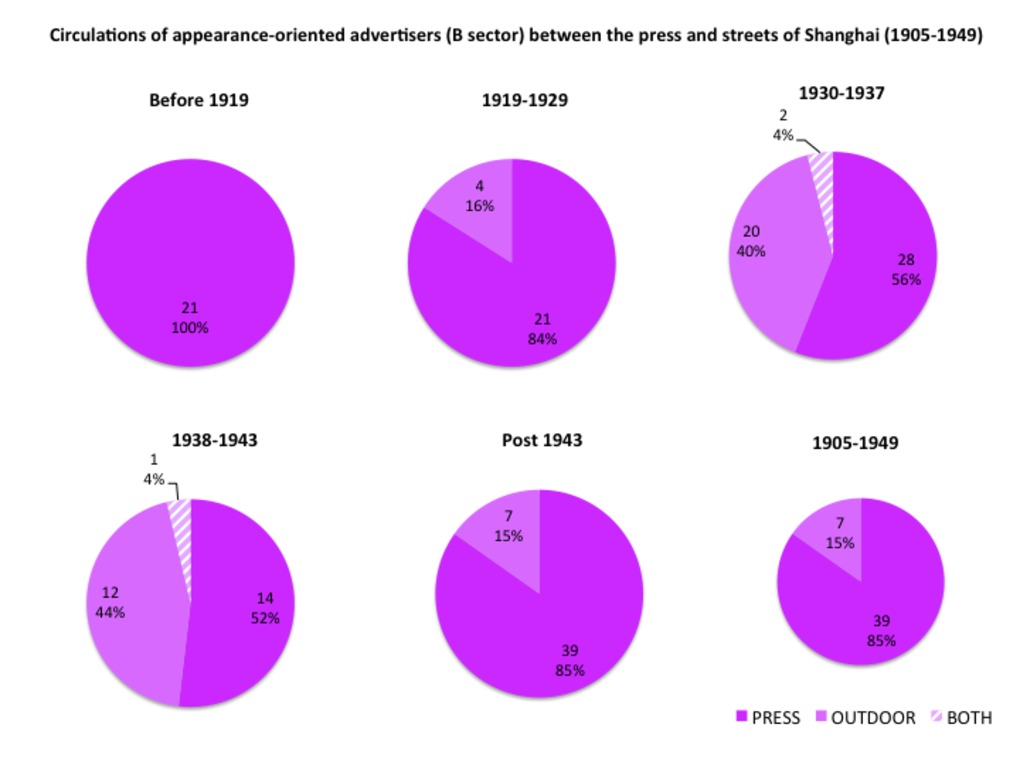 | 290 | Advertisers circulating between the press and streets of Shanghai, according to their business sector: appearance (B) and culture (C) (1914-1949) | Ce triple jeu de six camemberts chacun suit les circulations (ou les blocages) des annonceurs entre la presse et les rues de Shanghai, en fonction de leur secteur d'activité (selon le code adopté dans le quatrième chapitre, associant une lettre et une couleur à chaque secteur: http://madspace.org/cooked/Tables?ID=103). L'objectif est de savoir si certains secteurs productifs sont plus mobiles que d'autres, et si les circulations sont multilatérales ou unilatérales d'un journal à l'autre. Ce tableau a été réalisé à partir de la table associée : http://madspace.org/cooked/Tables?ID=158 Le premier ensemble de camemberts concerne la culture des apparences (B, en rose : cosmétiques, parures, objects décoratifs pour la maison, etc); le second la culture et les produits dits "culturels" (C, en marron). On rappelle que cette catégorie globale inclut les livres, radio, musique, annonces scolaires, cinéma, photographie, matériel bureautique, etc). |
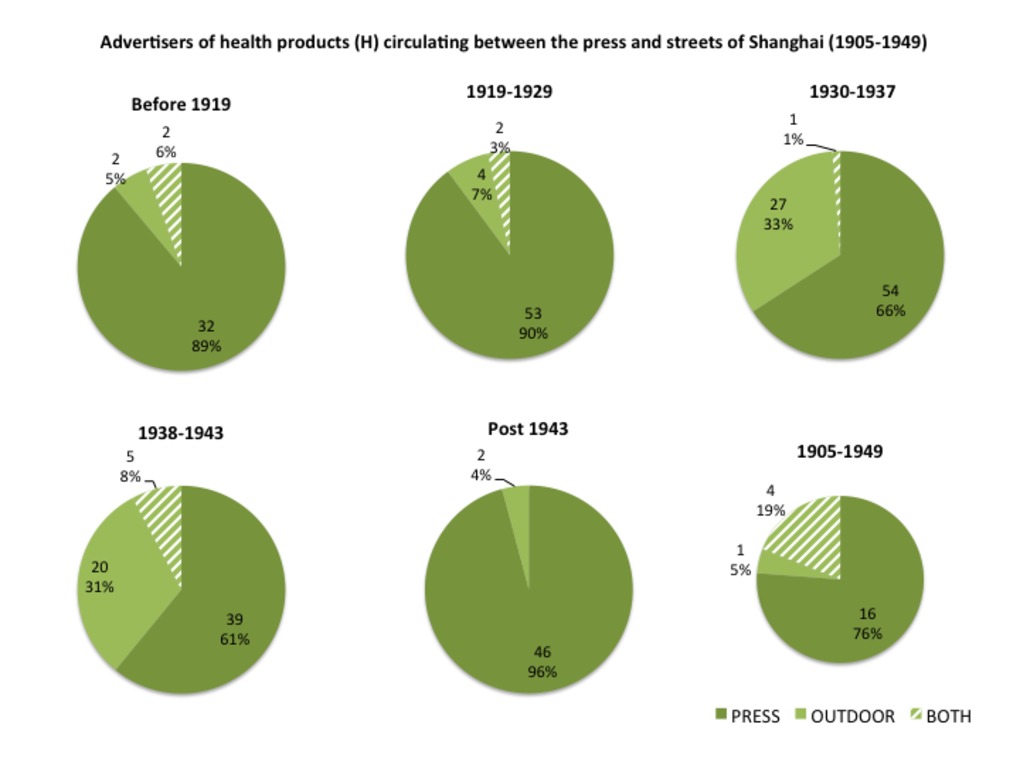 | 291 | Advertisers circulating between the press and streets of Shanghai, according to their business sector: health (H) and nutrition (N) (1914-1949) | Ce triple jeu de six camemberts chacun suit les circulations (ou les blocages) des annonceurs entre la presse et les rues de Shanghai, en fonction de leur secteur d'activité (selon le code adopté dans le quatrième chapitre, associant une lettre et une couleur à chaque secteur: http://madspace.org/cooked/Tables?ID=103). L'objectif est de savoir si certains secteurs productifs sont plus mobiles que d'autres, et si les circulations sont multilatérales ou unilatérales d'un journal à l'autre. Ce tableau a été réalisé à partir de la table associée : http://madspace.org/cooked/Tables?ID=158 Le premier ensemble de camemberts concerne la santé (H, en vert); le second les aliments et les boissons (N, en marron-vert). |
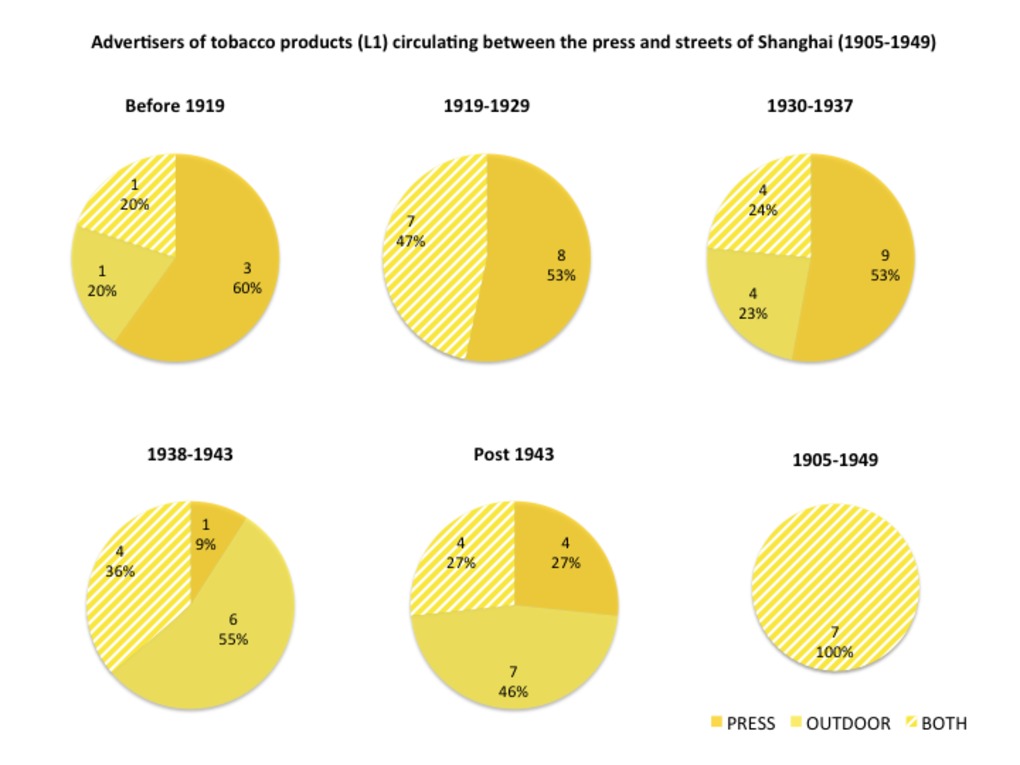 | 292 | Advertisers circulating between the press and streets of Shanghai, according to their business sector: tobacco (L1), alcohol (L2) and leisure (L3-L5) (1914-1949) | Ce triple jeu de six camemberts chacun suit les circulations (ou les blocages) des annonceurs entre la presse et les rues de Shanghai, en fonction de leur secteur d'activité (selon le code adopté dans le quatrième chapitre, associant une lettre et une couleur à chaque secteur: http://madspace.org/cooked/Tables?ID=103). L'objectif est de savoir si certains secteurs productifs sont plus mobiles que d'autres, et si les circulations sont multilatérales ou unilatérales d'un journal à l'autre. Ce tableau a été réalisé à partir de la table associée : http://madspace.org/cooked/Tables?ID=158 Le premier jeu de camemberts concerne le tabac (L1, en jaune); le deuxième les boissons alcoolisées (L2, en orange foncé); le troisième les loisirs et autres formes de plaisirs (L3-L5) (théâtre, cinéma, bar, restaurant, grand magasin, etc). |
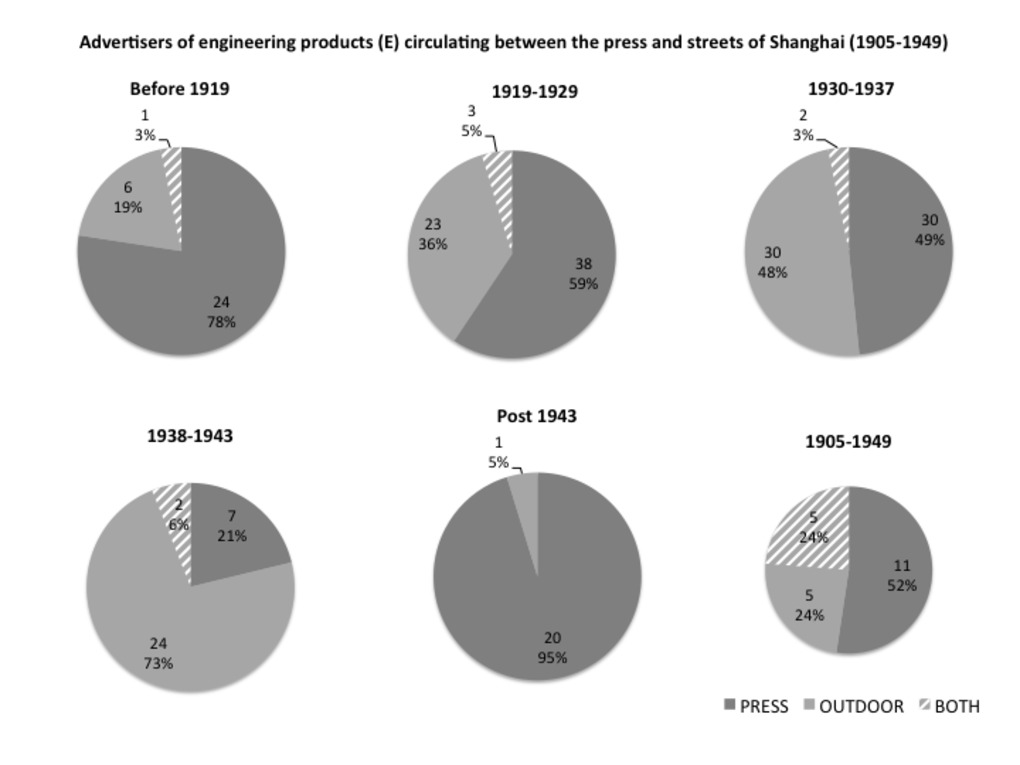 | 293 | Advertisers circulating between the press and streets of Shanghai, according to their business sector: industry (E), finance (F) and urban services (U) (1914-1949) | Ce triple jeu de six camemberts chacun suit les circulations (ou les blocages) des annonceurs entre la presse et les rues de Shanghai, en fonction de leur secteur d'activité (selon le code adopté dans le quatrième chapitre, associant une lettre et une couleur à chaque secteur: http://madspace.org/cooked/Tables?ID=103). L'objectif est de savoir si certains secteurs productifs sont plus mobiles que d'autres, et si les circulations sont multilatérales ou unilatérales d'un journal à l'autre. Ce tableau a été réalisé à partir de la table associée : http://madspace.org/cooked/Tables?ID=158 Le premier jeu de camemberts concerne le secteur financier (F, en violet); le deuxième l'industrie (E, en gris); le troisième les services (énergie et transports) (U, en bleu). |
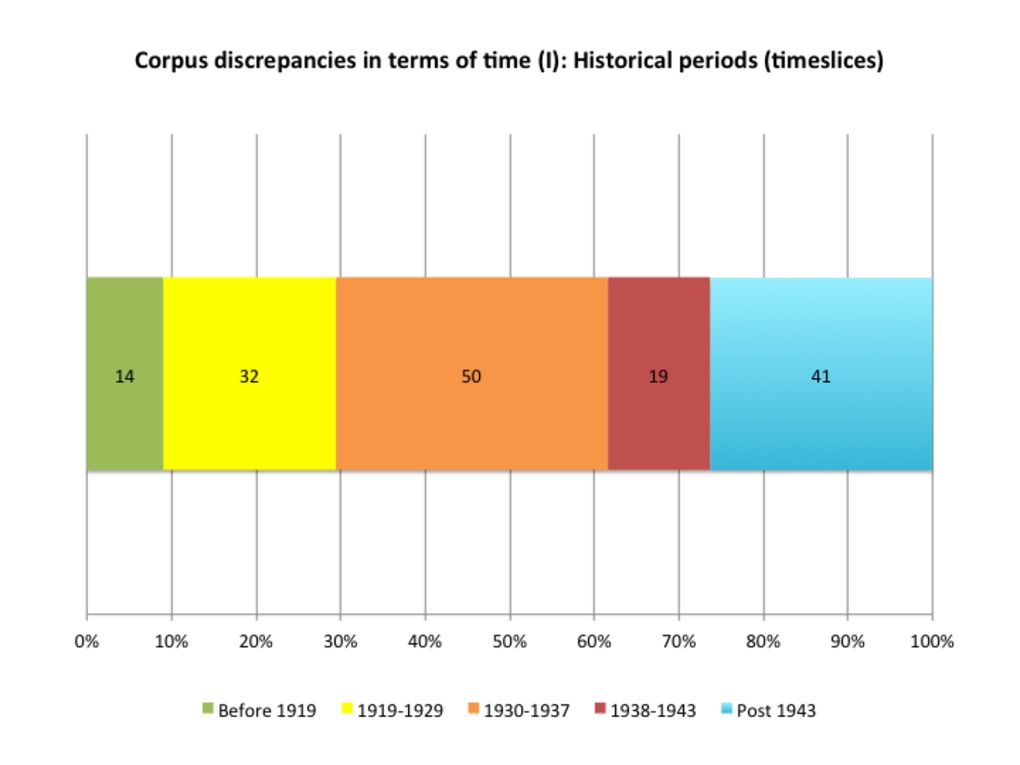 | 310 | A critical view of my photographic corpus (1905-1949): Temporal discrepancies (timeslices) | This graph aims to better visualize corpus discrepancies in terms of time (number and % of photos taken per timeslices). This graph has been drawn after the related table (See the "Tables" section - Table 171). |
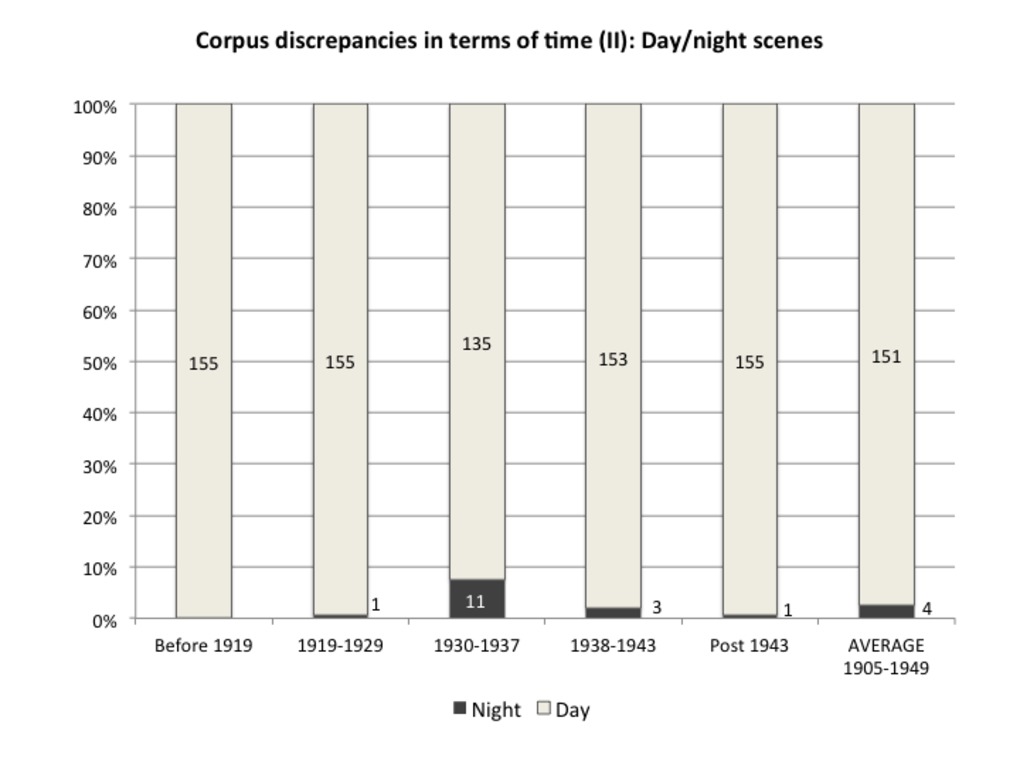 | 311 | A critical view of my photographic corpus (1905-1949): Temporal discrepancies (day/night scenes) | This graph aims to better visualize corpus discrepancies in terms of time - more precisely the uneven distribution between day/night scene, depending on timeslices. This graph been drawn after the related table (See the "Tables" section - Table 171). |
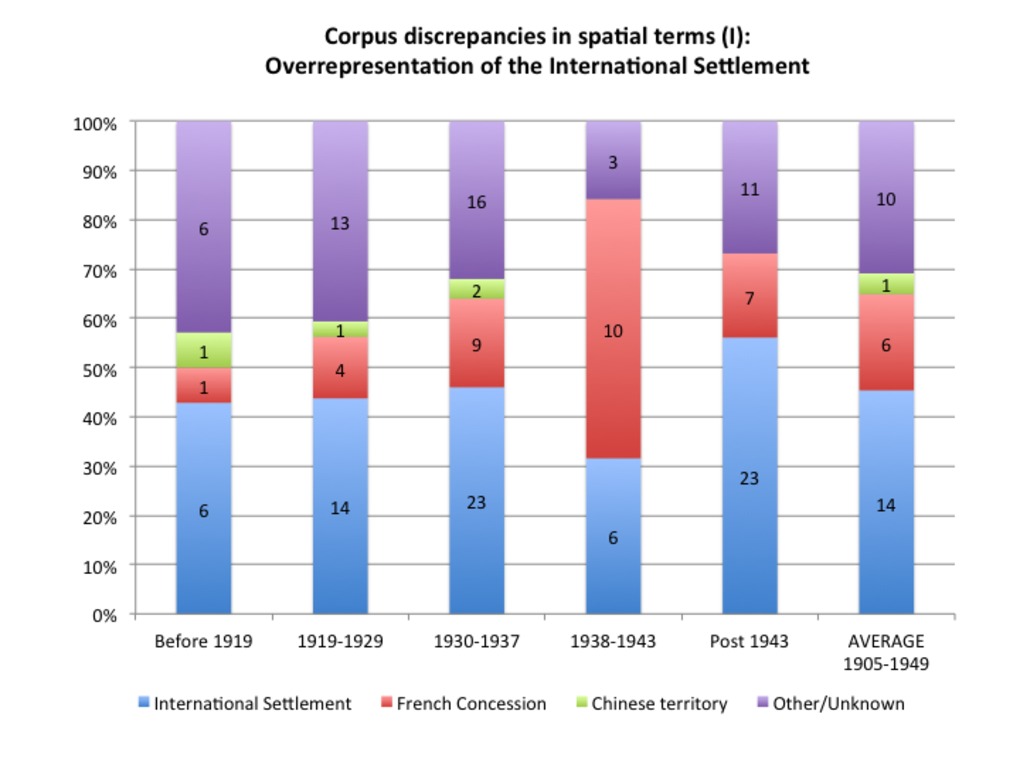 | 312 | A critical view of my photographic corpus (1905-1949): Spatial discrepancies (I): Overrepresentation of the International Settlement | This graph aims to better visualize corpus discrepancies in terms of space - more precisely the overrepration of the International Settlement (compared to French Concession and Chinese territories) depending on timeslices. It also reveals difficulties to attribute precise locations to many photos (especially before the 1930s). This graph has been drawn after the related table (See the "Tables" section - Table 171). |
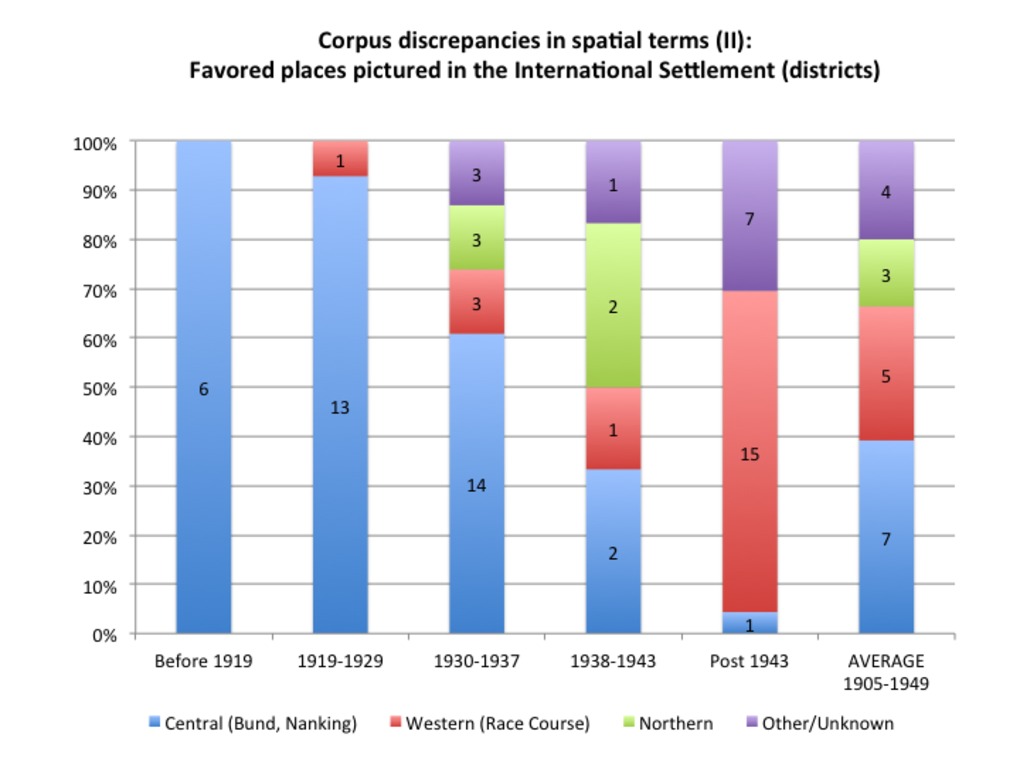 | 313 | A critical view of my photographic corpus (1905-1949): Spatial discrepancies (II): Favored places pictured the International Settlement | This graph aims to better visualize corpus discrepancies in terms of space - more precisely the overrepration of the Central district (Bund, Nanking Road, etc), and to a lesser extent, the Western district (Race Course) in the International Settlement - depending on timeslices. This graph eventually reveals photographic "topoi" or landmarks in Shanghai. It also reflects difficulties to attribute precise locations to many photos (especially before the 1930s). This graph has been drawn after the related table (See the "Tables" section - Table 171). |
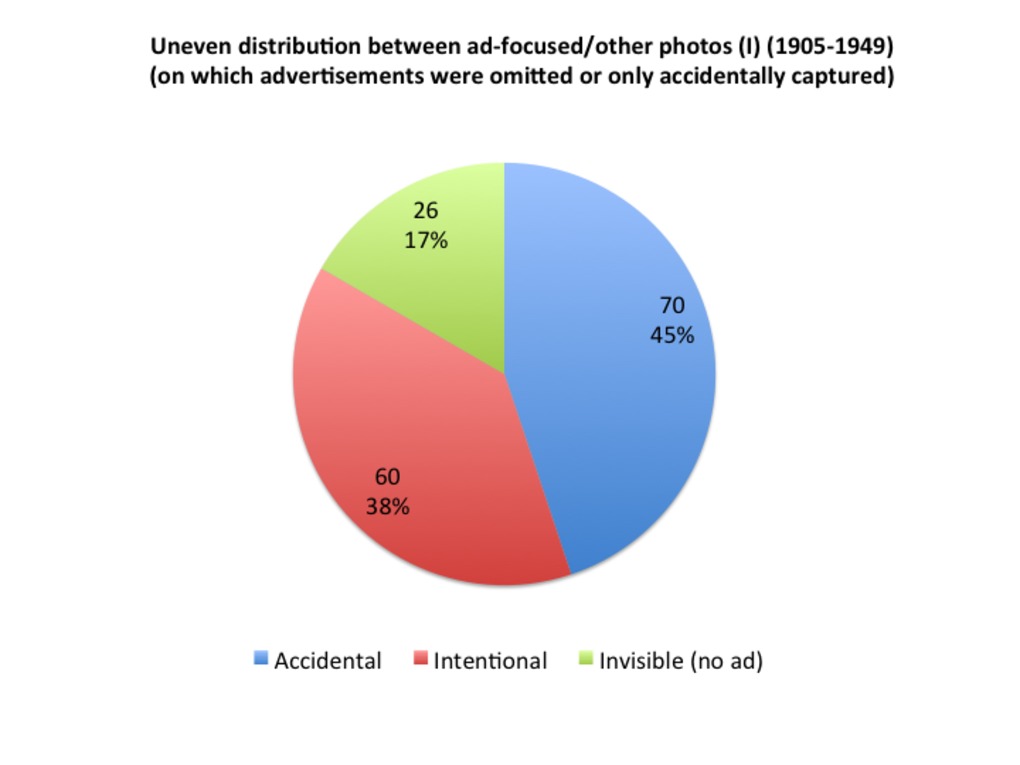 | 314 | A critical view of my photographic corpus (1905-1949): Uneven distribution between ad-focused and other photos (all period included) | This graph aims to better visualize the uneven distribution between ad-focused photos (photos that took advertisements as their intentional targets) (in red) and other photos (on which advertisements were either omitted or only accidentally captured). This graph has been drawn after the related table (See the "Tables" section - Table 171). |
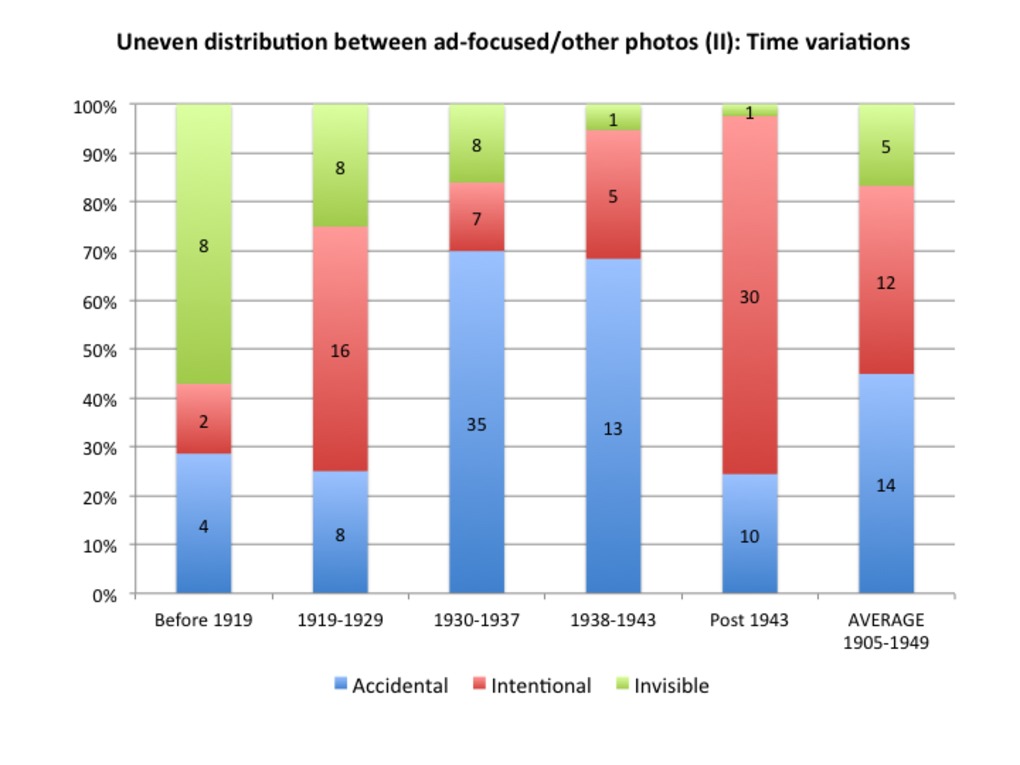 | 315 | A critical view of my photographic corpus (1905-1949): Uneven distribution between ad-focused and other photos (time variations) | This graph offered a refined view of the uneven distribution between ad-focused photos (photos that took advertisements as their intentional targets) (in red) and other photos (on which advertisements were either omitted or only accidentally captured), taking the time period into account. This graph reveals an increased advertising awareness at the end of the period - or more exactly, that professional photographers who chose advertisements as their intentional target were concentrated in the 1940s. This graph has been drawn after the related table (See the "Tables" section - Table 171). |
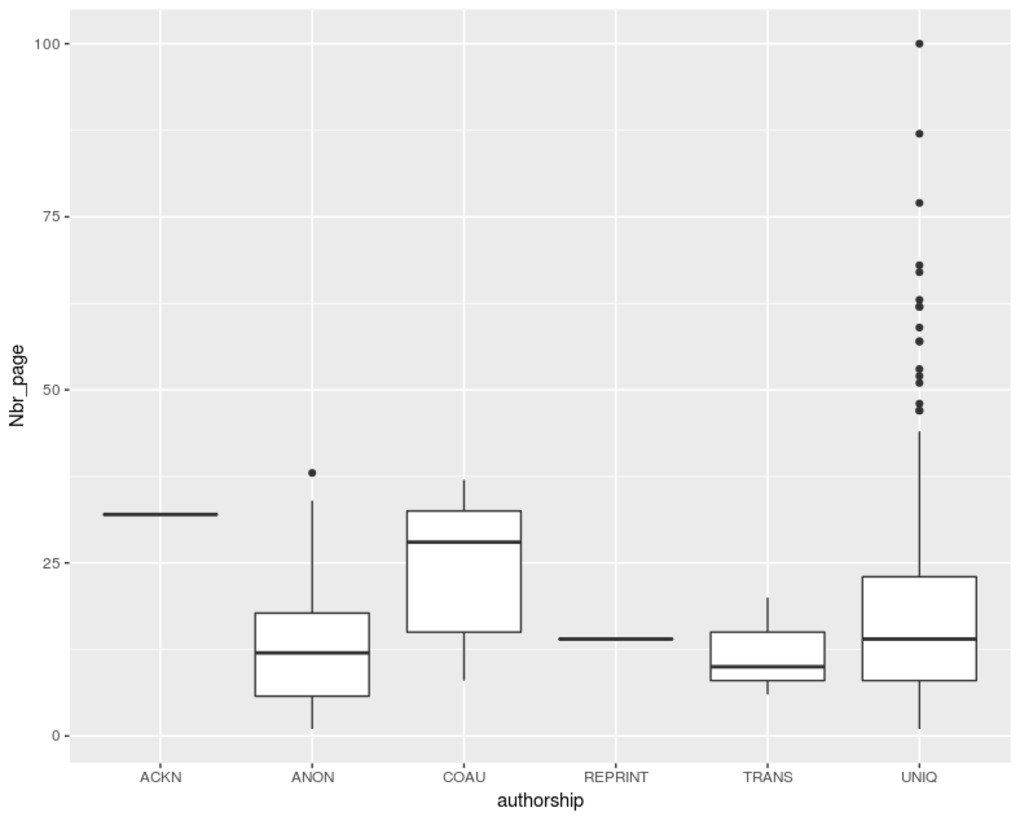 | 347 | Authorship in the Chinese Economic Journal | Based on the following dataset, the attached graphs explore the nature of authorship the Chinese Economic Monthly/Journal between 1924 and 1936, in relation to the the length of articles (1) and to the topics they addressed (2, 3). Relying on R package "ggplot2", we alternatively used boxplots (1, 2) and bar charts (3). The codes used for classifying topics and authorship are described in the notice attached to the original dataset. |


- RAW DATA
- COOKED DATA
- NARRATIVES
- REFERENCES
- DATABASES
41 documents
return to data set
Contact us
Cécile Armand Institut d'Asie Orientale ENS de Lyon, Site Descartes 15 Parvis René Descartes 69341 Lyon Cedex 07 France Email: cecile.armand@gmail.com
Around the Web
![]()
![]()
![]()