


| ID | Title | Description | |
|---|---|---|---|
 | 146 | Deux générations de maux et de médicaments d'après le Shenbao (1914-1949) | Cette série de cinq camemberts visualisent la répartition et lrévolution des types de maux et de traitements exposés dans le Shenbao, entre 1914 et 1949, à partir de nos cinq échantillons habituels. Ils mettent en évidence un renouvellement des générations de maux et médicaments autour de 1934, qui traduit l'émergence d'une industrie pharmaceutique "moderne" et de maux propres à la "modernité" urbaine. Toutefois, les maux/traitements nouveaux ne remplacent pas définitivement les anciens, qui résistent et coexistent avec la nouveauté. |
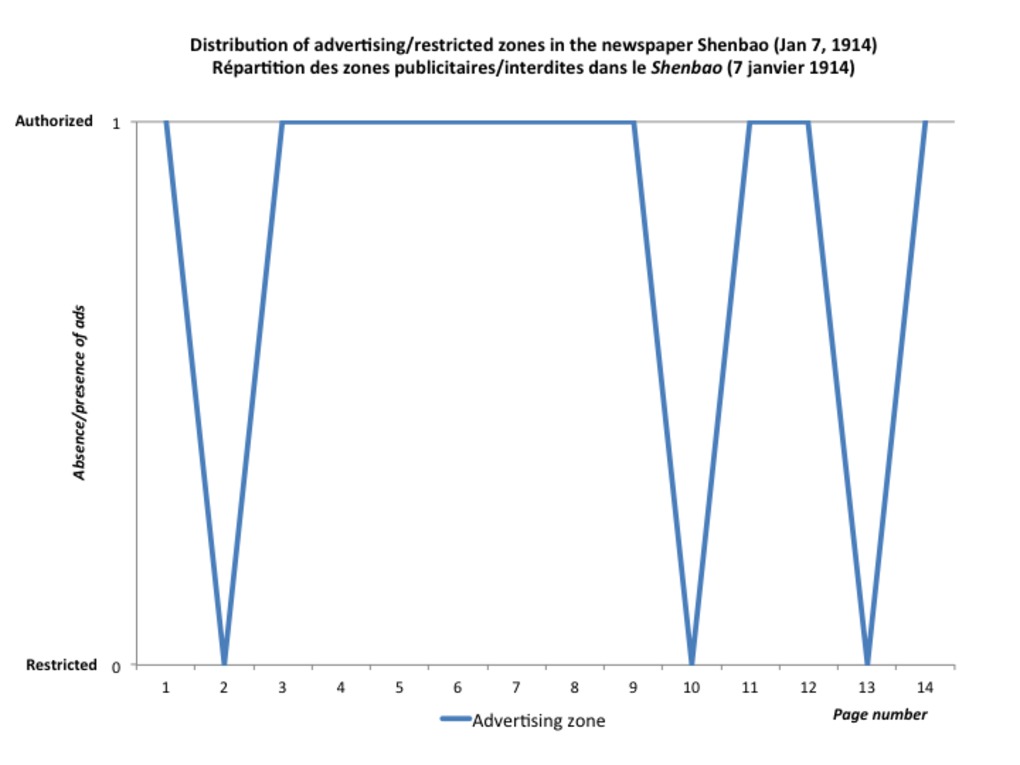 | 208 | Distribution of advertising/restricted zones in the newspaper Shenbao (1914-1949) | Rough English translation This set of line five graphs aim to visualize the distribution of advertising zones in the newspaper Shenbao, in our five usual samples: Jan 7, 1914 ; Jan 3, 1924 ; Jan 5, 1934 ; Feb 1, 1941 ; Jan 1, 1949. Page numbers are indicated on the X axis ; Y axis indicate the presence (1) or absence (1) of advertisements on the corresponding page. This graphs help to locate authorized/restricted zones in the newspaper Shenbao. By juxtaposing the five successive graphs, one can trace the changes in the newspaper policy towards advertising - either to a more restrictive or liberal policy, and the possible migrations of restricted/authorized zones from one page to aonther accross time. |
 | 210 | Division between advertising space/non commercial space (restricted zone) in the Chinese newspaper Shenbao between 1914 and 1949 (distant reading) | Ces histogrammes mesurent à distance ou "à vue de nez" (en nombre de pages) la répartition de l'espace du journal entre espace publicitaire/zone autorisée (en bleu) et contenus non commerciaux/zone interdite de publicité (en rouge) dans nos cinq échantillons habituels du Shenbao : 7 janvier 1914, 3 janvier 1924, 5 janvier 1934, 1er février 1941, 1er janvier 1949. Dans un premier temps, on s'est contenté de recenser et départager les pages qui étaient occupées par des publicités (pages autorisées) de celles qui en étaient dépourvues (zones interdites). Cette approche sera affinée par des mesures rigoureuses de la surface effectivement occupée par chaque type de zone. Rough English translation These bar charts offer a distant measuring (by counting the number of pages) of the division between advertising space (blue)/non commercial space (red) in the newspaper Shenbao between 1914 and 1949. The measurements were made from our usual samples of the Shenbao: January 7, 1914; January 3, 1924; January 5, 1934; February 1, 1941; January 1, 1949. In this preliminary approach, the method simply consists in counting the numbers of pages occupied by advertisements (authorized pages/zones), and separating them from the pages strictly deprived from advertisements (restricted zones/pages). This "distant approach" will be refined by a close and precise measuring of the surfaces actually occupied by each type of zone.
|
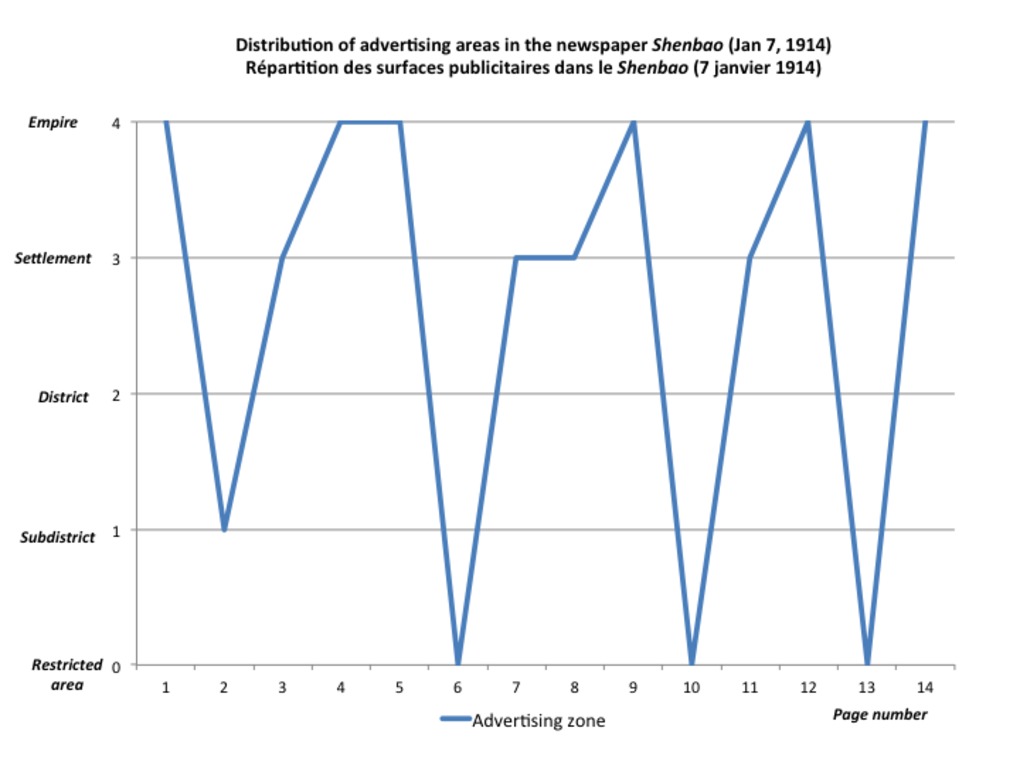 | 211 | Distribution of advertising areas in the newspaper Shenbao (1914-1949) | Rough English translation This set of five graphs aim to visualize the distribution of the four types of advertising areas previously identified:
N.B. Number "0" and white color stand for restricted zones (no ads). Page numbers are indicated on the "X" axis, while area code (from 1 to 4) are indicated on the "Y axis". By juxtaposing the five successive graphs, one can trace the changes of sizes and the migrations of advertising areas accros the newspaper issue between 1914 and 1949. The measurements were made from our five usual samples of the newspaper Shenbao: Jan 7, 1914 ; Jan 3, 1924 ; Jan 5, 1934 ; Feb 1, 1941 ; Jan 1, 1949.
|
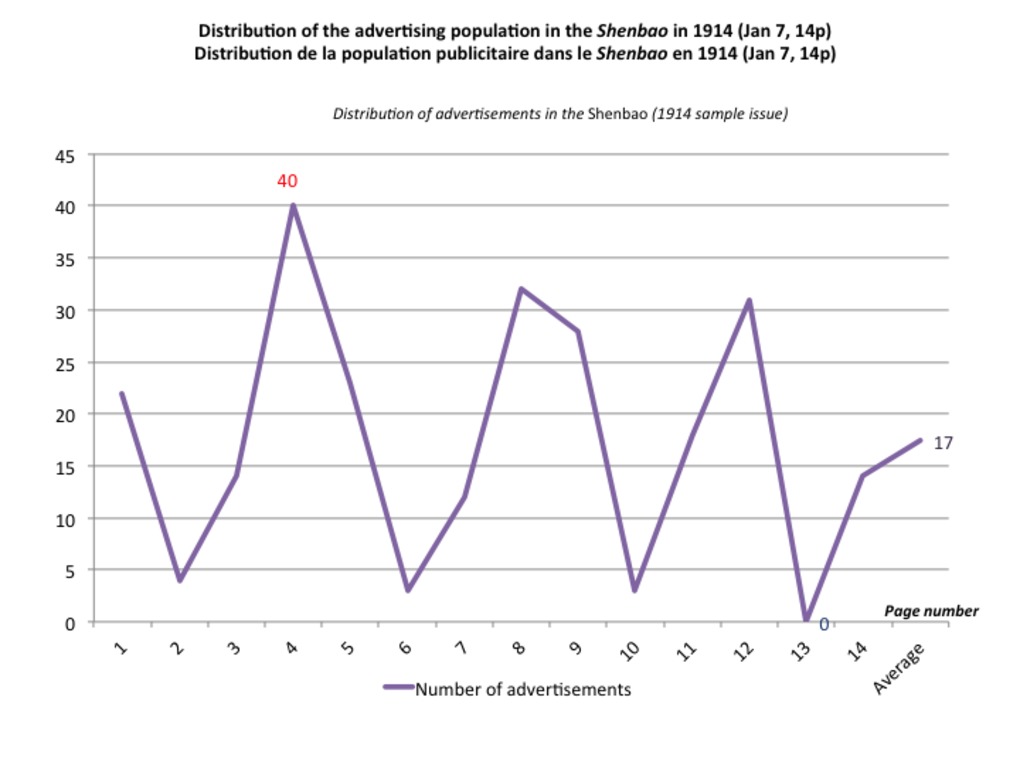 | 222 | Distribution of the advertising population in the newspaper Shenbao (1914-1949) | This set of five curves aims to trace the distribution of the advertising population (number of advertisements per page) in each sample of the newspaper Shenbao. Each curve reveal the variations of population from a page to another. By juxtaposing the five curves, one can trace the changes in this demographic distribution. The measurement have been made our five usual samples of the Shenbao (January 7, 1914; January 3, 1924; January 5, 1934; February 1, 1941; January 1, 1949). The blue color indicates minimal figures; the red color stands for maximal numbers. |
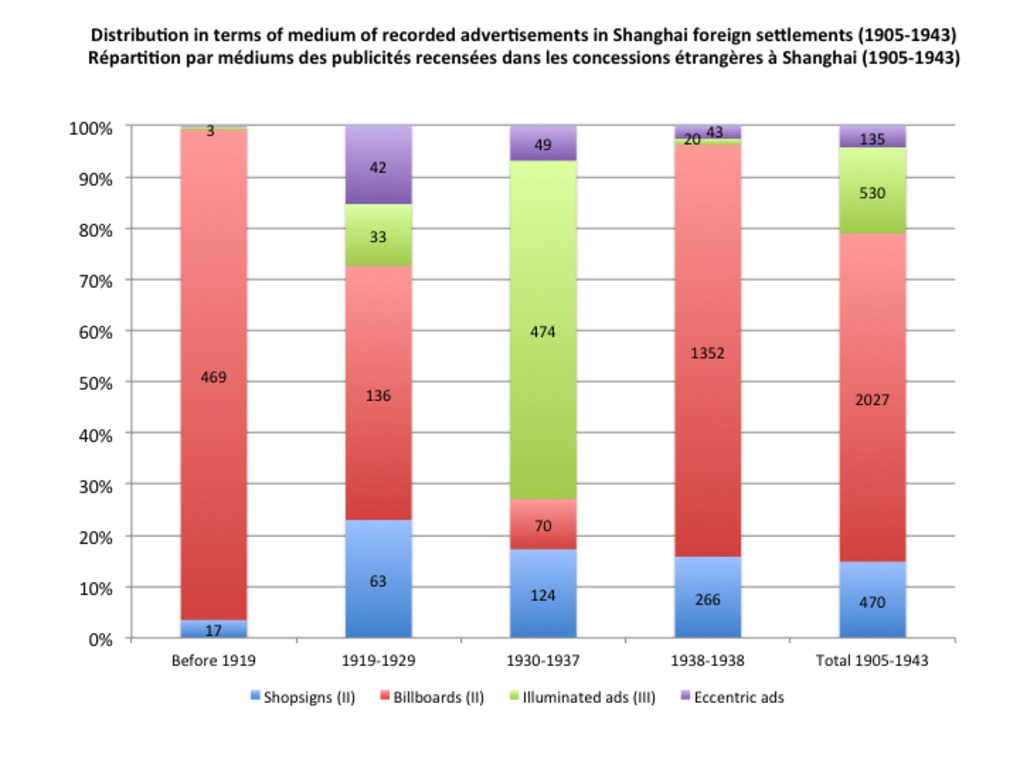 | 226 | Distribution in terms of medium of recorded advertisements in Shanghai foreign settlements (1905-1943) | This set of five bart charts shows the distribution of recorded advertisements in Shanghai settlements between 1905 and 1943, in terms of mediums, based on a simplified version of the typology established in the associated table (shopsigns/signboards, billboards, illuminated and other "eccentric" structures) (see the "Tables" section). |
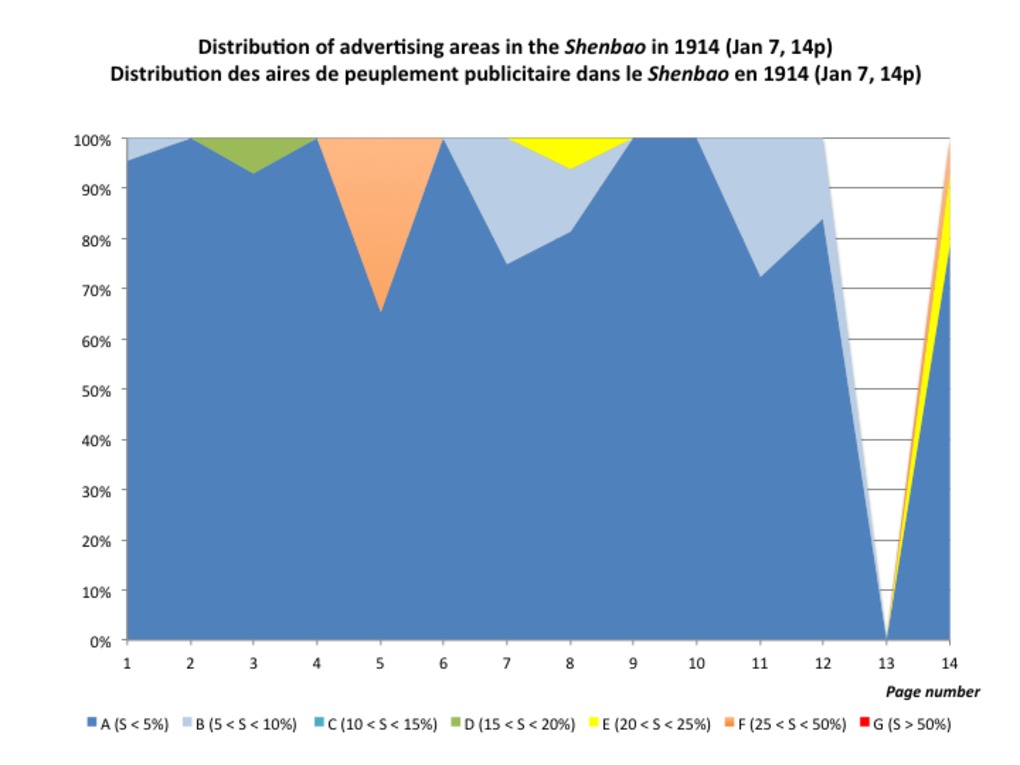 | 229 | Distribution of advertising areas in the Chinese newspaper Shenbao (1914-1949) | This set of five areal curves aims to trace the distribution of advertising areas in each sample issue of the newspaper Shenbao. The letters and colors refer to the following gradual scale of areas:
The measurements were made after our usual five samples of the Shenbao (January 7, 1914; January 3, 1924; January 5, 1934; February 1, 1941; January 1, 1949). Each curve reveals the uneven distribution of areas between pages. By juxtaposing the five curves, one can trace the changes in this demographic distribution. |
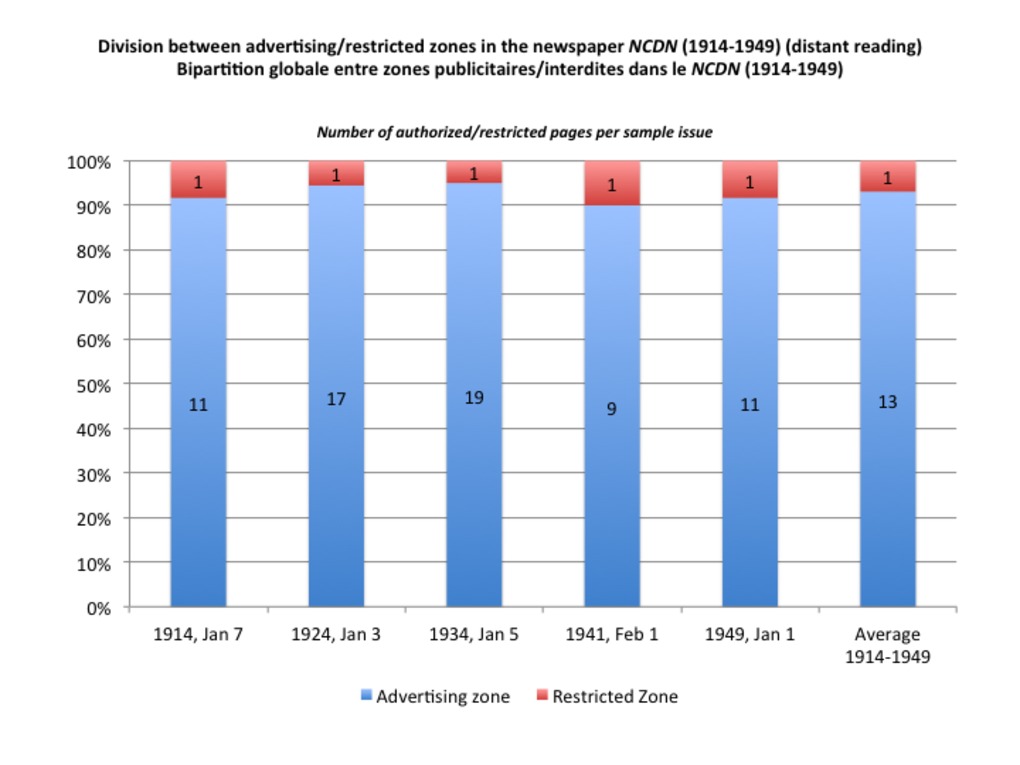 | 241 | Division between advertising space/non commercial space (restricted zone) in the British newspaper North China Daily News between 1914 and 1949 (distant reading) | Ces histogrammes mesurent à distance ou "à vue de nez" (en nombre de pages) la répartition de l'espace du journal entre espace publicitaire/zone autorisée (en bleu) et contenus non commerciaux/zone interdite de publicité (en rouge). Par souci de cohérence, on s'est appuyé sur les cinq mêmes échantillons que pour le Shenbao : 7 janvier 1914, 3 janvier 1924, 5 janvier 1934, 1er février 1941, 1er janvier 1949. Dans un premier temps, on s'est contenté de recenser et départager les pages qui étaient occupées par des publicités (pages autorisées) de celles qui en étaient dépourvues (zones interdites). Cette approche sera affinée par des mesures rigoureuses de la surface effectivement occupée par chaque type de zone. Rough English translation These bar charts offer a distant measuring (by counting the number of pages) of the division between advertising space (blue)/non commercial space (red) in the Shanghai-based British newspaper North China Daily News between 1914 and 1949. For consistency reasons, the measurements were made after the same five samples as used for the Chinese newspaper Shenbao: January 7, 1914; January 3, 1924; January 5, 1934; February 1, 1941; January 1, 1949. In this preliminary approach, the method simply consists in counting the numbers of pages occupied by advertisements (authorized pages/zones), and separating them from the pages strictly deprived from advertisements (restricted zones/pages). This "distant approach" will be refined by a close and precise measuring of the surfaces actually occupied by each type of zone.
|
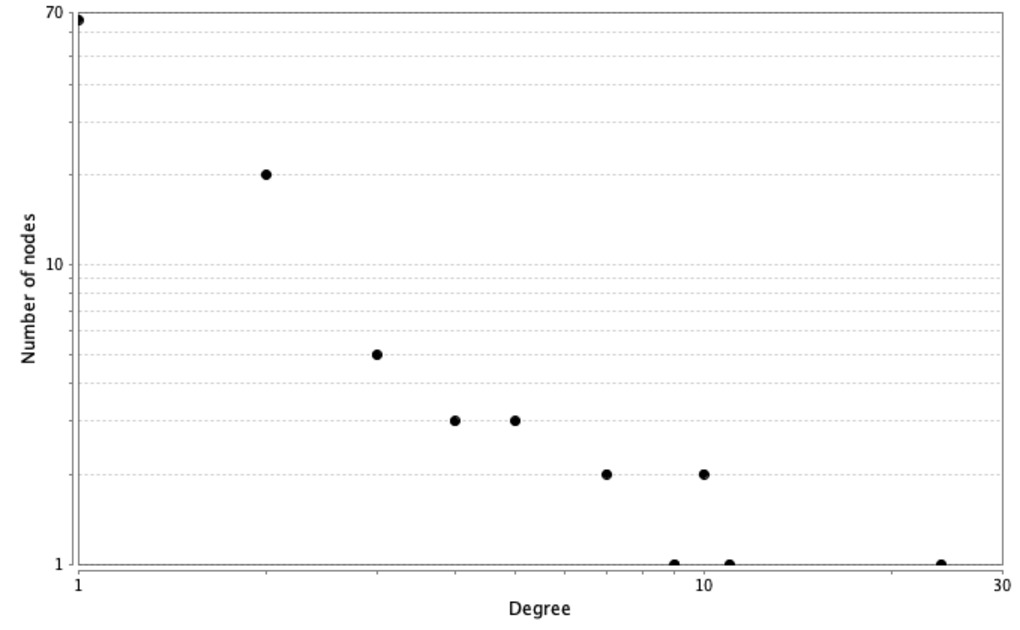 | 335 | Degree distribution in two-mode networks of meeting attendance at the Shanghai Rotary Club | This sets of three graphs compare degree distribution in the three two-mode networks of meeting attendance at the Shanghai Rotary Club under President Petit's (1919-20), Fitch's (1930-1) and Harkson's (1938-9) terms. The original datasets and the resulting graphs are available in the "Tables" and "Trees" section, respectively. NB We used Cytoscape Network Analyzer application to make these graphs. |
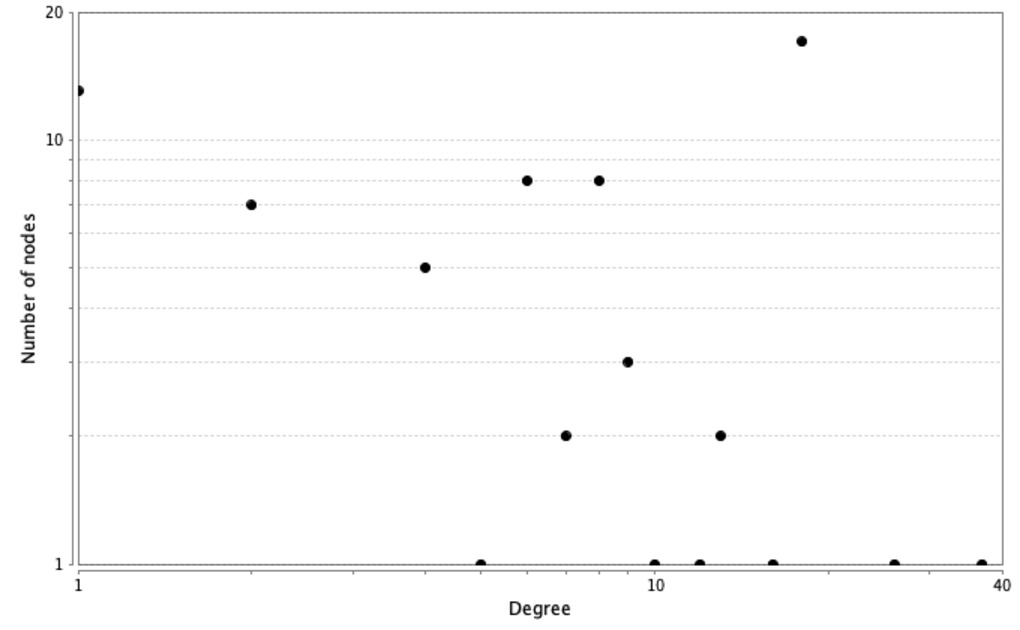 | 336 | Degree distribution in one-mode networks of co-attendance at meetings of the Shanghai Rotary Club | This sets of three graphs compare degree distribution in the three one-mode networks of co-attendance at the meetings of the Shanghai Rotary Club under President Petit's (1919-20), Fitch's (1930-1) and Harkson's (1938-9) terms. The original datasets and the resulting graphs are available in the "Tables" and "Trees" section, respectively. NB We used Cytoscape Network Analyzer application to make these graphs. |
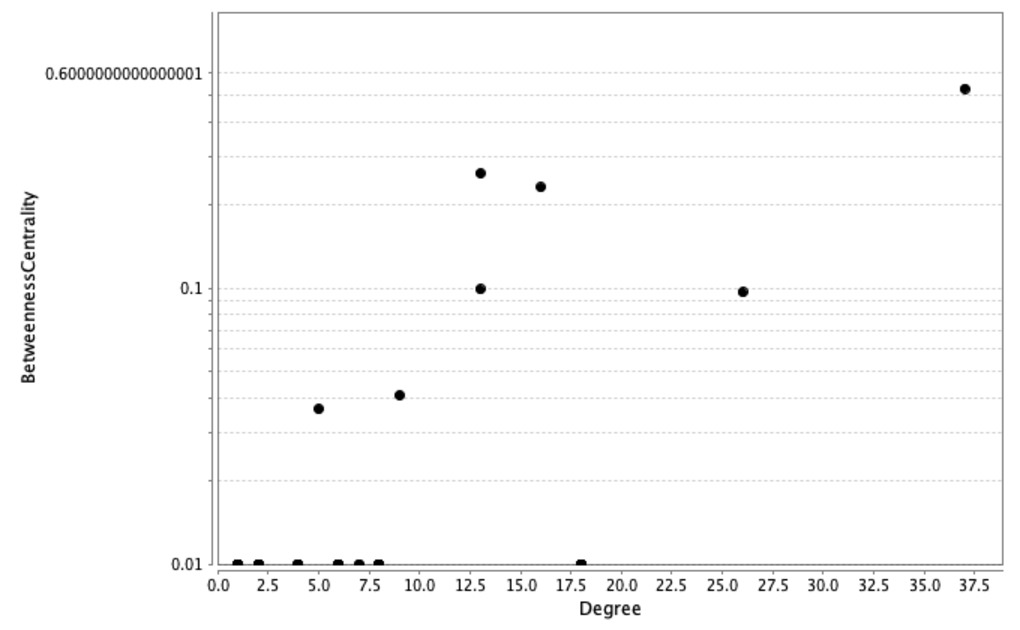 | 337 | Degree and between centrality in one-mode networks of co-attendance at meetings of the Shanghai Rotary Club | This sets of three graphs cross-analyzes degree and betweenness centrality in the three one-mode networks of co-attendance at the meetings of the Shanghai Rotary Club under President Petit's (1919-20), Fitch's (1930-1) and Harkson's (1938-9) terms. The original datasets and the resulting graphs are available in the "Tables" and "Trees" section, respectively. We used Cytoscape Network Analyzer application to make these graphs. In Petit’s network, we observe a direct correlation between degree and betweenness. Those who have the highest number of neighbors also serve as brokers, except for the medium group of non-members with a degree of 18 who show a very low betweenness centrality. On the opposite, two Rotarians (one director and one charter member) who are not particularly influential (degree 12 and 16 respectively) show an exceptionally high betweenness centrality (0.67 and O.4, respectively). In Fitch’s network, there is no obvious correlation between degree and betweenness. Except for the president himself, who shows the highest betweenness centrality of 0.8, acting as the main hub in the network, no other person serves as broker in this network. This confirms the high centralization of Rotary network around its president Fitch during his term. Under Harkson’s presidency, we again observe a strong (yet not perfect) correlation between degree and betweenness. Four persons act as intermediaries in this network, showing both a high degree centrality and high betweenness (including the vice-president Wolfe and the president Harkson). There are two minor exceptions to this general rule, however. The president ranked second in terms of intermediarity, but came only third in degree centrality. One ordinary Chinese member shows a moderate degree of 8 but a fairly high betweenness of 0.29 (which contrasts to the null betweenness of other persons in the same class). For a detailed list of personal profiles in each category, please refer to the "tables" section.
|


- RAW DATA
- COOKED DATA
- NARRATIVES
- REFERENCES
- DATABASES
11 documents
return to data set
Contact us
Cécile Armand Institut d'Asie Orientale ENS de Lyon, Site Descartes 15 Parvis René Descartes 69341 Lyon Cedex 07 France Email: cecile.armand@gmail.com
Around the Web
![]()
![]()
![]()