


| ID | Title | Description | |
|---|---|---|---|
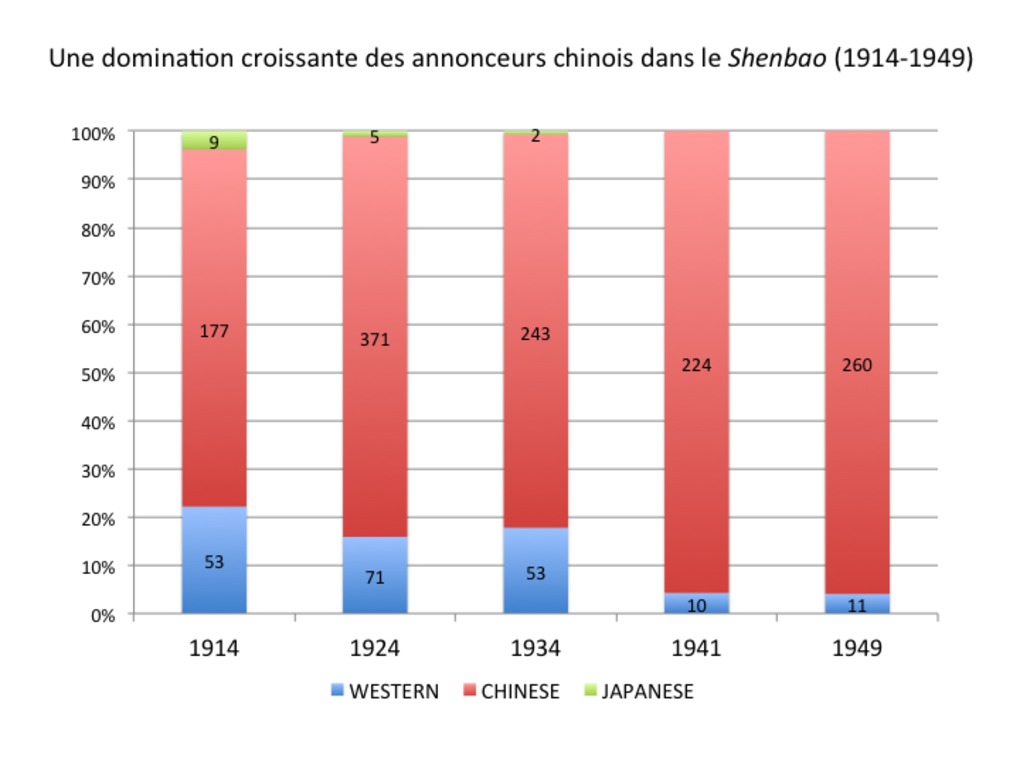 | 105 | Chinese and foreign advertisers in the Chinese newspaper Shenbao (1914-1949) | Répartition entre annonceurs chinois et étrangers dans le quotidien chinois Shenbao (1914-1949) Ces cinq histogrammes permettent de mesurer la répartition entre annonceurs chinois (en rouge) et étrangers (bleu) dans le Shenbao sur la période 1914-1949. Chaque histogramme a été réalisé à partir d'un échantillon restreint à un numéro (7 janvier 1914, 3 janvier 1924, 5 janvier 1934, 1er février 1941, 1er janvier 1949). Si les Chinois sont déjà en position de supériorité en 1914, ils ne cessent de progresser entre 1914 et 1949. Cette première évaluation duale et quelque peu "grossière" de l'origine des anonceurs sera affinée par la suite : les graphiques associés ("related data") mesurent la répartition au sein de la population d'annonceurs étrangers, d'une part ; et chinoise (différentes provinces ou localités en Chine), d'autre part. Pour les groupes culturels les plus représentatifs, on s'efforce également d'identifier leurs éventuelles "spécialisations" productives. Proportion of Chinese and foreign advertisers in the Chinese newspaper Shenbao (1914-1949) This set of five bar charts aims to measure the proportion of either Chinese (red) or foreign (blue) advertisers in the Chinese newspaper Shenbao between 1914-1949. The measurements were made after our five samples (Jan 7, 1914; Jan 3, 1924; Jan 5, 1934; Feb 1, 1941; Jan 1, 1949). Chinese advertisers are obviously overwhelming the pages of the Chinese newspaper as early as 1914, and they kept on growing during the whole period, especially in the 1930s. This first dual and somewhat "coarse" appreciation of the advertisers' origins need to be refined in a second place: the related graphs (see "related data") aim to measure the distribution of ads between various foreign nationalities (British, American, French, German, Japanese) and between Chinese advertisers (from various provinces or localities in China). For the most prominent cultural groups, we have strived to identify their potential business "specialization". |
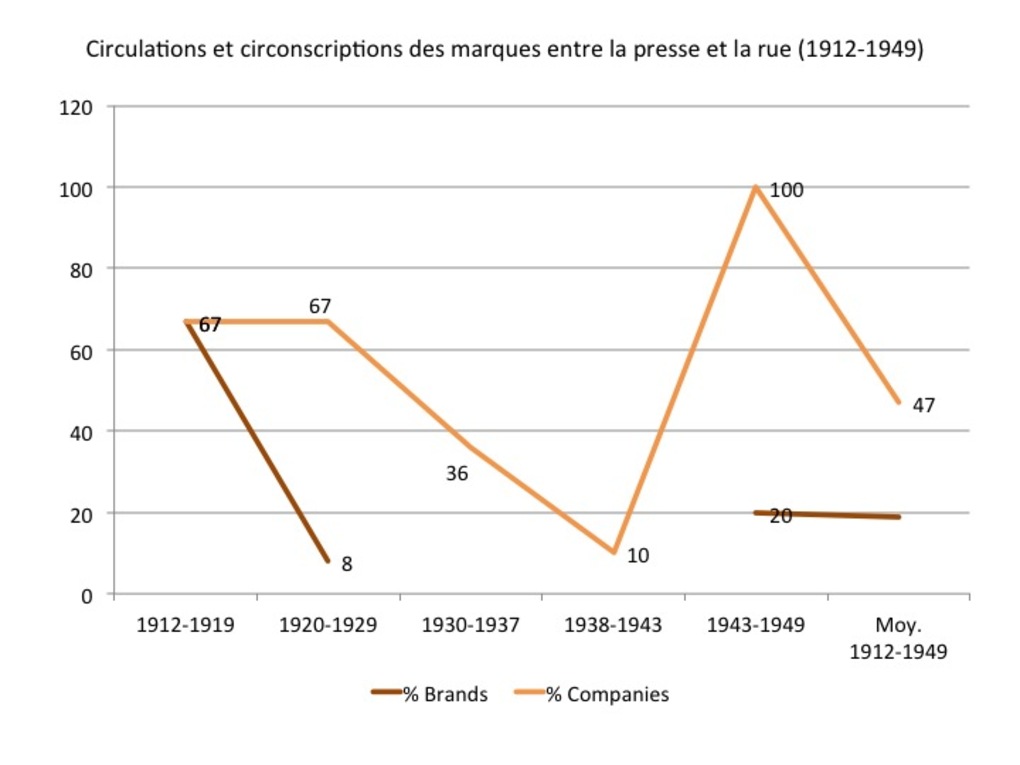 | 182 | Circulations et circonscriptions des marques de cigarettes entre la presse et la rue (1912-1949) | Ces deux courbes visualisent les circulations des marques et des compagnies de cigarettes entre le Shenbao et les rues de Shanghai : la courbe la plus foncée indique le pourcentage de marques communes aux deux espaces, la plus claire le pourcentage de compagnies partagées. Les années 1920-1929 et 1943-1949 sont les périodes de circualtions maximales, mais il est difficile de se fier à ses chiffres en raison des lacunes de la documentation (surtout dans la rue et à partir d'échantillons aussi restreints dans la presse). |
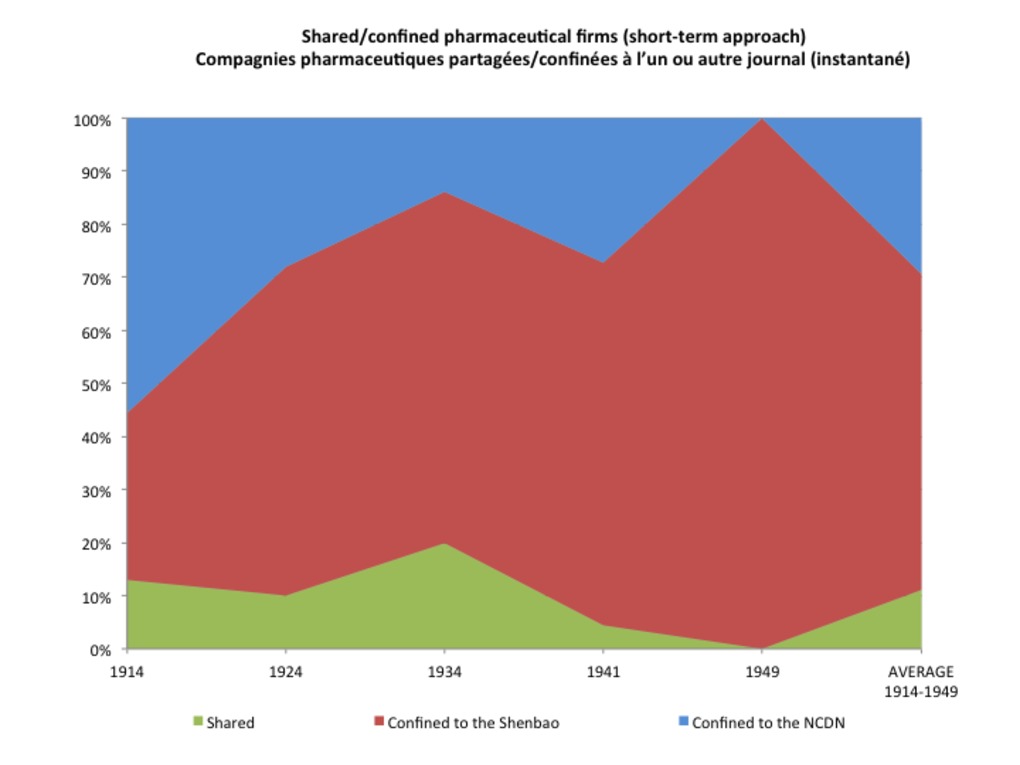 | 253 | Circulations of pharmaceutical brands and firms between the Chinese and British newspapers Shenbao and North China Daily News (1914-1949) | This set of four graphs aims to measure the proportion of pharmaceutical brands and firms, either shared or confined to the Chinese newspaper Shenbao and the Biritish North China Daily News, between 1914-1949. Shared brands or firms are materialized in green, the brands/firms confined to the Shenbao in red, and those confined to the North China Daily News in blue. In order to compensate the restriction of our sampling method, and to take possible time gaps into account, we have measured both short-term/simultaneous circulations (that is, shared brands/firms advertised in a restricted sample, at a given point in time) (first set of graphs) and long-term circulations (shared brands/firms in an enlarged sample, covering the entire period 1914-1949) (second set of graph lines). The measurements were made after extended (weekly) samples of both newspapers (Jan 7-14 1914, Jan 1-8 1924, Jan 1-10 1934, Feb 1-8 1941, Jan 1-8 1949). The related brandstrees have proved powerful tools to fill in this table (see the "Trees" section). This table was then use to build the related graphs (see the "Graphs" section) measuring the number of brands/firms either shared between the Shenbao and North China Daily News, or confined to one or the other newspaper. It was also used to draw the related intertwined circles (see the "Drawings" section). |
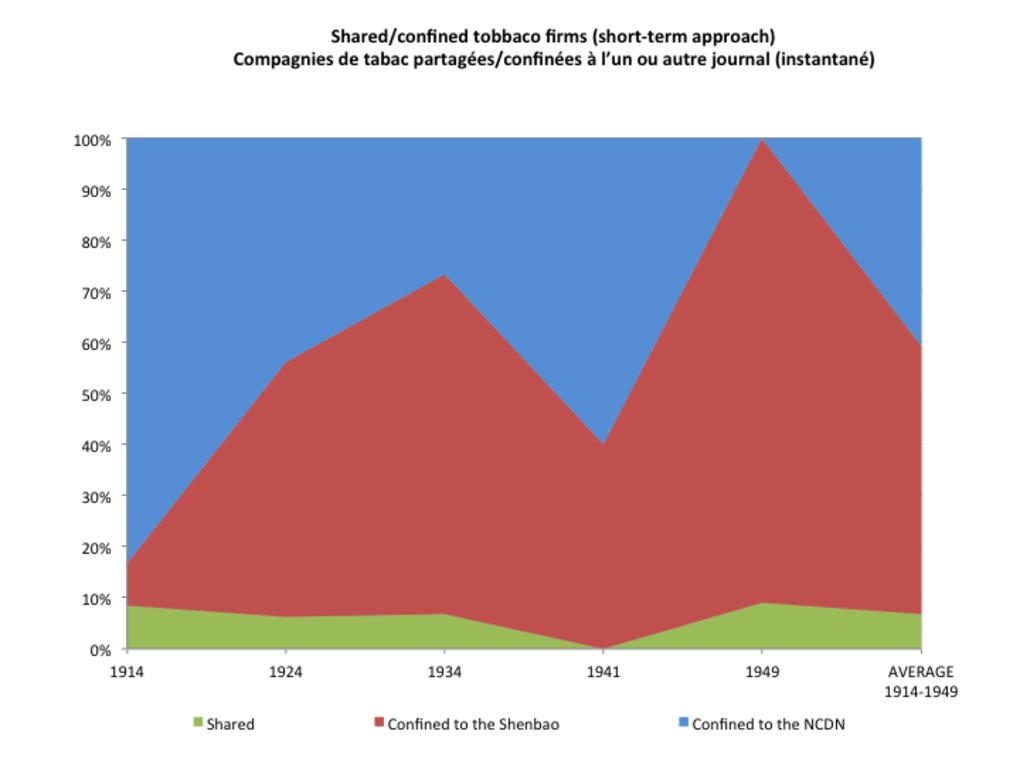 | 254 | Circulations of cigarette brands and firms between the Chinese and British newspapers Shenbao and North China Daily News (1914-1949) | This set of four graphs aims to measure the proportion of cigarette/tobacco brands and firms, either shared or confined to the Chinese newspaper Shenbao and the Biritish North China Daily News, between 1914-1949. In order to compensate the restriction of our sampling method, and to take possible time gaps into account, we have measured both short-term/simultaneous circulations (that is, shared brands/firms advertised in a restricted sample, at a given point in time) (first set of graphs) and long-term circulations (shared brands/firms in an enlarged sample, covering the entire period 1914-1949) (second set of graph lines). The measurements were made after extended (weekly) samples of both newspapers (Jan 7-14 1914, Jan 1-8 1924, Jan 1-10 1934, Feb 1-8 1941, Jan 1-8 1949). The related brandstrees have proved powerful tools to fill in this table (see the "Trees" section). This table was then use to build the related graphs (see the "Graphs" section) measuring the number of brands/firms either shared between the Shenbao and North China Daily News, or confined to one or the other newspaper. It was also used to draw the related intertwined circles (see the "Drawings" section). |
 | 256 | Creativity profiles in Shenbao advertisements (1914) | This graph aims to correlate the number of occurrences (blue line) to the number of variants (red line) in a given series of advertisements extracted from the Chinese newspaper Shenbao in 1914.The measurements have been made after an extended weekly sample of this newspaper (Jan 7-15, 1914). This graph reveals three creativity profiles: the medical brand Scott's Emulsion embodied the maximal creativity (8 variants/8 occurences), while the cigarette brand Three Castles offered the minimal creativity (1 variant/8 occurrences) and Doan Backache & Kidney Pills displayed a medium creativity (1 variant (1 variant/3 occurrences). |
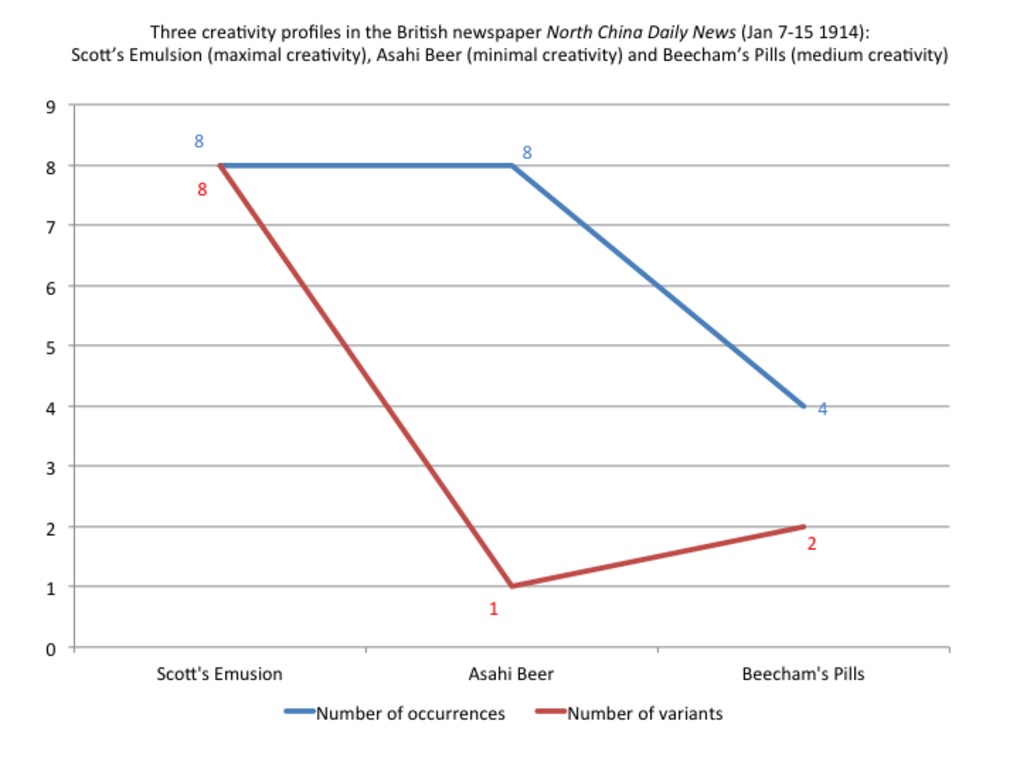 | 257 | Creativity profiles in North China Daily News advertisements (1914) | This graph aims to correlate the number of occurrences (blue line) to the number of variants (red line) in a given series of advertisements extracted from the Shanghai-based British newspaper North China Daily News in 1914. For consistency reasons, the measurements have been made after the same extended weekly sample as that used for the Chinese newspaper Shenbao (Jan 7-15, 1914). This graph reveals three creativity profiles. As in in the Chinese newspaper Shenbao, the medical brand Scott's Emulsion embodied the maximal creativity (8 variants/8 occurences), while the Japanese beer brand Asashi offered the minimal creativity (1 variant/8 occurrences) and Beecham's Pills displayed a medium creativity (1 variant (1 variant/3 occurrences). |
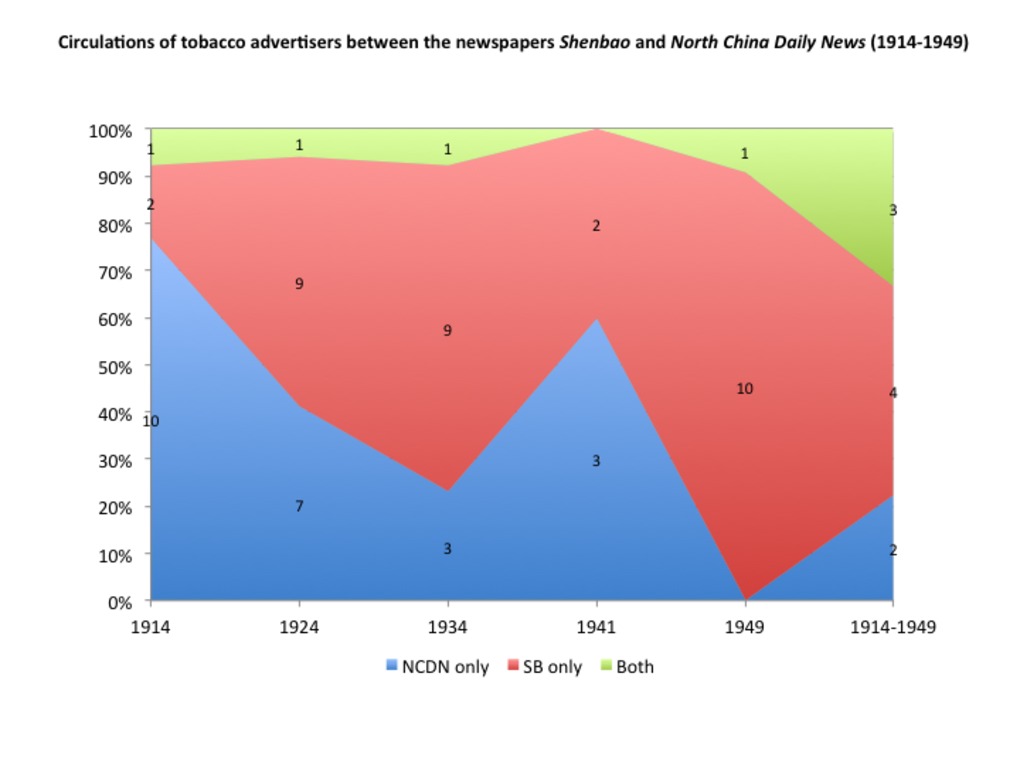 | 294 | Circulations of tobacco advertisers between the newspapers Shenbao and North China Daily News (1914-1949) | Ce graphique a été réalisé à partir de la table associée : http://madspace.org/cooked/Tables?ID=157 |
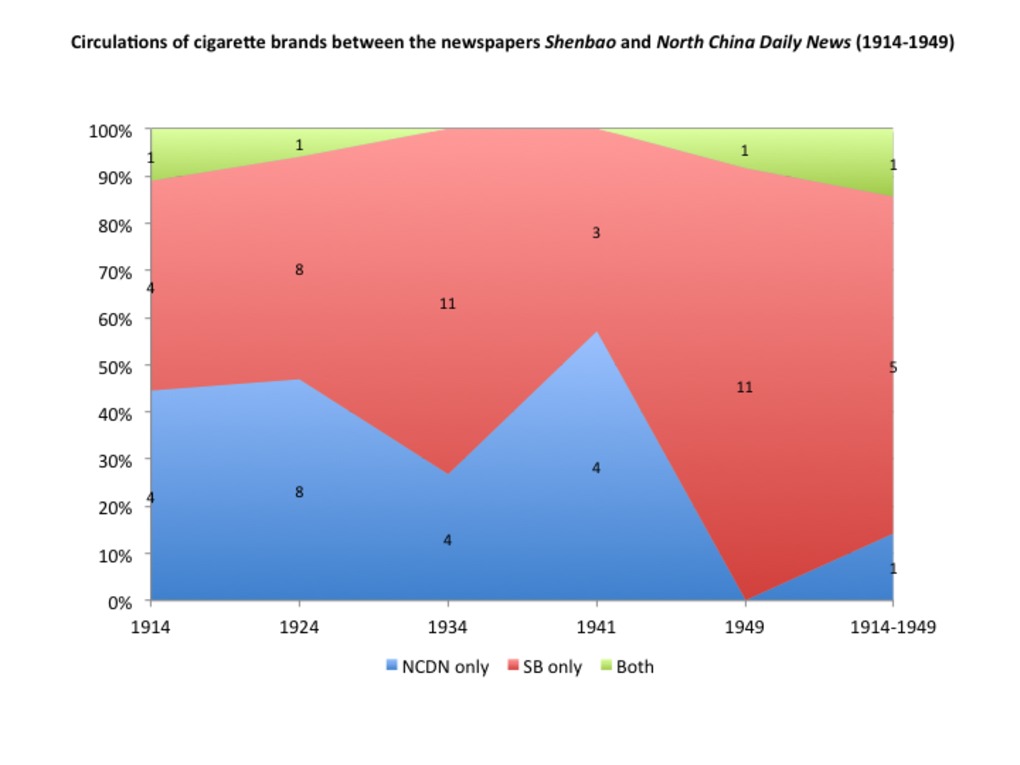 | 295 | Circulations of cigarette brands between the newspapers Shenbao and North China Daily News (1914-1949) | Ce graphique a été réalisé à partir de la table associée : http://madspace.org/cooked/Tables?ID=157 |
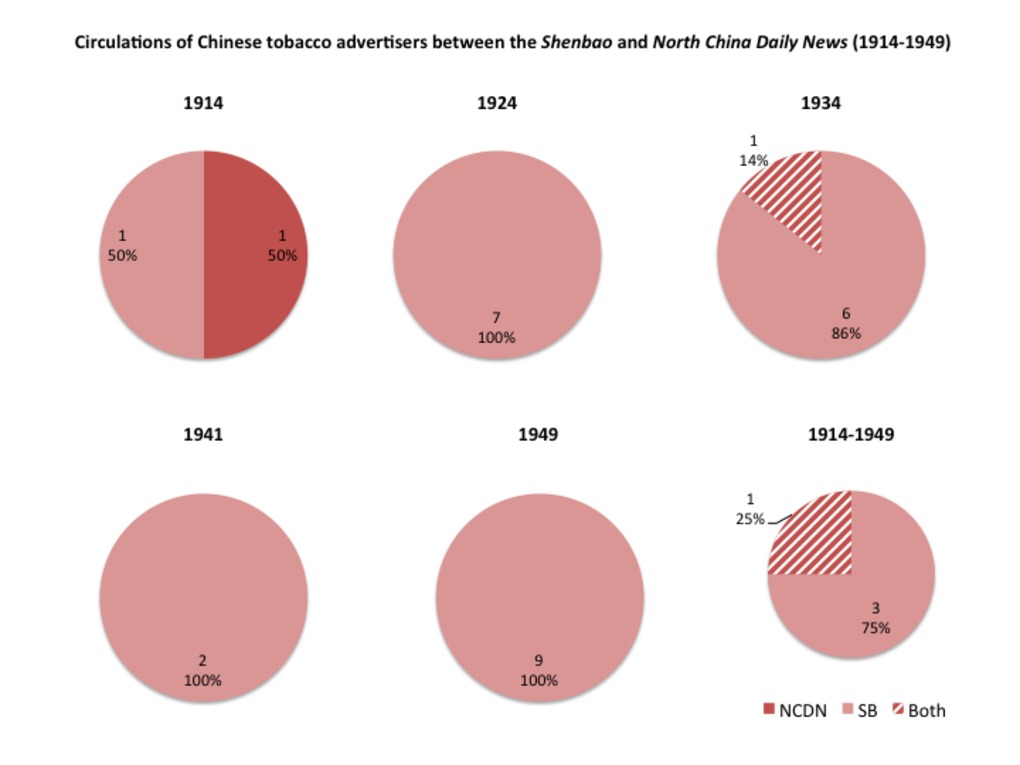 | 296 | Circulations of tobacco advertisers within the Shanghai press, according to their nationalities: Chinese and Western (1914-1949) | Ce graphique a été réalisé à partir de la table associée : http://madspace.org/cooked/Tables?ID=157 |
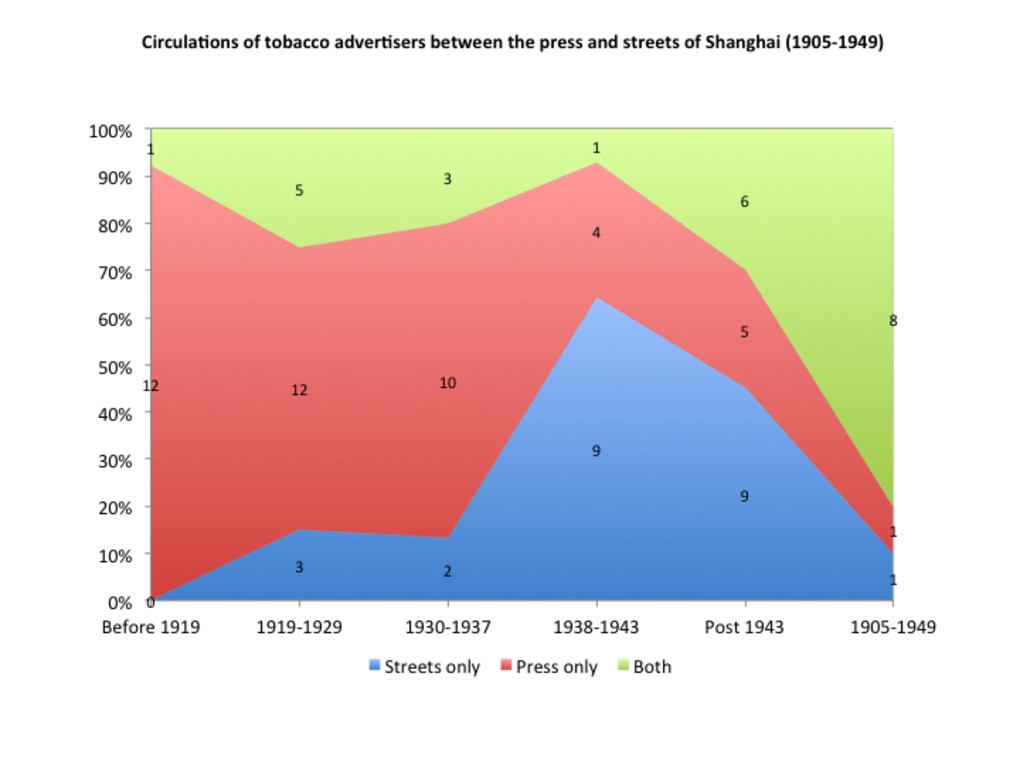 | 297 | Circulations of tobacco advertisers between the press and streets of Shanghai (1905-1949) | Ce graphique a été réalisé à partir de la table associée : http://madspace.org/cooked/Tables?ID=157 |
 | 298 | Circulations of cigarette brands between the press and streets of Shanghai (1905-1949) | Ce graphique a été réalisé à partir de la table associée : http://madspace.org/cooked/Tables?ID=157 |
 | 299 | Circulations of tobacco advertisers between the press and streets of Shanghai, according to their nationalities: Chinese and Western (1905-1949) | Ce graphique a été réalisé à partir de la table associée : http://madspace.org/cooked/Tables?ID=157 |
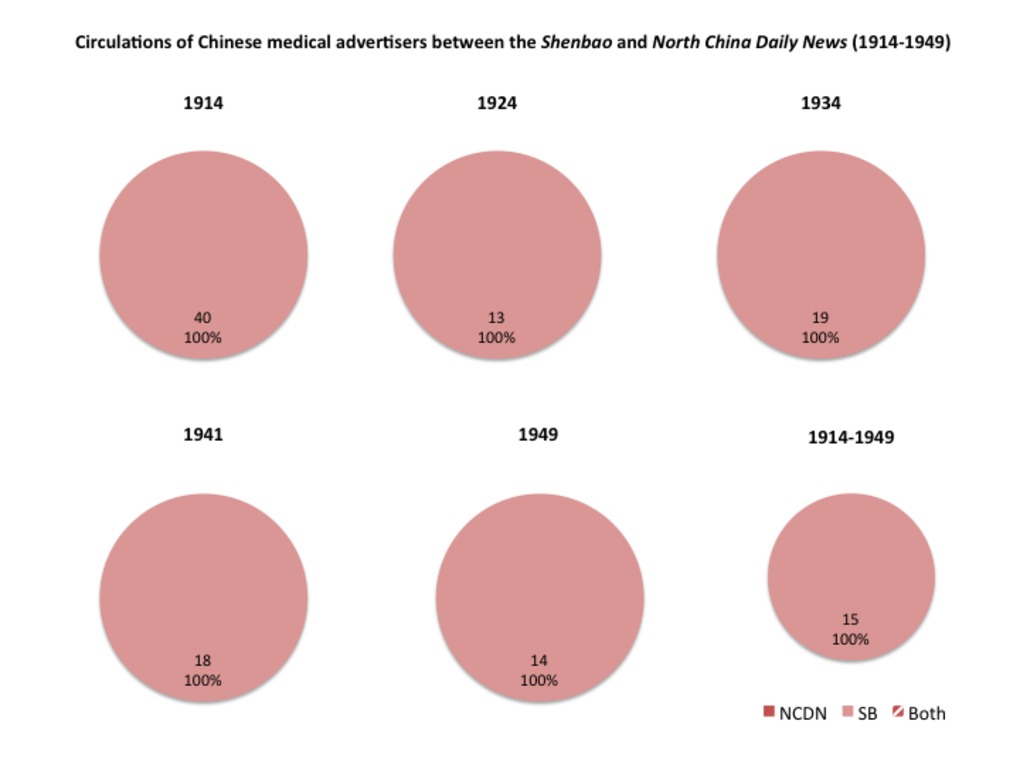
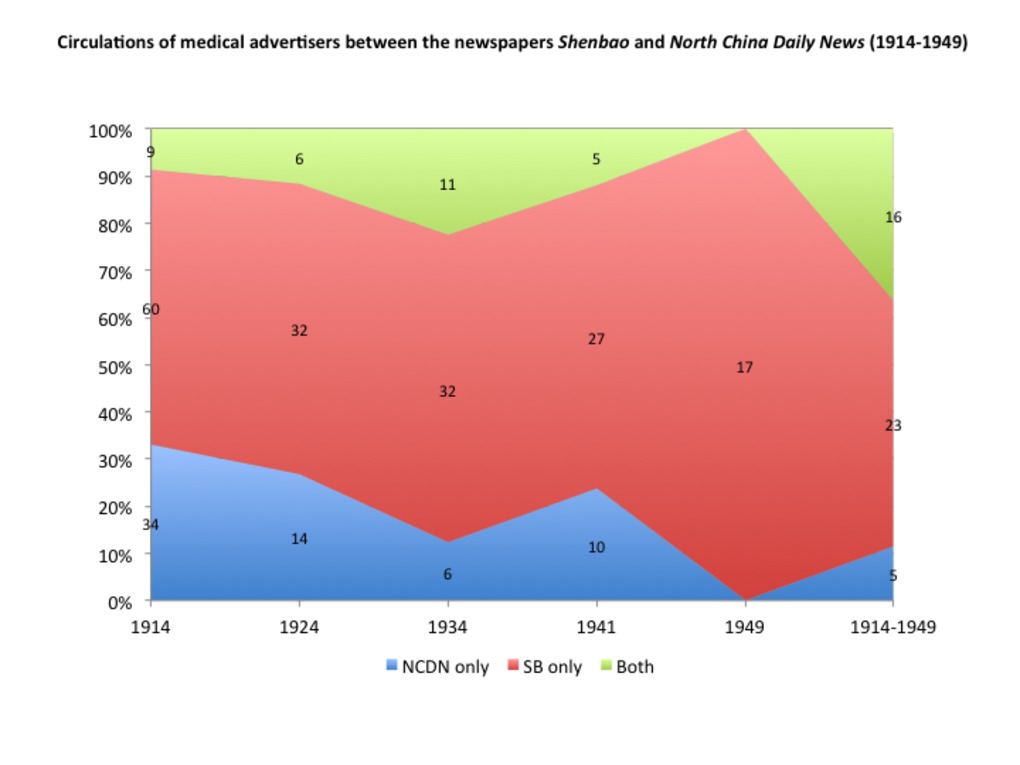 | 300 | Circulations of medical advertisers between the newspapers Shenbao and North China Daily News (1914-1949) | Ce graphique a été réalisé à partir de la table associée : http://madspace.org/cooked/Tables?ID=156 |
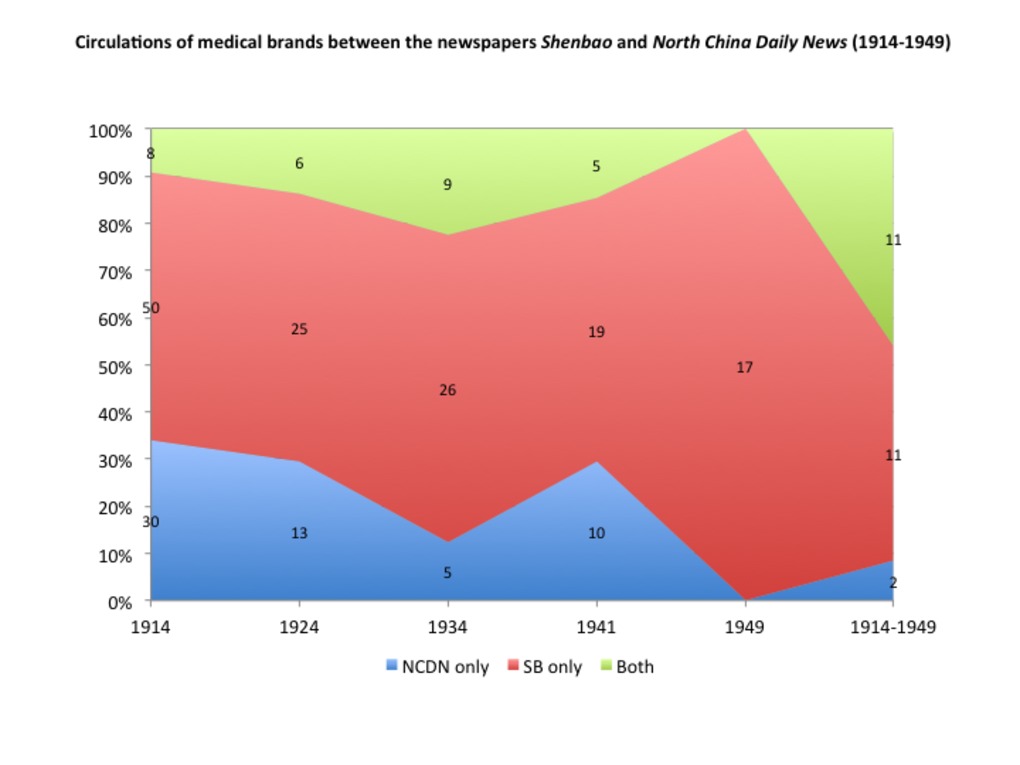 | 301 | Circulations of medical brands between the newspapers Shenbao and North China Daily News (1914-1949) | Ce graphique a été réalisé à partir de la table associée : http://madspace.org/cooked/Tables?ID=156 |
 | 302 | Circulations of medical advertisers within the Shanghai press, according to their nationalities: Chinese, Western, Japanese (1914-1949) | Ce graphique a été réalisé à partir de la table associée : http://madspace.org/cooked/Tables?ID=156 |
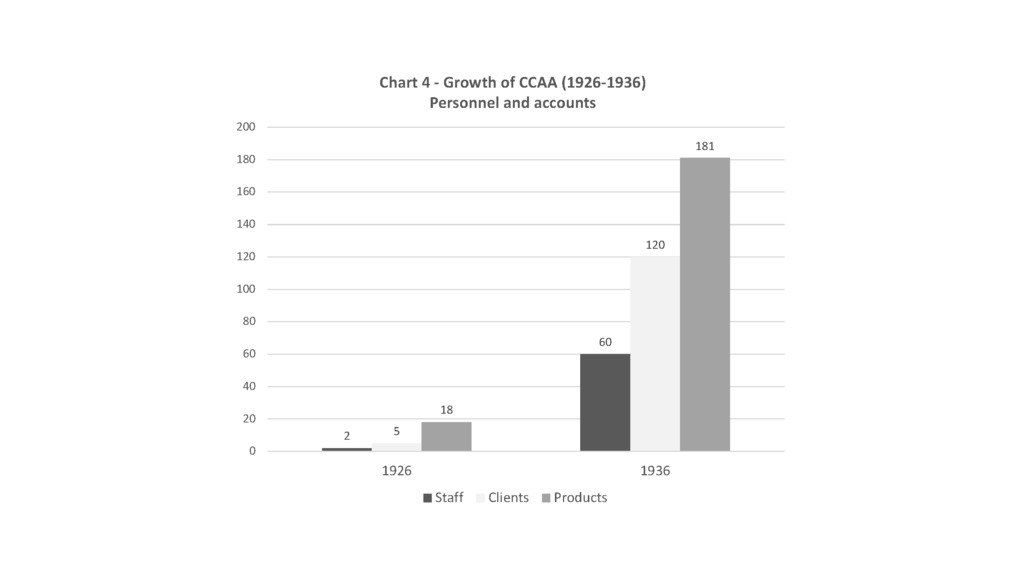 | 318 | China Commercial Advertising Agency’s staff and clients | Graph showing the number of employees and clients of one of the first and leading Chinese agencies - the China Commercial Advertising Agency (CCAA) - founded in Shanghai in 1926. The chart reveals CCAA's spectacular growth during the decade 1926-1936. |
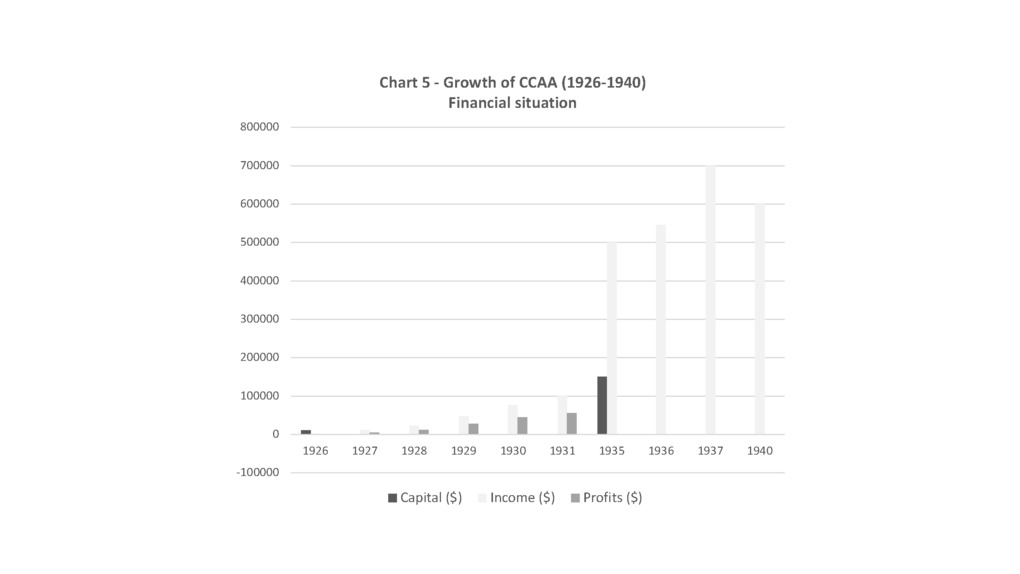 | 319 | China Commercial Advertising Agency’s financial situation | Graph showing the capital, income and profits of one of the first and leading Chinese agencies - the China Commercial Advertising Agency (CCAA) - founded in Shanghai in 1926. The chart reveals CCAA's spectacular growth between 1926 and 1940. Source: SMA, Q275-1-1840-37, Q275-1-1840-1. |
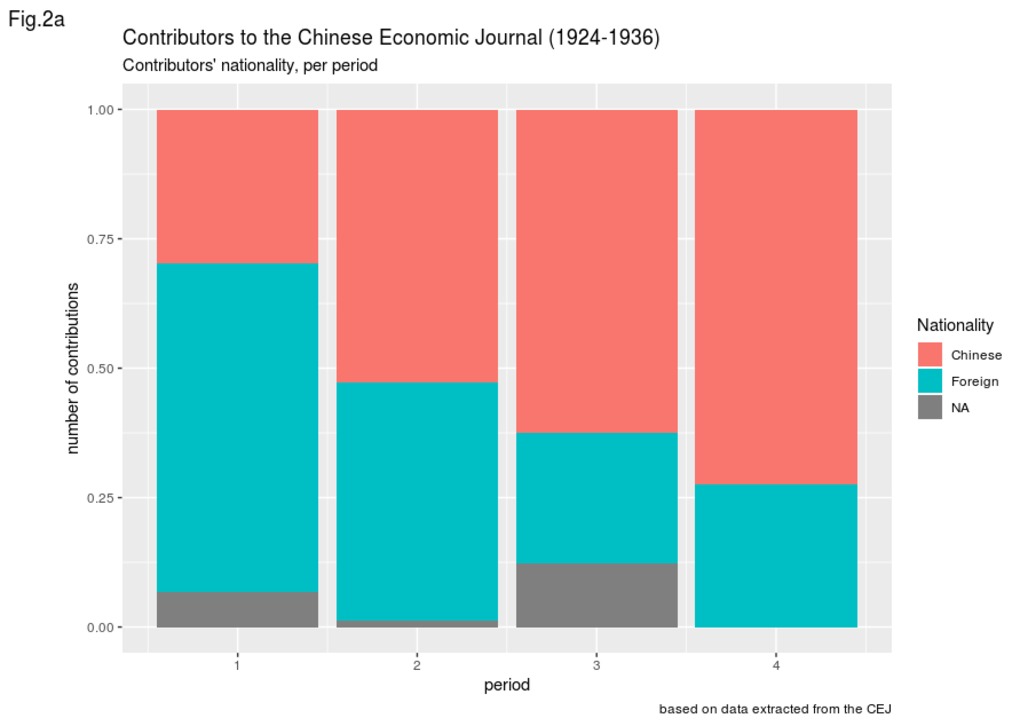 | 348 | Contributors to the Chinese Economic Journal, per period (origin) | Based on the following dataset, the attached graphs visualize the origin of contributors to the Chinese Economic Monthly/Journal between 1924 and 1936, per period. Relying on R package "ggplot2", we alternatively used faceted and stacked bar charts. What is striking on these graphs is the meteoritic rise of Chinese contributors from 1928 onwards. The next set of graphs will explore the contributors' nationality in greater details. |
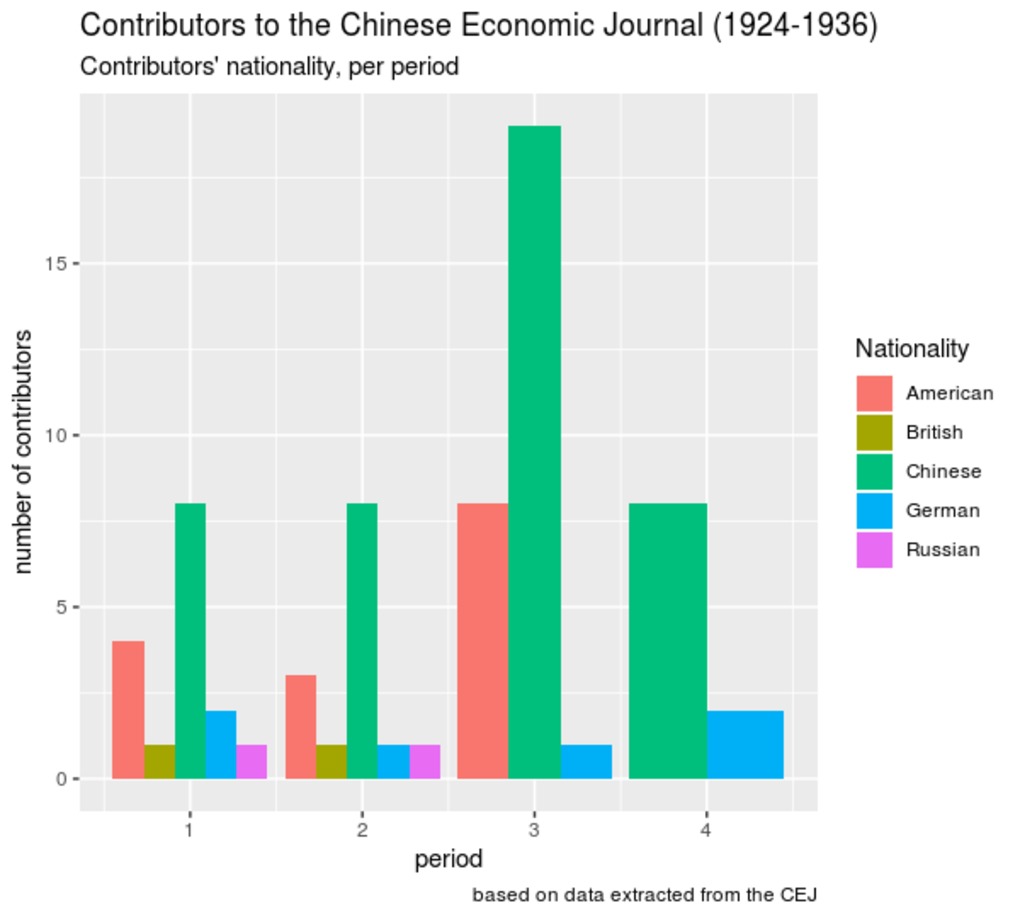 | 349 | Contributors to the Chinese Economic Journal, per period (nationality) | Based on the following dataset, the attached graphs visualize the nationality of contributors to the Chinese Economic Monthly/Journal between 1924 and 1936, all periods included (2) and per period (1, 3). Compared to the related graphs that merely discriminate between Chinese and foreign contributors, this set explores the distribution of national groups in greater details. Relying on R package "ggplot2", we alternatively used faceted and stacked bar charts. |
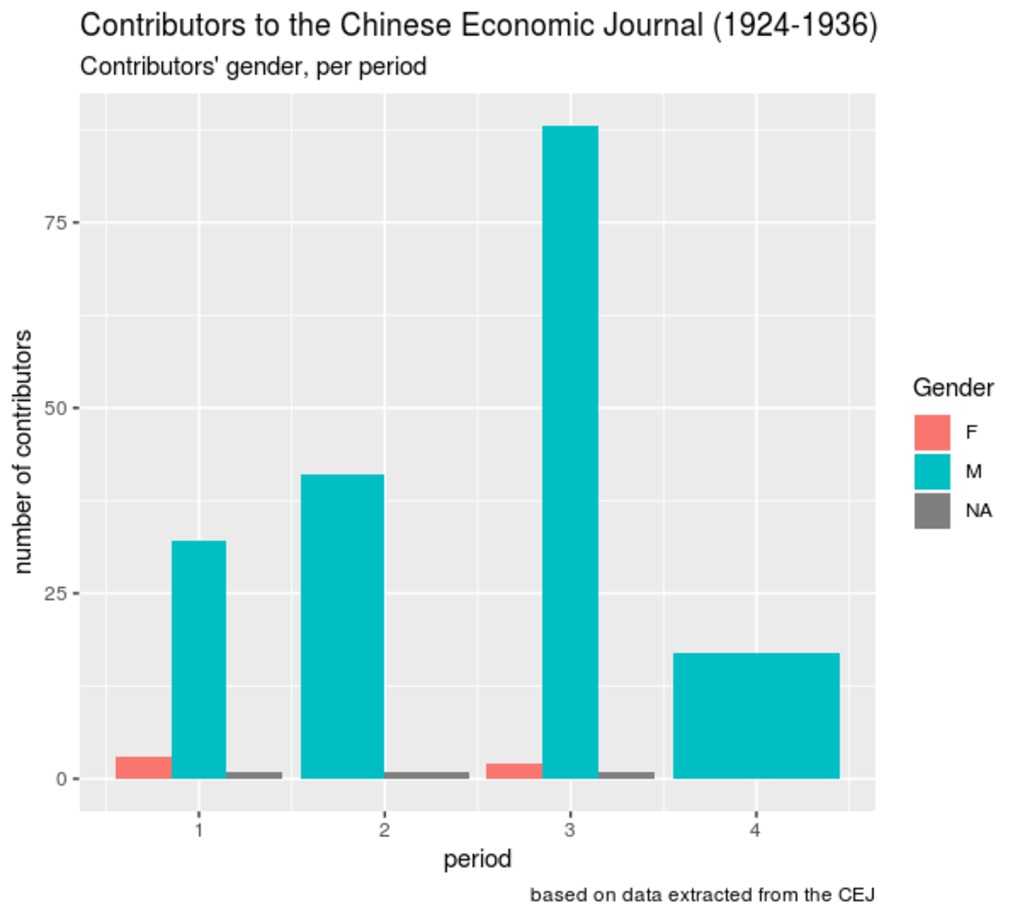 | 350 | Contributors to the Chinese Economic Journal, per period (gender) | Based on the following dataset, the attached graphs explore the gendered distribution of contributors to the Chinese Economic Monthly/Journal between 1924 and 1936, per period (1) and all periods included (2). We relied on R package "ggplot2" to build these bar charts. Unsurprisingly, male contributors dominated during the entire period. Woman made but a small contribution during the first and third periods. |
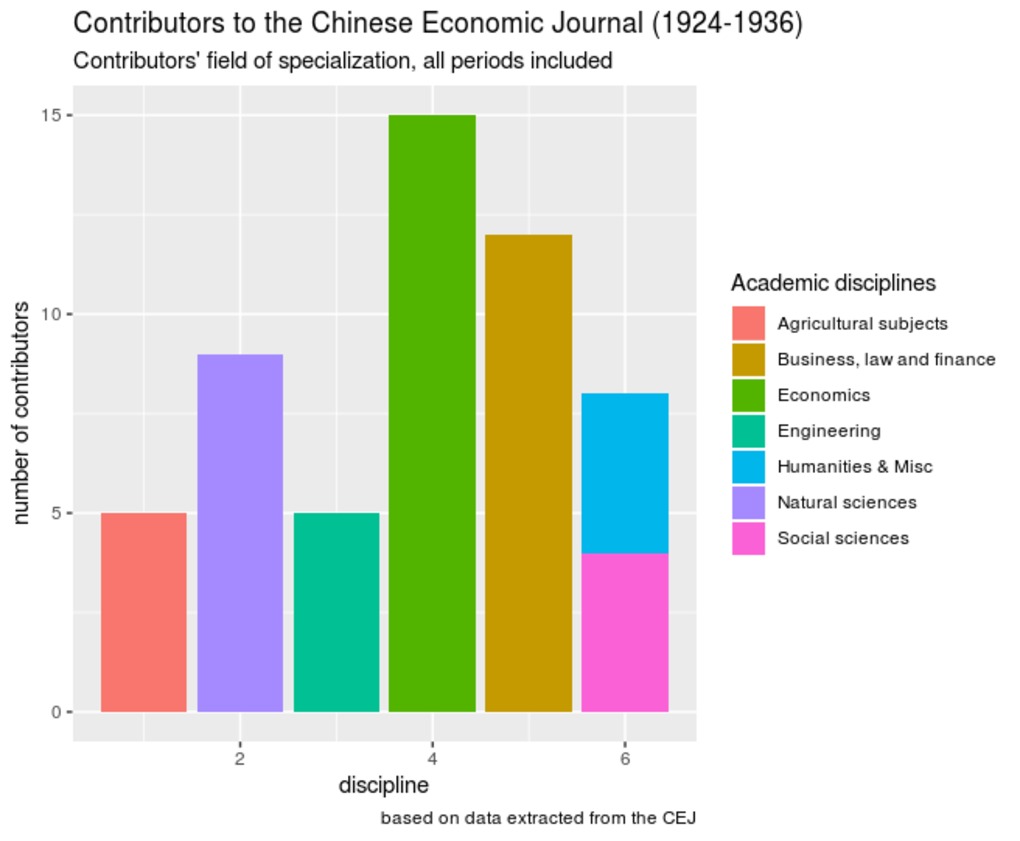 | 351 | Contributors to the Chinese Economic Journal, per period (field of specialization) | Based on the following dataset, the attached graphs explore contributors' fields of specialization (the academic disciplines in which they graduated) in the Chinese Economic Monthly/Journal between 1924 and 1936, all periods included (1), and per period (2, 3). Relying on R package "ggplot2", we alternatively used faceted and stacked bar charts. |
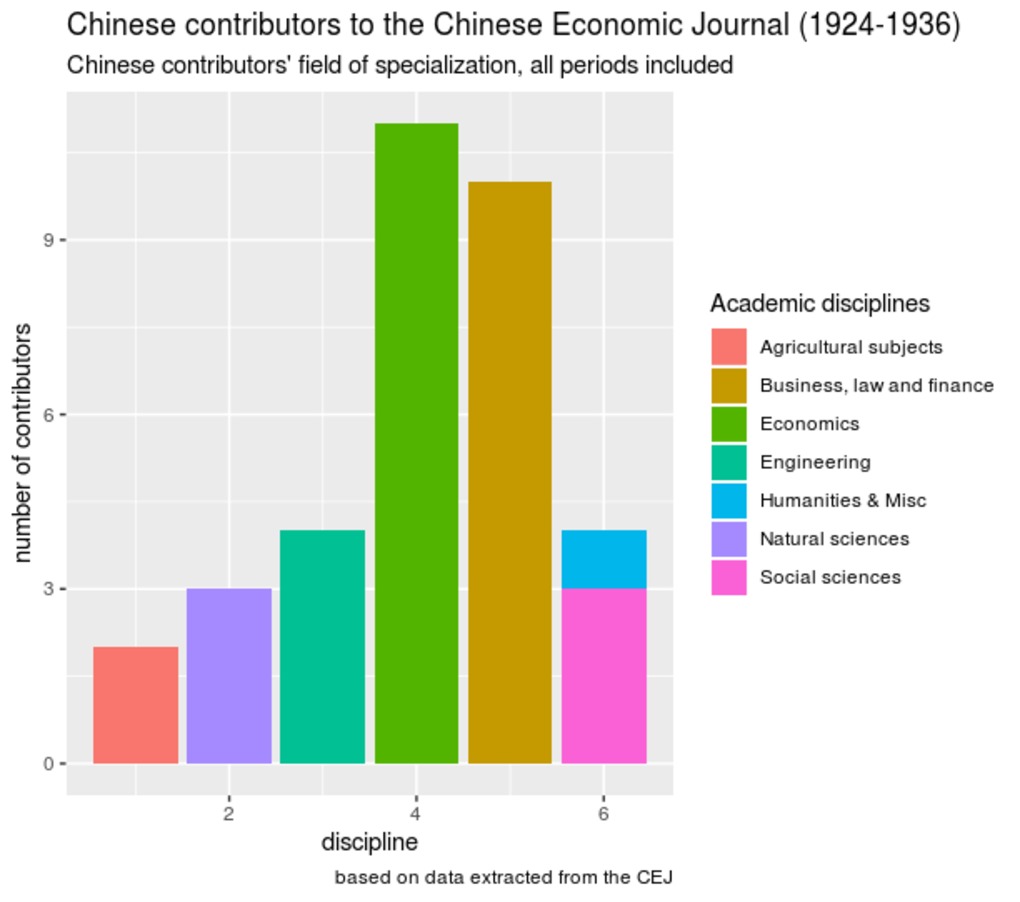 | 353 | Chinese contributors to the Chinese Economic Journal, per period (field of specialization) | Based on the following dataset, the attached graphs explore more specificially Chinese contributors' fields of specialization (the academic disciplines in which they graduated) in the Chinese Economic Monthly/Journal between 1924 and 1936, all periods included (1), and per period (2, 3, 4). Relying on R package "ggplot2", we alternatively used stacked, dodged and faceted bar charts. |
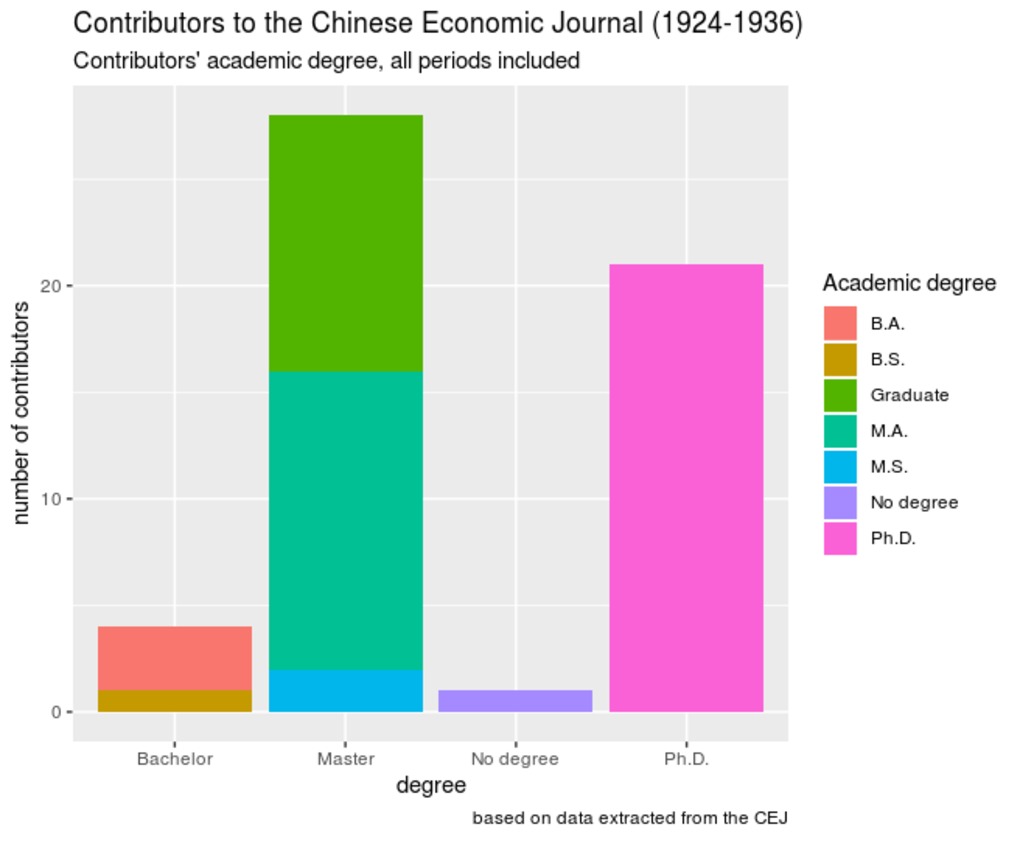 | 354 | Contributors to the Chinese Economic Journal, per period (level of education) | Based on the following dataset, the attached graphs explore contributors' level of education (the highest academic degrees obtained) in the Chinese Economic Monthly/Journal between 1924 and 1936, all periods included (1), and per period (2, 3, 4). Relying on R package "ggplot2", we alternatively used faceted, stacked and dodged bar charts. |
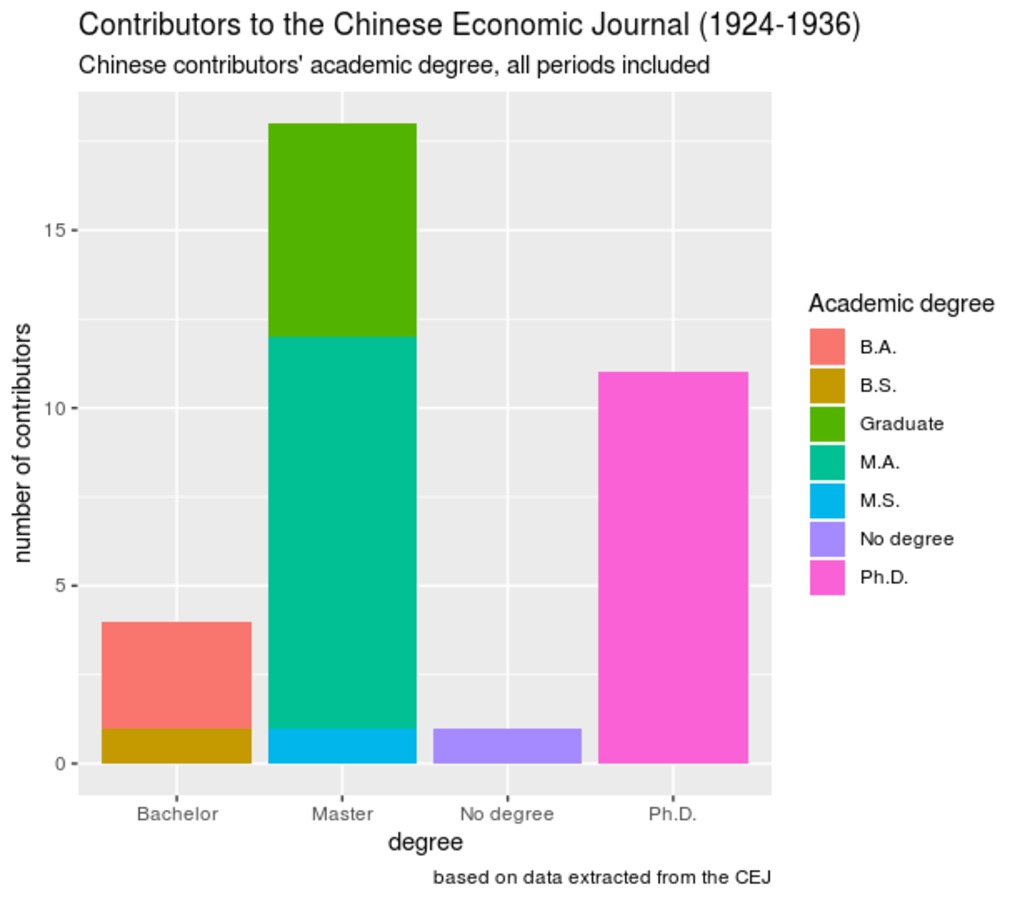 | 355 | Chinese contributors to the Chinese Economic Journal, per period (level of education) | Based on the following dataset, the attached graphs explore Chinese contributors' level of education (the highest academic degrees obtained) in the Chinese Economic Monthly/Journal between 1924 and 1936, all periods included (1), and per period (2, 3, 4). Relying on R package "ggplot2", we alternatively used stacked and dodged bar charts. |
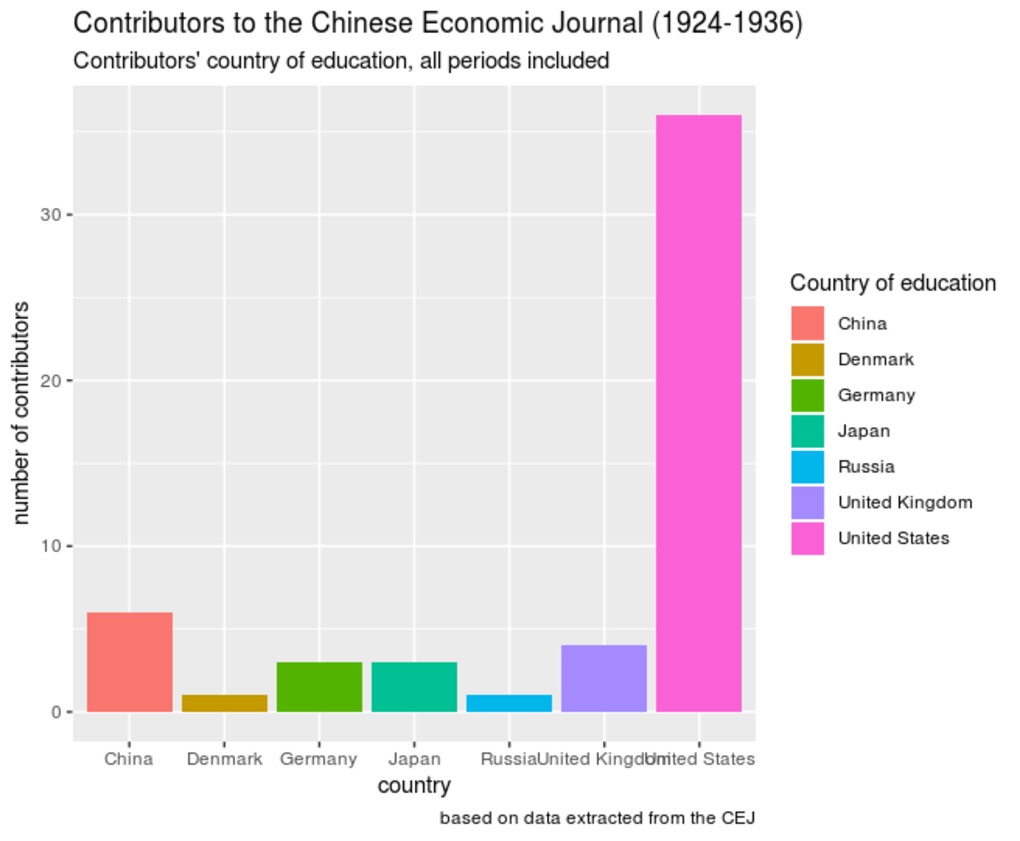 | 356 | Contributors to the Chinese Economic Journal, per period (country of education) | Based on the following dataset, the attached graphs explore contributors' country of education (in country in which they received their highest degree) in the Chinese Economic Monthly/Journal between 1924 and 1936, all periods included (1), and per period (2). We relied on R package "ggplot2" to build these bar charts. These graphs reveals the heavy weight of the United States as the privileged destination for pursuing higher education. |
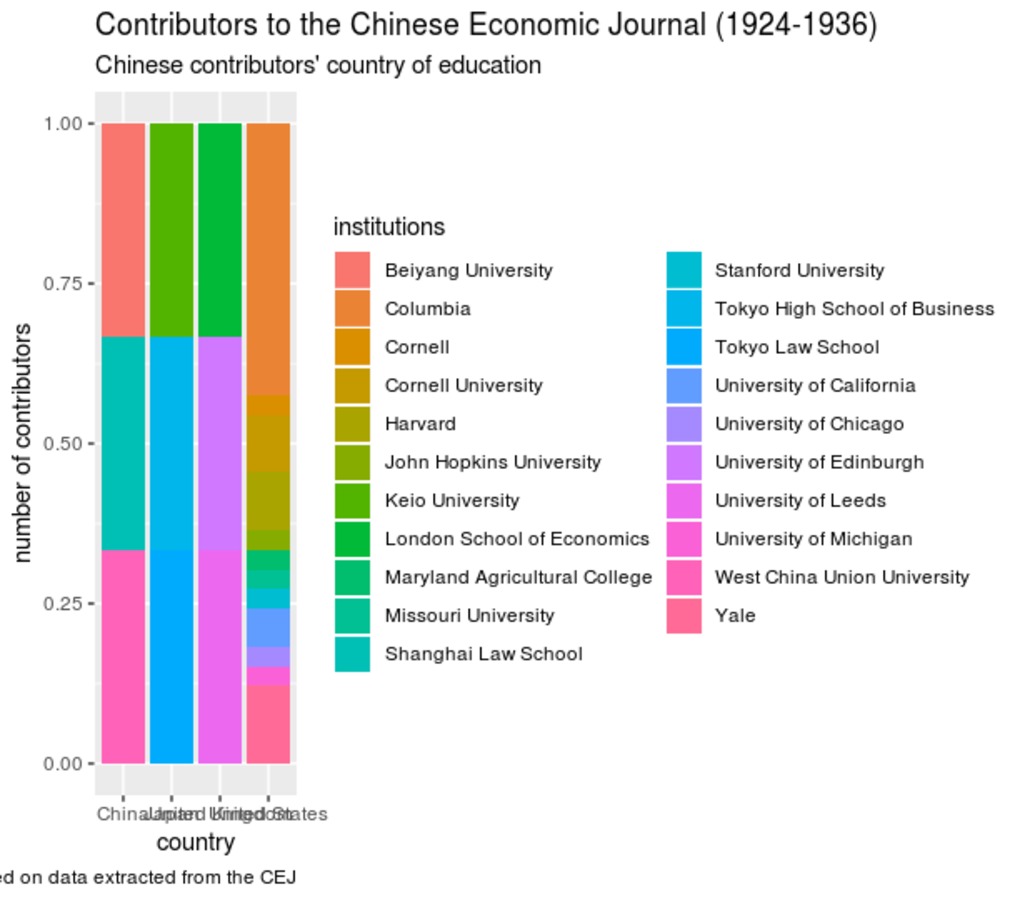
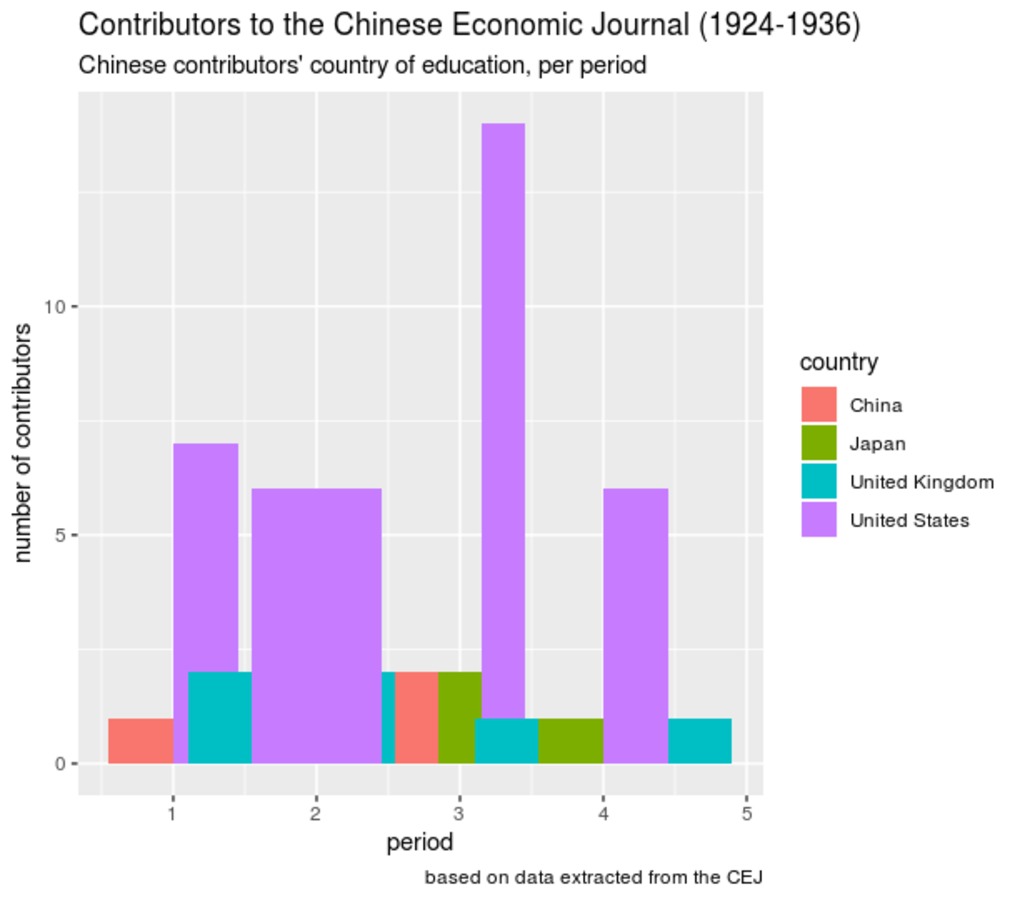 | 357 | Chinese contributors to the Chinese Economic Journal, per period (country of education) | Based on the following dataset, the attached graphs explore Chinese contributors' country of education (the country in which they received their highest degree) in the Chinese Economic Monthly/Journal between 1924 and 1936, per period. Relying on R package "ggplot2", we alternatively used faceted and dodged bar charts. |
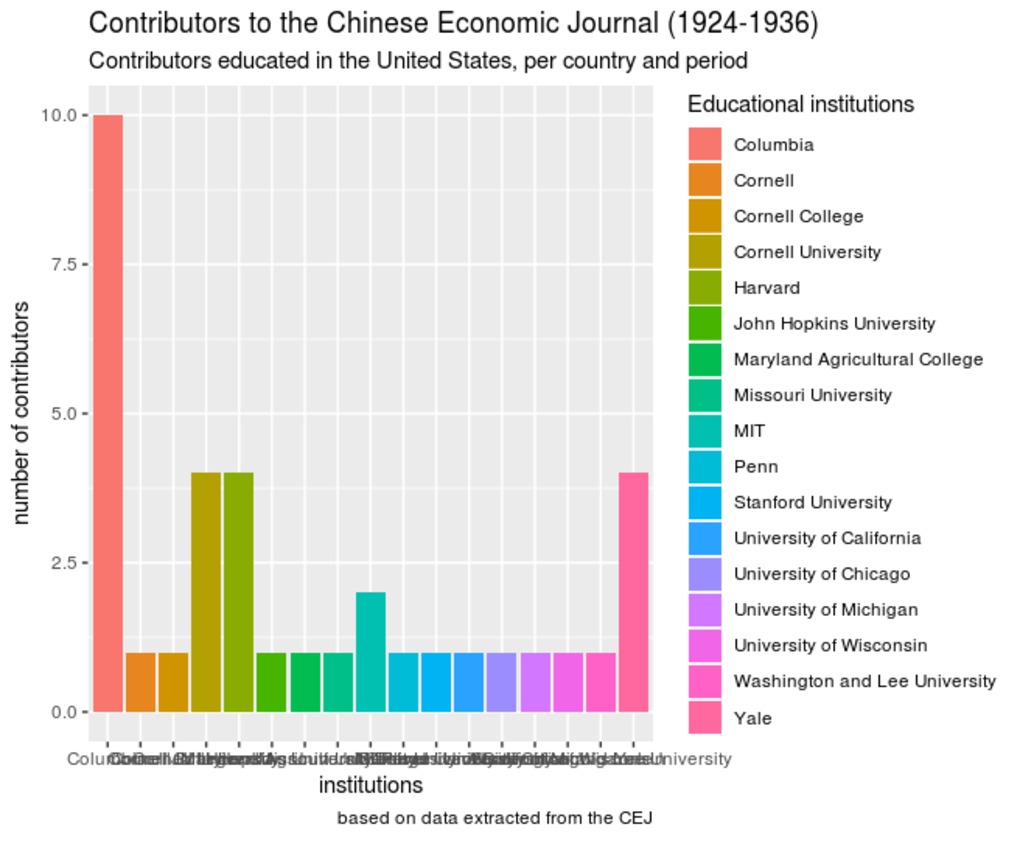 | 358 | Contributors to the Chinese Economic Journal, per period (educational institutions) | Based on the following dataset, the attached graphs explore contributors' educational institutions (the university in which they received their highest degree) in the Chinese Economic Monthly/Journal between 1924 and 1936, with a particular focus on the United States (1) and China (2). We relied on R package "ggplot2" to build these bar charts. |
 | 359 | Chinese contributors to the Chinese Economic Journal (educational institutions) | Based on the following dataset, the attached graphs explore Chinese contributors' educational institutions (the university in which they received their highest degree) in the Chinese Economic Monthly/Journal between 1924 and 1936, all periods included (1) and per period (2, 3). We relied on R package "ggplot2" to build these bar charts. |
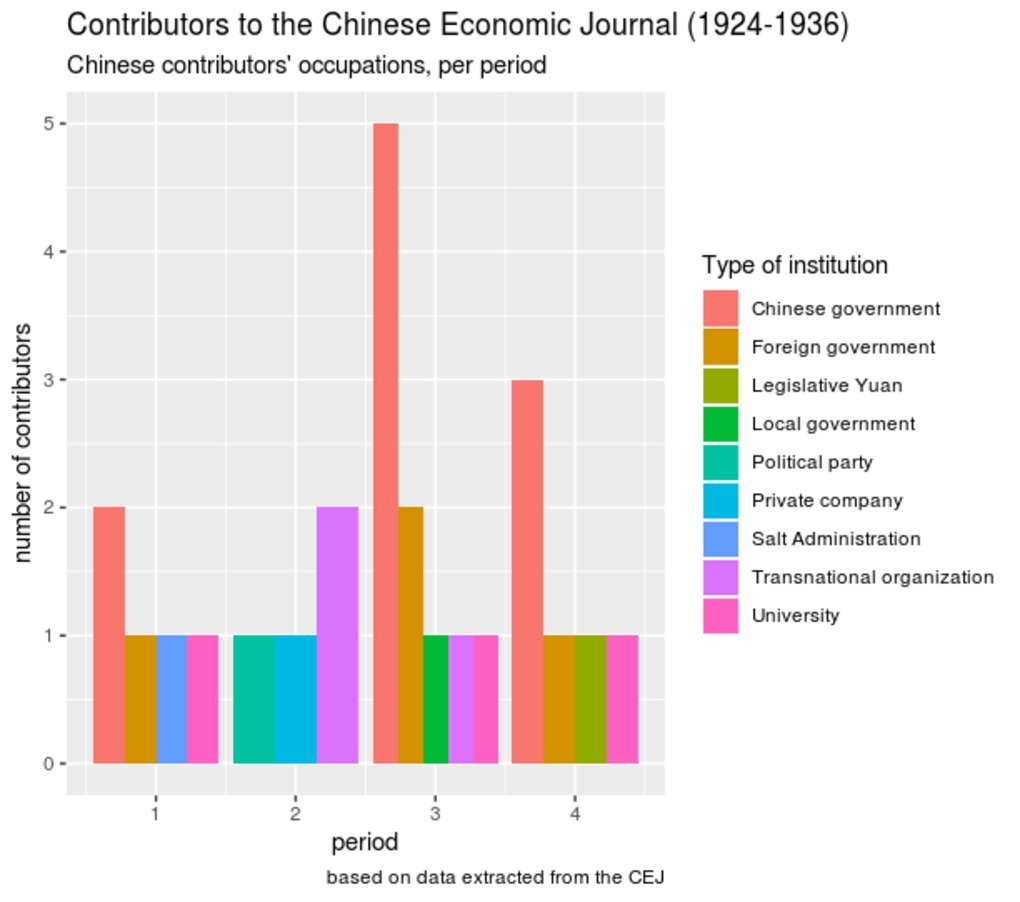 | 360 | Contributors to the Chinese Economic Journal (institutional positions) | Based on the following dataset, the attached graphs explore authors' institutional positions at the time they contributed to the Chinese Economic Monthly/Journal, per period (1, 2, 3) and sector of activity (4, 5). Relying on R package "ggplot2", we alternatively used faceted, stacked and dodged bar charts. The last set of graphs (6) provides a more detailed analysis of institutions, arranged by sector of activity and period. |
 | 361 | Contributors to the Chinese Economic Journal (country and city of occupation) | Based on the following dataset, the attached graphs aim to map the countries and cities in which the authors worked at the time they contributed to the Chinese Economic Monthly/Journal, all periods included (1, 2) and per period (3, 4). Relying on R package "ggplot2", we alternatively used bar charts and polar coordinates. |
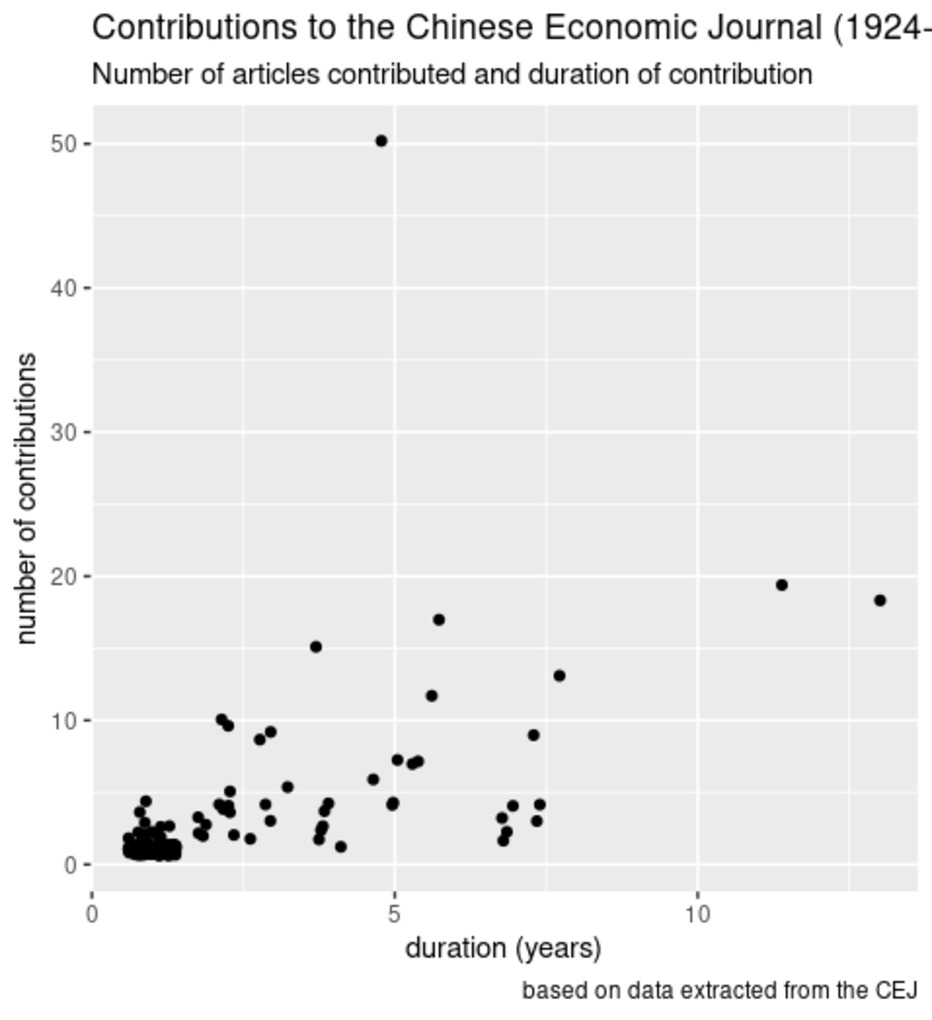 | 362 | Contributions to the Chinese Economic Journal (importance and duration) | Based on the following dataset, the attached graphs visualize the number of articles that individual authors contributed to the Chinese Economic Monthly/Journal, in relation to the duration of their contribution (number of years). We relied on R package "ggplot2" to build the scattered plots. In addition, we test multiple factors that may potentially account for their varying contribution to the journal: nationality (2), field of specialization (3), level of education (4), and institutional position (5). |
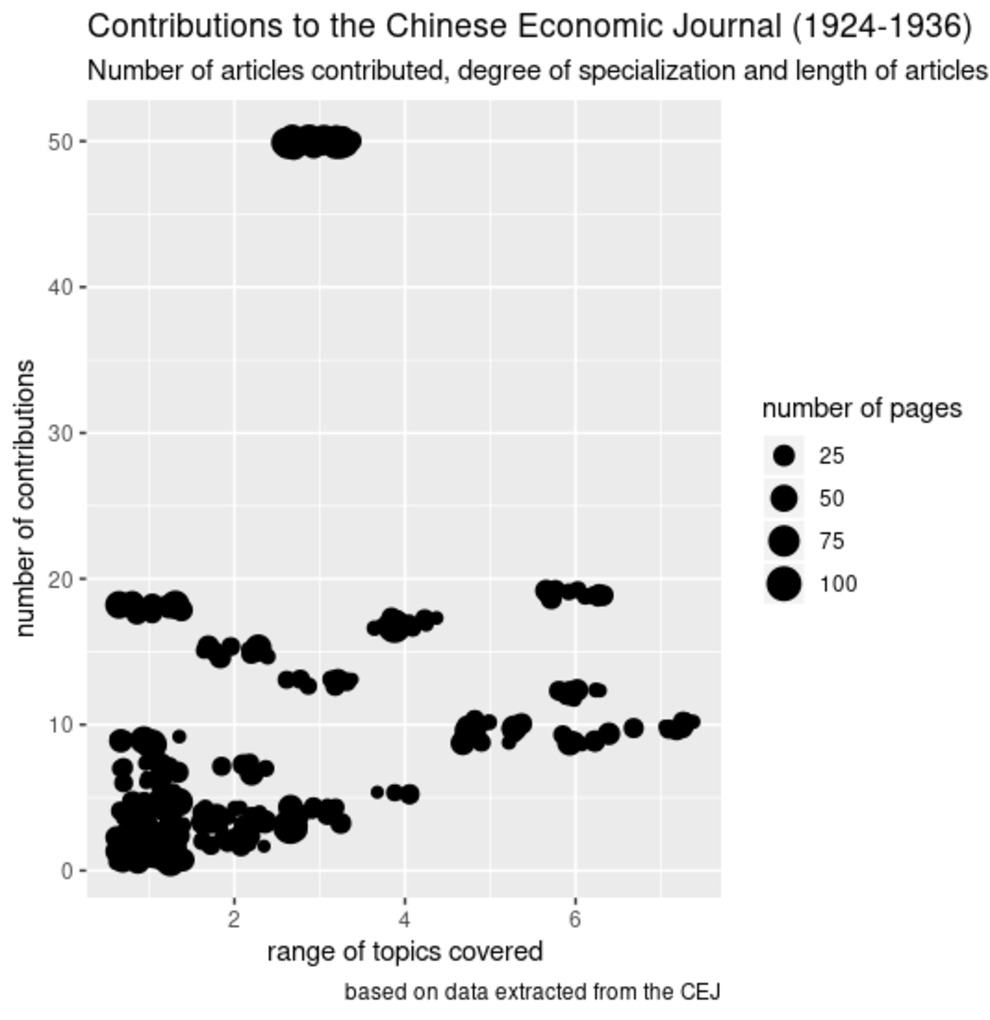
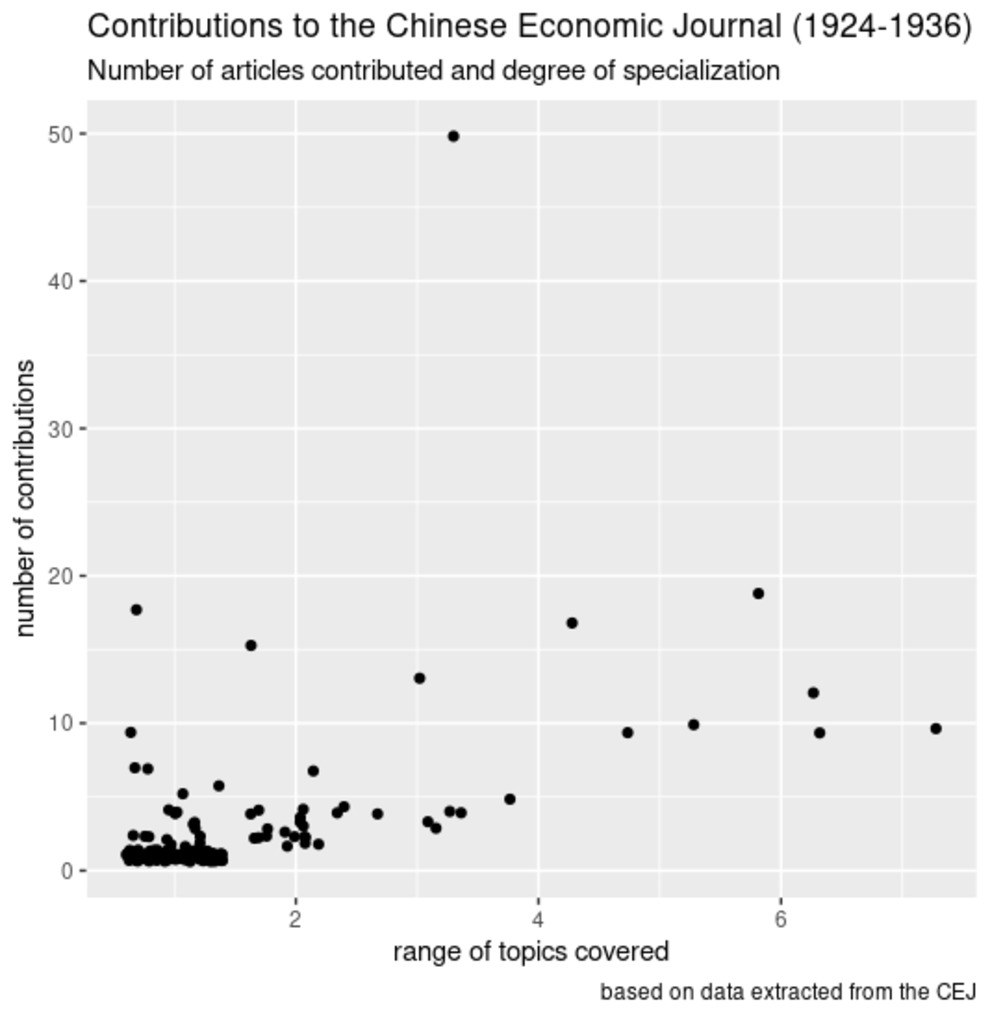 | 363 | Contributions to the Chinese Economic Journal (contributors' degree of specialization) | Based on the following dataset, the attached graphs visualize the number of articles that individual authors contributed to the Chinese Economic Monthly/Journal, in relation to the range of topics they addressed (number of distinct topics, on a scale ranging from 1 to 7), all periods included (1) and per period (2). We relied on R package "ggplot2" to build the scattered plots. |
 | 364 | Contributions to the Chinese Economic Journal (degree of specialization and contributors' nationality) | Based on the following dataset, the attached graphs aim to test the potential influence of contributions' nationality on the number of articles they contributed to the Chinese Economic Monthly/Journal, in relation to the range of topics they addressed (number of distinct topics, on a scale ranging from 1 to 7), all periods included (1) and per period (2). We relied on R package "ggplot2" to build the scattered plots. |
 | 365 | Contributions to the Chinese Economic Journal (degree and contributors' field of specialization) | Based on the following dataset, the attached graphs aim to test the potential influence of contributions' educational background (the academic disipline in which they graduated) on the number of articles they contributed to the Chinese Economic Monthly/Journal, in relation to the range of topics they addressed (number of distinct topics, on a scale ranging from 1 to 7), all periods included (1) and per period (2). We relied on R package "ggplot2" to build the scattered plots. |
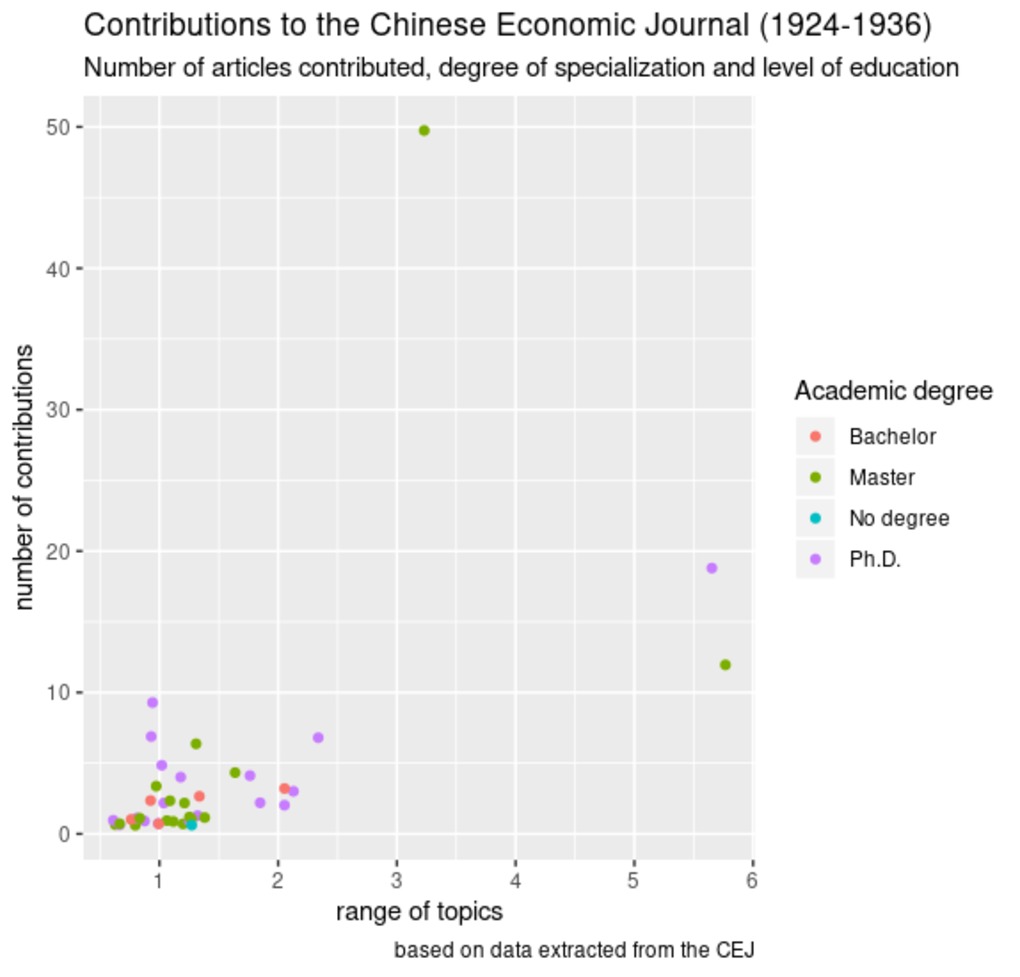 | 366 | Contributions to the Chinese Economic Journal (degree of specialization and contributors' level of education) | Based on the following dataset, the attached graphs aim to test the potential influence of contributions' educational background (the highest academic degree they obtained) on the number of articles they contributed to the Chinese Economic Monthly/Journal, in relation to the range of topics they addressed (number of distinct topics, on a scale ranging from 1 to 7), all periods included (1) and per period (2). We relied on R package "ggplot2" to build the scattered plots. |
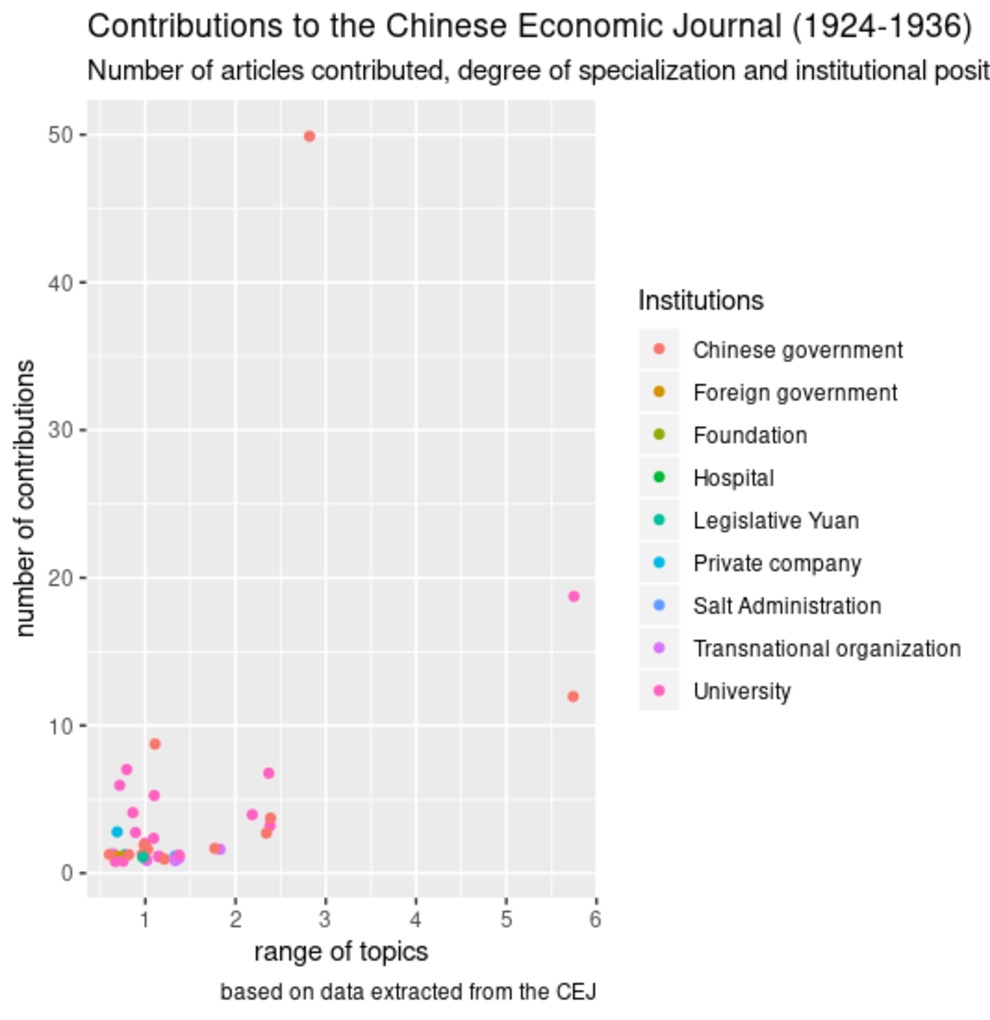 | 367 | Contributions to the Chinese Economic Journal (degree of specialization and contributors' institutional position) | Based on the following dataset, the attached graphs aim to test the potential influence of contributions' institutional position (sector of activity) on the number of articles they contributed to the Chinese Economic Monthly/Journal, in relation to the range of topics they addressed (number of distinct topics, on a scale ranging from 1 to 7), all periods included (1) and per period (2). We relied on R package "ggplot2" to build the scattered plots. |
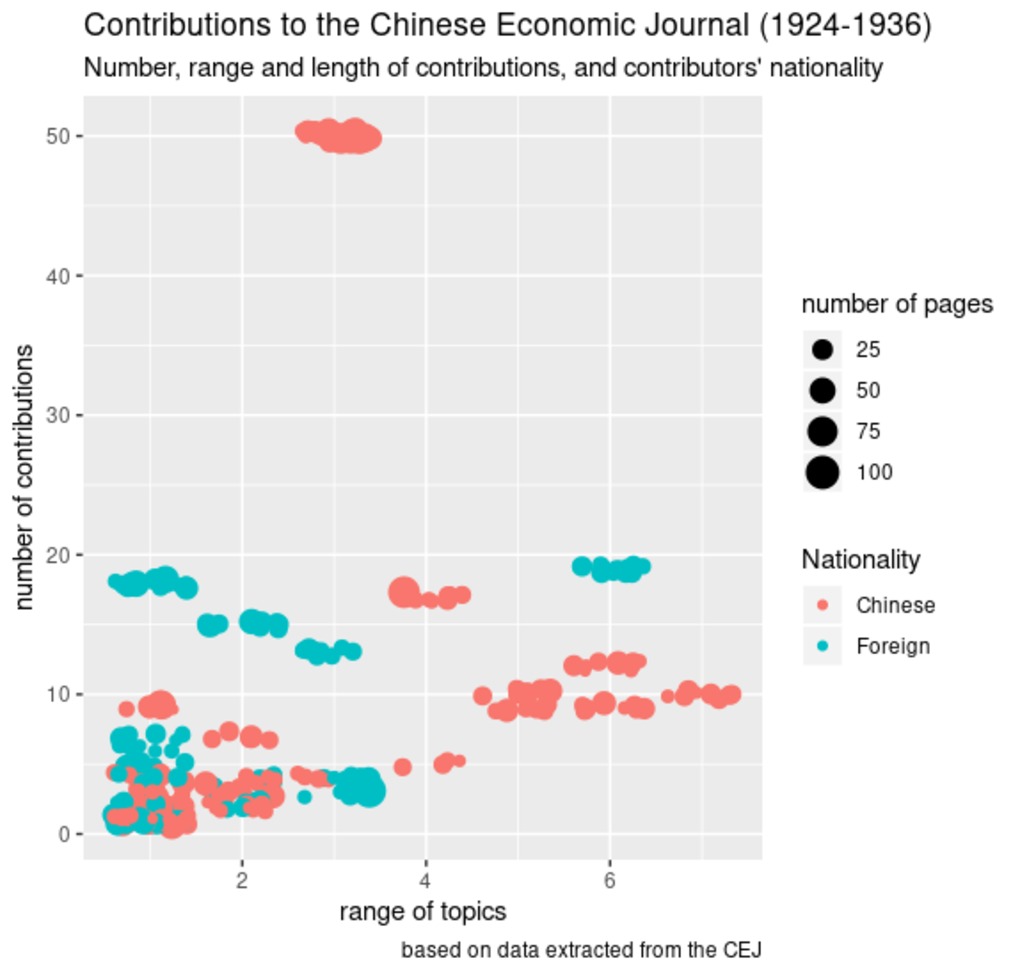 | 368 | Contributions to the Chinese Economic Journal (degree of specialization, length of articles and contributors' nationality) | Based on the following dataset, the attached graphs aim to test the potential influence of contributions' nationality on the number of articles they contributed to the Chinese Economic Monthly/Journal, in relation to the range of topics they addressed (number of distinct topics, on a scale ranging from 1 to 7) and the length of articles they contributed (measured by the number of pages), all periods included (1) and per period (2). We relied on R package "ggplot2" to build the scattered plots. |
 | 369 | Contributions to the Chinese Economic Journal (degree of specialization and length of articles) | Based on the following dataset, the attached graphs visualize the number of articles that individual authors contributed to the Chinese Economic Monthly/Journal, in relation to the range of topics they addressed (number of distinct topics, on a scale ranging from 1 to 7) and the length of articles they contributed (measured by the number of pages, visualized by the varying size of dots), all periods included (1) and per period (2). We relied on R package "ggplot2" to build the scattered plots. |
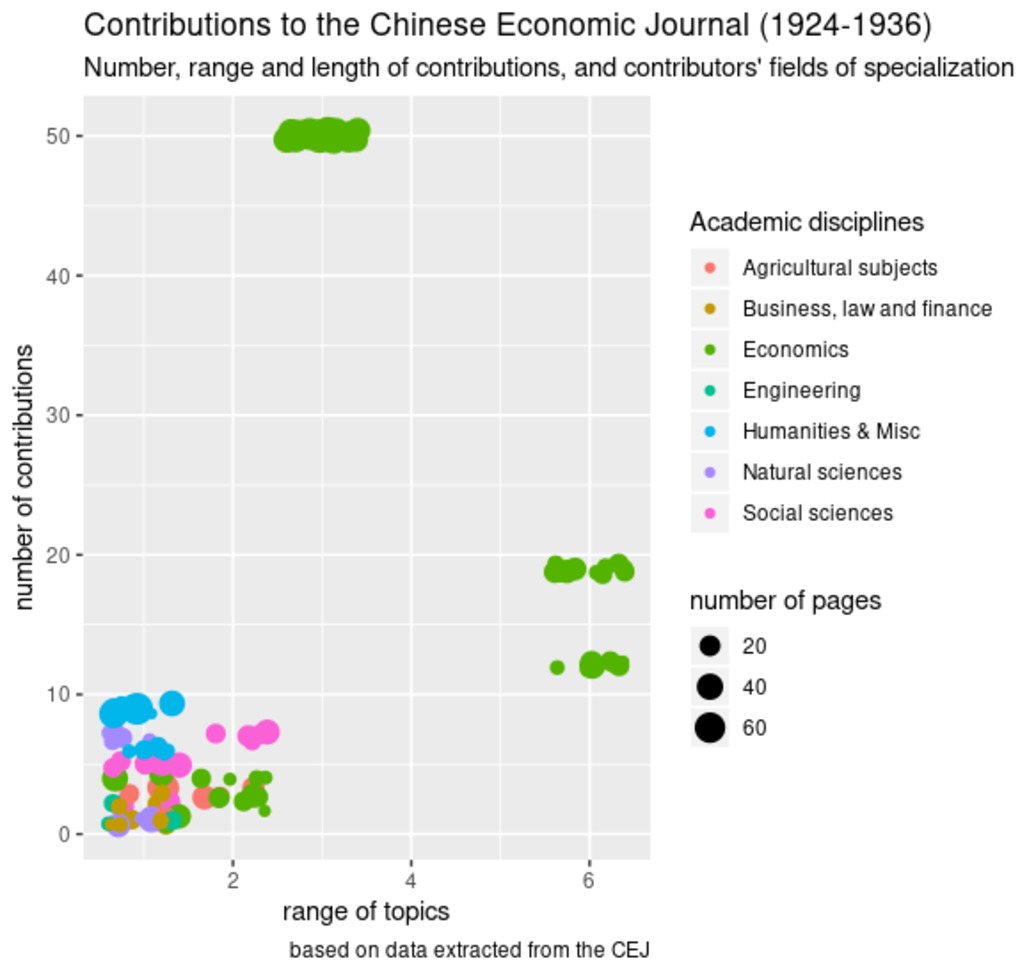 | 370 | Contributions to the Chinese Economic Journal (degree of specialization, length of articles and contributors' fields of specialization) | Based on the following dataset, the attached graphs aim to test the potential influence of contributions' educational backbround (the academic disciplines in which they graduated) on the number of articles they contributed to the Chinese Economic Monthly/Journal, in relation to the length of articles (measured by the number of pages, visualized by the varying size of dots), and the range of topics they addressed (number of distinct topics, on a scale ranging from 1 to 7), all periods included (1) and per period (2). We relied on R package "ggplot2" to build the scattered plots. |
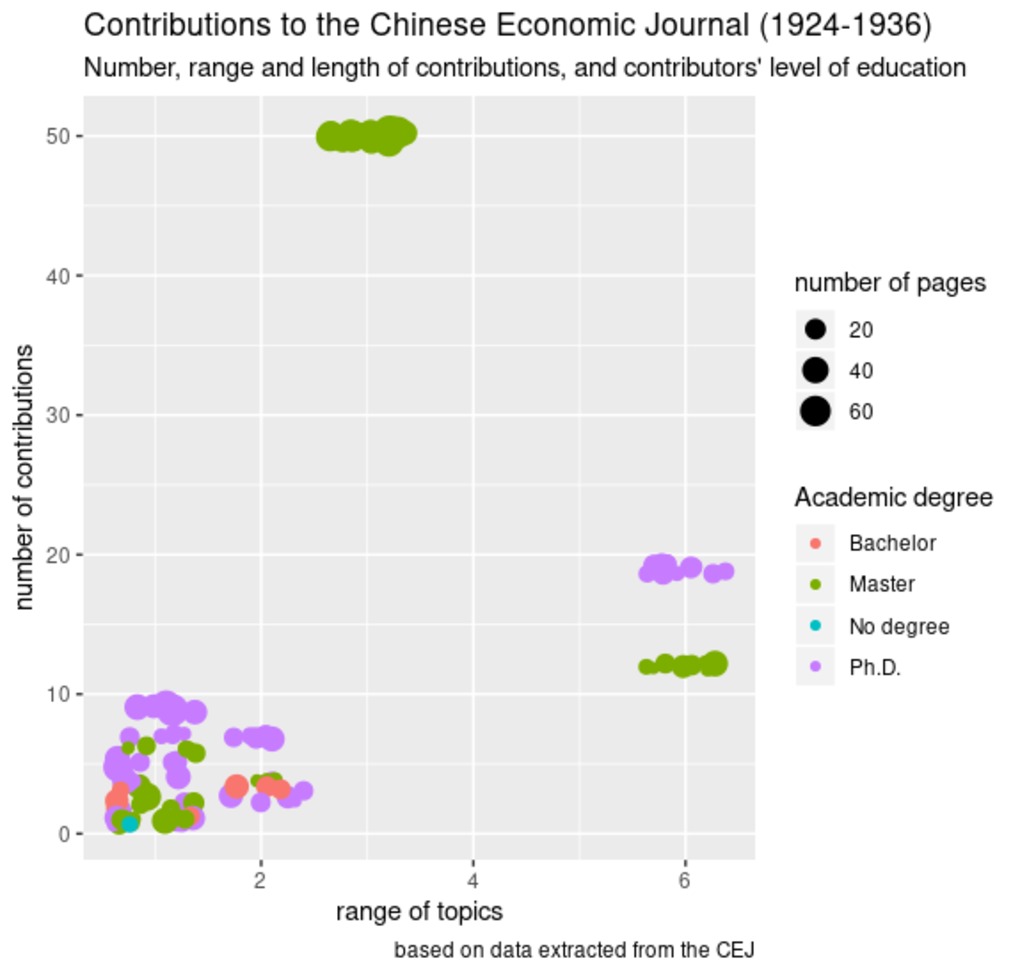 | 371 | Contributions to the Chinese Economic Journal (degree of specialization, length of articles and contributors' level of education) | Based on the following dataset, the attached graphs aim to test the potential influence of contributions' educational backbround (the highest academic degree they obtained) on the number of articles they contributed to the Chinese Economic Monthly/Journal, in relation to the length of articles (measured by the number of pages, visualized by the varying size of dots), and the range of topics they addressed (number of distinct topics, on a scale ranging from 1 to 7), all periods included (1) and per period (2). We relied on R package "ggplot2" to build the scattered plots. |
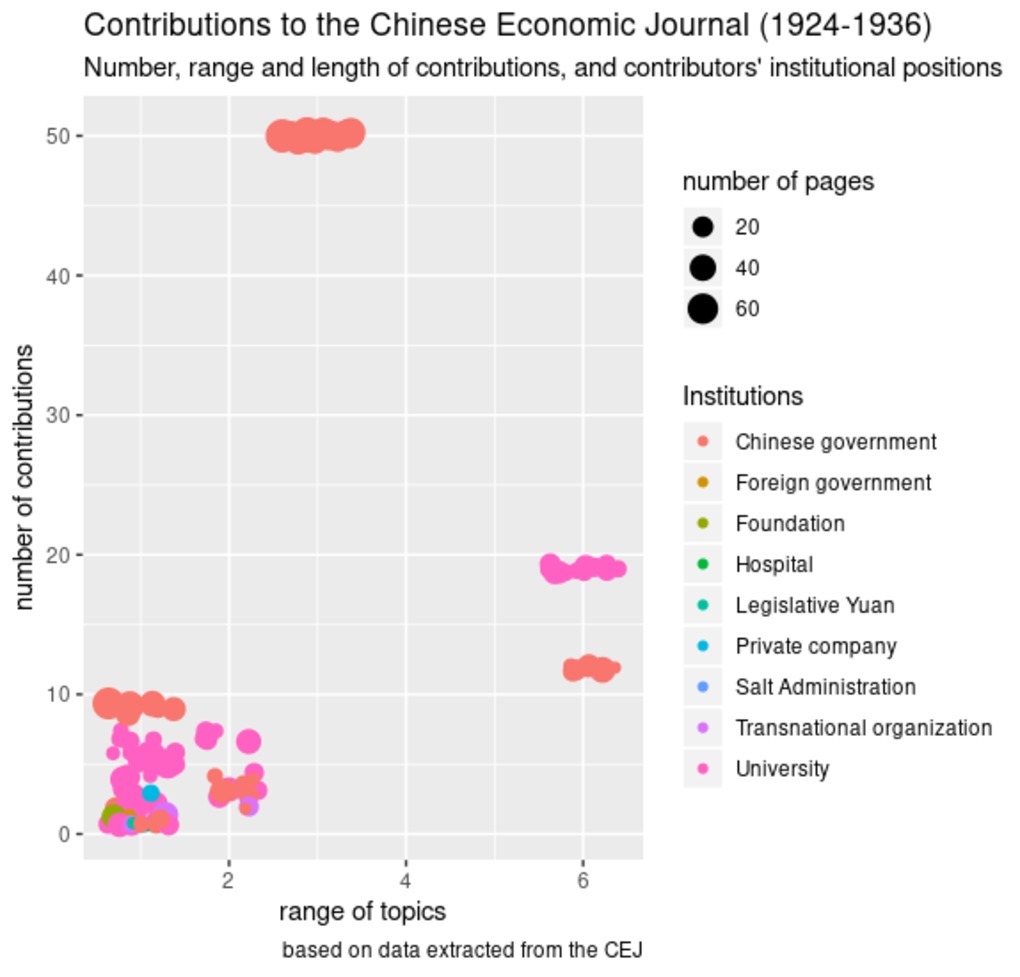 | 372 | Contributions to the Chinese Economic Journal (degree of specialization, length of articles and contributors' institutional position) | Based on the following dataset, the attached graphs aim to test the potential influence of contributions' institutional positions (sector of activity) on the number of articles they contributed to the Chinese Economic Monthly/Journal, in relation to the length of articles (measured by the number of pages, visualized by the varying size of dots), and the range of topics they addressed (number of distinct topics, on a scale ranging from 1 to 7), all periods included (1) and per period (2). We relied on R package "ggplot2" to build the scattered plots. |
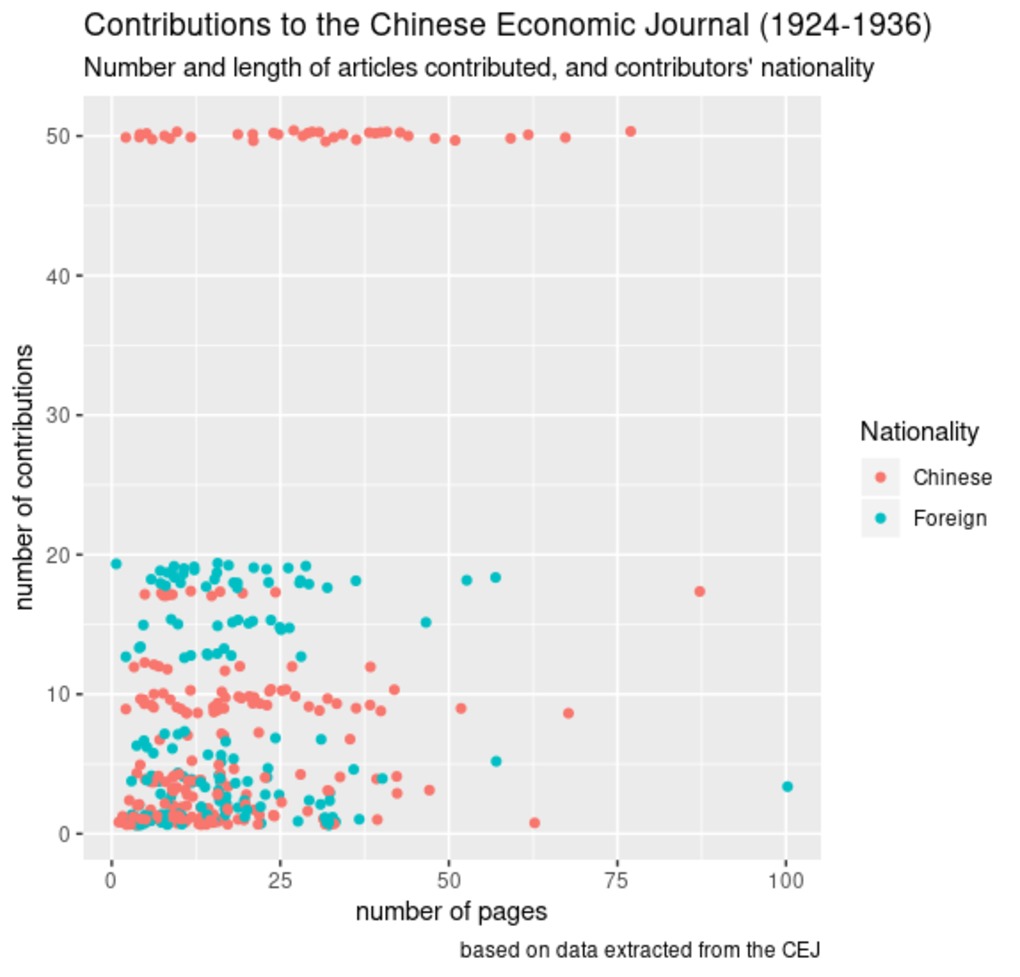 | 373 | Contributions to the Chinese Economic Journal (length of articles and contributors' nationality) | Based on the following dataset, the attached graphs aim to test the potential influence of contributions' nationality on the number of articles they contributed to the Chinese Economic Monthly/Journal, in relation to the length of articles (measured by the number of pages), all periods included (1) and per period (2). We relied on R package "ggplot2" to build the scattered plots. |
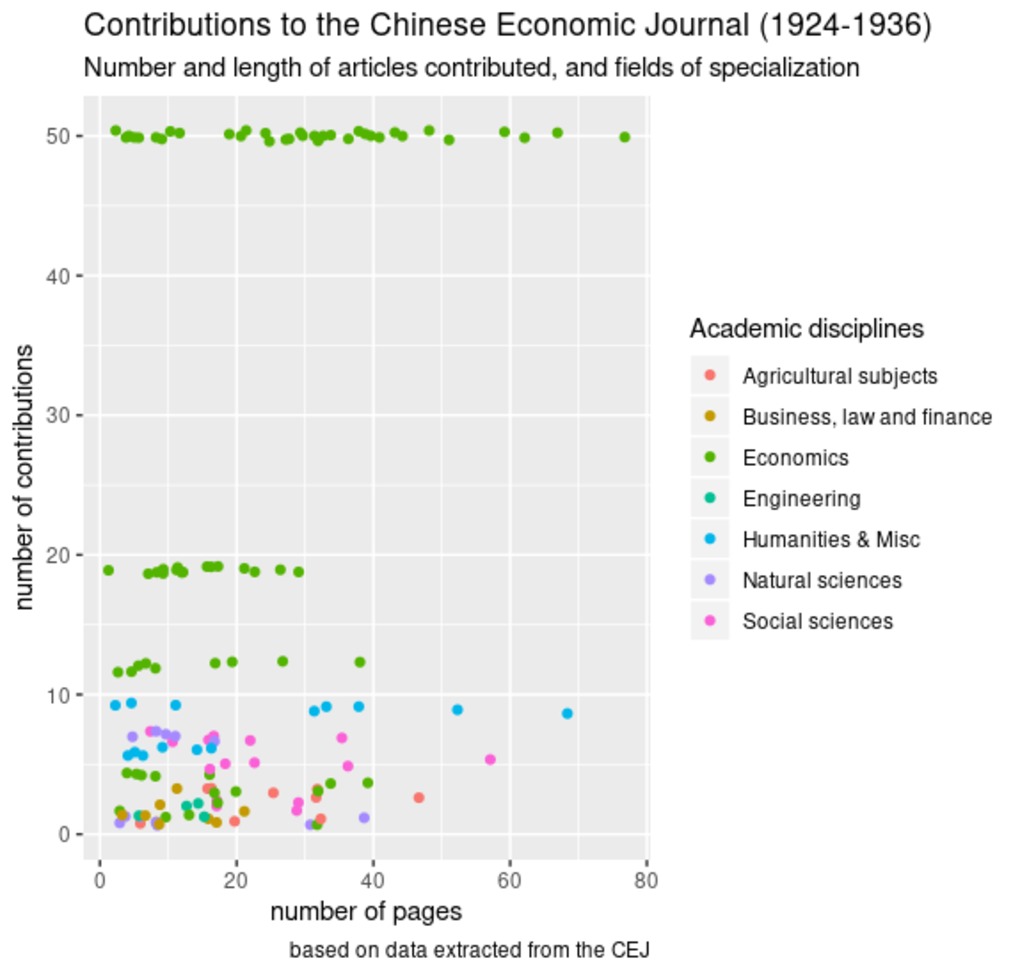 | 374 | Contributions to the Chinese Economic Journal (length of articles and contributors' fields of specialization) | Based on the following dataset, the attached graphs aim to test the potential influence of contributions' educational backbround (the academic disciplines in which they graduated) on the number of articles they contributed to the Chinese Economic Monthly/Journal, in relation to the length of articles (measured by the number of pages, visualized by the varying size of dots), all periods included (1) and per period (2). We relied on R package "ggplot2" to build the scattered plots. |
 | 375 | Contributions to the Chinese Economic Journal (length of articles and contributors' level of education) | Based on the following dataset, the attached graphs aim to test the potential influence of contributions' educational backbround (the highest academic degree they obtained) on the number of articles they contributed to the Chinese Economic Monthly/Journal, in relation to the length of articles (measured by the number of pages, visualized by the varying size of dots), all periods included (1) and per period (2). We relied on R package "ggplot2" to build the scattered plots. |
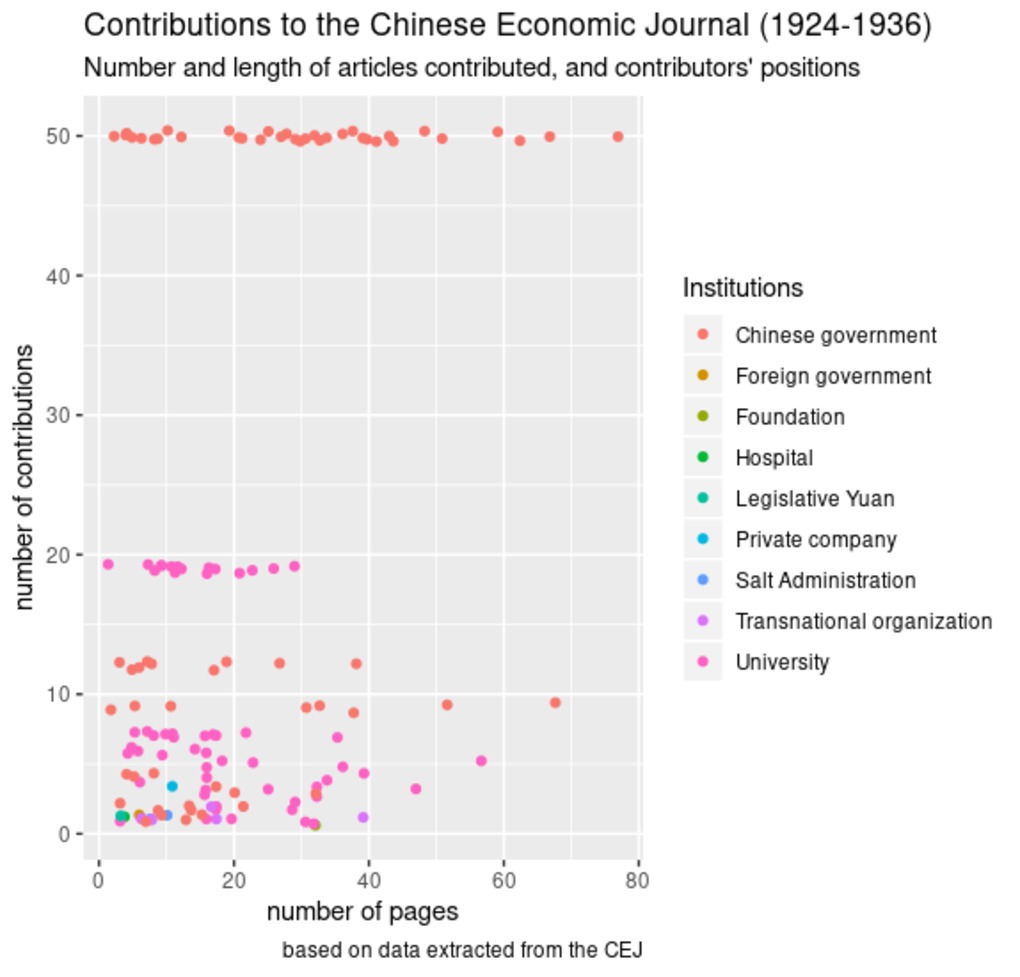 | 376 | Contributions to the Chinese Economic Journal (length of articles and contributors' institutional position) | Based on the following dataset, the attached graphs aim to test the potential influence of contributions' institutional positions (sector of activity) on the number of articles they contributed to the Chinese Economic Monthly/Journal, in relation to the length of articles (measured by the number of pages, visualized by the varying size of dots), all periods included (1) and per period (2). We relied on R package "ggplot2" to build the scattered plots. |
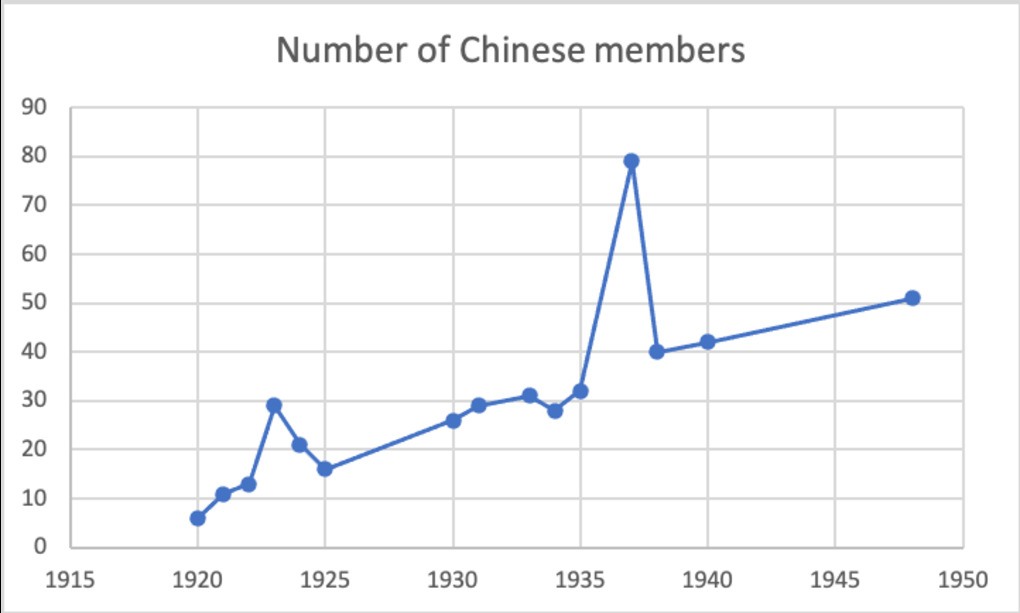 | 385 | Chinese membership in the Rotary Club of Shanghai | The attached graphs show the growth of Chinese membership in the Rotary Club of Shanghai from 1920 to 1948. The first graph reflect the growth in number while the two others show the proportion of Chinese members compared to foreign members and total membership. Data comes from rosters of members and membership lists available in the Archives of Rotary International, Evanston, Ill. The tables used for building the graphs are available in the "Tables" Section. The graphs reveal that Chinese membership increased gradually over time. There was a steady growth between 1920 (only one member, Y.C. Tong) and 1948 (51 members), with a short peak in 1937 (80). In the aftermath of the outbreak of the Sino-Japanese war in August 1937, Chinese membership declined significantly. It was halved during the first year of the war, falling to 40 members in 1938, 43 in 1939 and finally 30 in 1945. During the postwar years, however, the incorporation of members resumed, and Chinese membership climbed to 51 members in July 1948, a few months before the establishment of the Chinese-speaking Rotary Club of Shanghai West. The growth of Chinese membership is even more striking when compared to the total membership. On average, Chinese members represented 29% of all Shanghai Rotarians during the entire period. While they amounted to less than 20% of the total membership until 1923, their share rose to more than one quarter between 1923 and 1935 (except in 1924, with 18%) and reached a peak just before the outbreak of the war (61%). For the first time, Chinese members represented the majority in the club. This figure fell to 32% in 1938 but rose again to 44% in 1939, 40% in 1945 and 42% in 1948. In the end, the war reversed the proportion of Chinese and foreign members. As many foreigners left the country immediately after the bombings in August 1937, and even more after Pearl Harbor (December 1941), Chinese members remained close to the majority from 1938 onwards. |
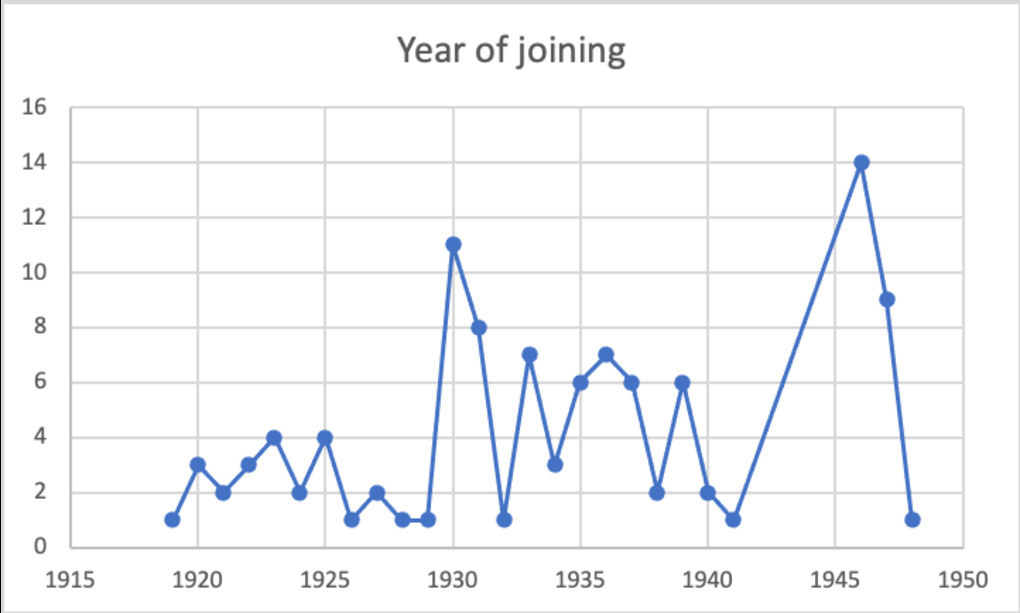 | 386 | Chinese Rotarians: Joining year and duration of membership | The attached graphs show the yearly distribution of Chinese members' incorporation into the Rotary Club of Shanghai and the duration of their membership. Data comes from rosters of members and membership lists available in the Archives of Rotary International, Evanston, Ill. The tables used for building the graphs are available in the "Tables" Section. The graphs reveal that the admission of Chinese nationals remained low during the first decade (1919-1929), with less than five new members per year, and only one (Y.C. Tong) during the first year (1920). There was a first peak in 1930 (11 new members). Between 1933 and 1940, the number of new members per year remained unstable, oscillating between a minimum of three (1934) and a maximum of seven (1936). The incorporation of Chinese members resumed after the war and reached its highest peak in 1945 (14 new members that year).* Since most members joined after 1930, and given their high professional mobility and the politically unstable situation in Shanghai and China more generally, it is quite remarkable that three members maintained their membership for over twenty years. C.T. Wang (Wang Zhenting) held the record, with twenty-eight years of membership, followed by Imin Hsu and Percy Kwok (21 years). Twenty-four members (22%) remained for more than ten years, and eighteen (17%) from five to ten years. The majority, however, stayed less than five years (53 members), including fourteen who left within a year. *Due to the lack of rosters between 1925-1930 and 1940-1945, however, we cannot assess the exact date of incorporation for members who joined in the 1920s and during the war. In reality, the trend was probably smoother than shown on the graph. |
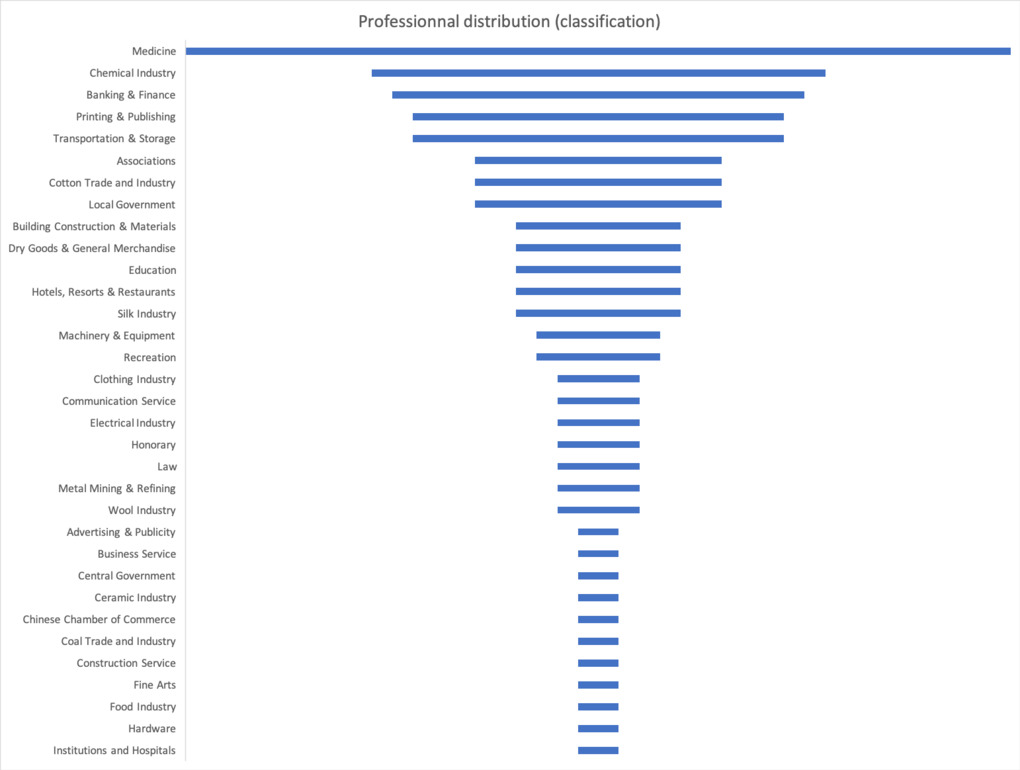 | 387 | Chinese Rotarians: Classification | The attached graphs offer various ways of visualizing the professional distribution of Chinese members of the Rotary Club of Shanghai (funnel, bar charts, tree maps). Our analysis is based on a simplified version of the standard classification of professions devised by Rotary International in the early 1920s. The four first graphs shows the general distribution (all periods included), while the last one shows the distribution of professions across the three major periods we delineated in the history of the club from the perspective of Chinese membership: (1) the beginning of the club and weak Chinese membership prior to 1930 (2) growth of Chinese membership and climax of the club in the 1930s (1930-1937) (3) war and postwar period (1938-1948). Data comes from rosters of members and membership lists available in the Archives of Rotary International, Evanston, Ill. The tables used for building the graphs are available in the "Tables" Section. The graphs reveal that the medical profession was by far the best represented occupation among Chinese Rotarians (20 members, 16%). The chemical industry and financial services (including banking, insurance and savings banks) formed the second largest professional group (11 members, 9% each), followed by printing/publishing (newspapers, publishing houses), and transportation/storage (9 members, 7% each). The fourth group included four main sectors represented by six Rotarians each (5%): the cotton industry, associations, education/hospitals, and local government. The latter referred mostly to officers in the municipality of Greater Shanghai, but there was also one member who worked for the Shanghai Municipal Council and two for the provincial government. The next group (representing less than 5% of Chinese members) comprised five branches of activities that were also well-developed in Shanghai during the Republican period: building construction and materials (including architecture) (five members, 4%), general merchandising (especially department stores), tourism (hotels, restaurants), silk industry (which probably reflected the proximity of Suzhou, major center for silk production), and machinery (four Rotarians, 3% each). Next, recreation (movie theatres) and communication services (radio, advertising) employed three Rotarians each (2%). The last group was made up of less-developed industries that employed two Rotarians each: metal, electrical, wool and clothing. The remaining Rotarians were scattered across miscellaneous sectors: fine arts, ceramic, coal and food industry. Two industrial branches made only a short appearance in the reorganized club in 1945 (grain and tobacco leaf distribution). In addition, there were two lawyers (H.C. Mei and W. Hung) and three honorary members, either government officials (C.T. Wang, Wellington Koo) or Y.M.C.A. leaders (Fong Sec). Although the by-laws stated that “Persons holding elective or appointive public office, for a specified term only, shall not be eligible to active membership as a representative of such office” it is interesting to notice that the Mayor of Shanghai (Wu Tiesheng) was a member of the club while he was in office, and that honorary members C.T. Wang and Wellington Koo were concurrently holding prominent positions in the central government at the time of their membership. The war did not affect much the professional distribution of members, except for the disappearance of the Printing/Publishing class - a longstanding, major sector of activity in Shanghai. After the war, therefore, medicine, the chemical industry, banking/finance and the cotton/textile industry still topped the list in the reorganized club in 1945. There were no major changes in 1948, except that associations had gained in importance due to the postwar reconstruction work, ranking third after medicine and the chemical industry, equaling banking and superseding the cotton industry. What can we draw from this analysis? The classification structure of Chinese Rotarians reflected quite faithfully the local industrial fabric and the social-professional make-up of Chinese elites in Shanghai during the Republican period. Indeed, the Rotary Club of Shanghai functioned as a microcosm of Shanghai business and professional elites, with only one (ideally the best) representative of each branch of activity, as the by-laws requested. It is interesting to notice, however, that some sectors remained utterly missing – especially agriculture-related activities – sectors that were poorly developed in Shanghai and among Chinese Westernized elites more particularly. |
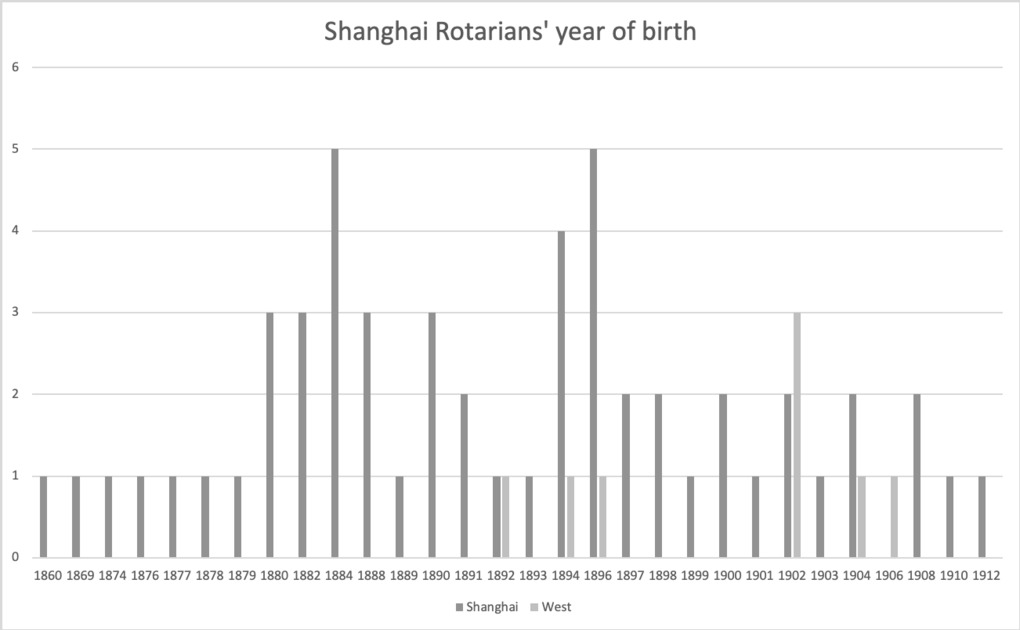 | 389 | Chinese Rotarians: Year of birth and age at joining | The attached graphs show the distribution of Chinese Rotarians' year of birth and examine at what age they joined the two clubs (the original Rotary Club of Shanghai estbalished in 1919 and the Chinese-speaking Rotary Club of shanghai West established in 1948). To compute their age, we simply compared their year of birth with the year they joined the club. Membership data (year of joining) comes from rosters available in the Archives of Rotary International, Evanston, Ill. Birth data comes from the series of Who's Who available through the Integrated Information System on Modern and Contemporary Characters (IISMCC) hosted by the Academia Sinica’s Institute of Modern History. The tables used for building the graphs are available in the "Tables" Section. The graphs reveal that the majority of Chinese Rotarians in Shanghai was born between 1880 and 1896 (31, 53%), with two peaks in 1884 and 1896 (5 members each year) (cf. table/graph). Seven Rotarians were born before 1880 (12%) and the seventeen remaining between 1897 and 1912. To sum up, the majority was born before the Revolution and the establishment of the Republic (1911-2). They grew up in the late 1890s-early 1900s and were in their twenties or thirties when Rotary was introduced in China. The oldest member was fifty-nine and the youngest was barely seven years-old when the first club was established in Shanghai in 1919. The distribution of birth dates further suggests that most of them received their education after the imperial examination system was abolished in 1905, which means that they were likely to attend Western-style universities in China or abroad in order to earn their academic credentials, as we will elaborate later. The age distribution graph confirms that most new members were in their thirties or forties when they joined the club (43 members, 78%). Four members joined in their twenties, twenty-one in their thirties (35%) and twenty-two in their forties (37%). Only seven members were over fifty, among whom three were older than sixty. In other words, Chinese Rotarians in Shanghai formed a young, active population made up of mature men at the height of their professional life. Although the Rotary Club of Shanghai West was established some thirty-one years later than the pioneering one, its members were not much younger than their predecessors. In fact, they belonged to the same generation. Among the eight members we identified, three were born in the 1890s, two in 1902, one in 1904 and one in 1906 (cf. table/graph). Overall, they joined the club a slightly later age than their counterparts of the foreign-speaking club. All members were over 40 when they joined, three being over 50 (but no one over 60). |
 | 390 | Chinese Rotarians: Provincial origins | The attached graphs offer various ways of visualizing the distribution of Chinese Rotarians' provincial origins (place of birth). Data comes from the series of Who's Who available through the Integrated Information System on Modern and Contemporary Characters (IISMCC) hosted by the Academia Sinica’s Institute of Modern History. The tables used for building the graphs are available in the "Tables" Section. The distribution of members’ provincial origin reveals a clear pattern of geographical proximity. Most Chinese Rotarians in Shanghai came from Jiangsu (19 members, 33%, among whom 13 were born in Shanghai proper) or the bordering provinces of Zhejiang (11 members, 19%) and Guangdong (10 members, 10%). Ten members, however, came from more remote regions, namely Hubei (3), Hebei (2), Jiangxi (2), Fujian (2). Five were born abroad, in Singapore, Australia, Canada, and two in the United States. Overall, our analysis is consistent with previous studies of Westernized Chinese, which have demonstrated that the large majority of American-trained Chinese, more specifically, were originally from Guangdong, Jiangsu and Zhejiang provinces.
|
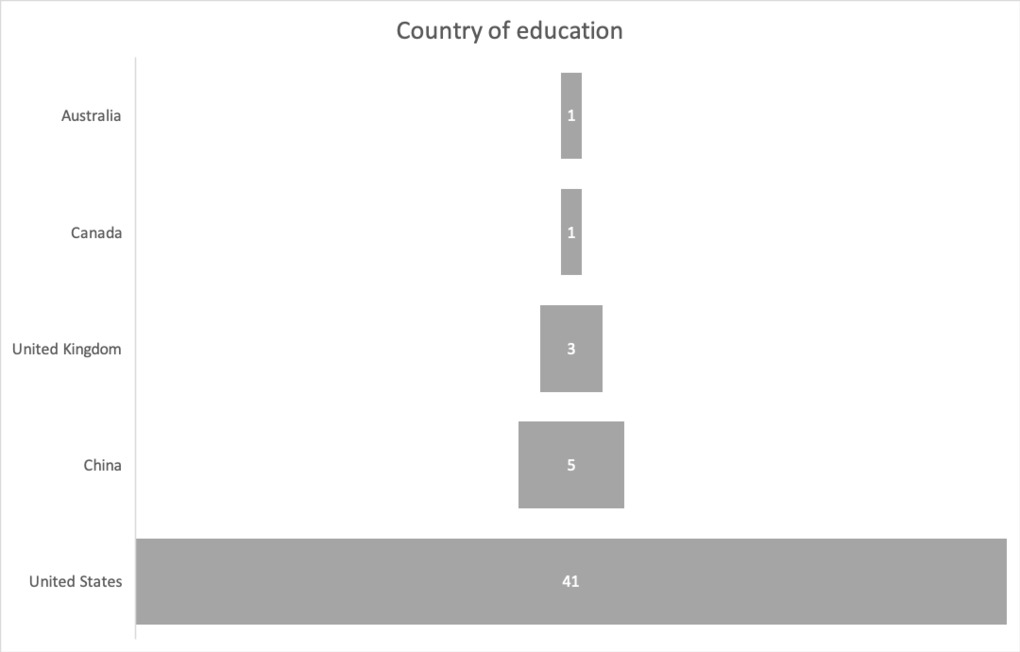 | 392 | Chinese Rotarians: Country of education | The attached graphs offer various ways of visualizing the distribution of Chinese Rotarians' country of education. They reveal the dominance of American-returned students. Data comes from the series of Who's Who available through the Integrated Information System on Modern and Contemporary Characters (IISMCC) hosted by the Academia Sinica’s Institute of Modern History. The tables used for building the graphs are available in the "Tables" Section.
|
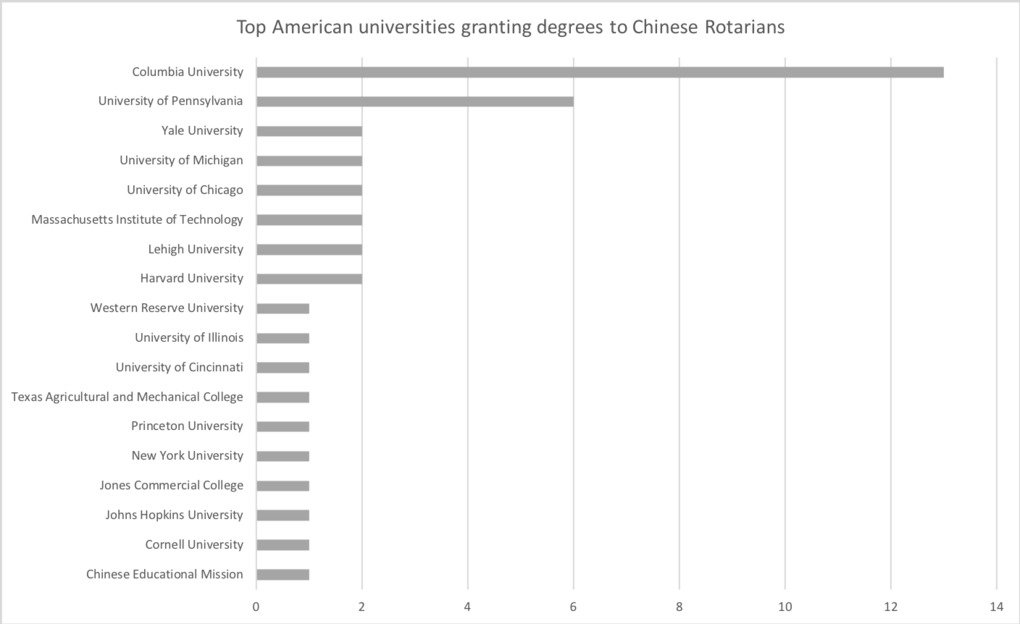 | 393 | Chinese Rotarians: University of education | The attached graphs examine the universities in which Chinese Rotarians trained in the United States pursued their studies (we selected only the institutions in which they obtained their highest academic degree). Data comes from the series of Who's Who available through the Integrated Information System on Modern and Contemporary Characters (IISMCC) hosted by the Academia Sinica’s Institute of Modern History. The tables used for building the graphs are available in the "Tables" Section. Among the forty-one US-trained Rotarians, one-third (13) was graduated from Columbia University, followed by the University of Pennsylvania (6 graduates). The next group comprises six elite universities that trained two Chinese each - Harvard, Lehigh (Pennsylvania), Massachusetts Institute of Technology (MIT), Chicago, Michigan and Yale. The remaining Rotarians were scattered across other elite universities - Cornell, Johns Hopkins, New York, Princeton, Cincinnati, Texas Agricultural and Mechanical College, University of Cincinnati, of Illinois, and Jones Commercial College (Chicago). Interestingly, there was one representative from the early Chinese Educational Mission (1872-1881), namely Y.C. Tong (the first Chinese to join the Rotary Club of Shanghai in 1920), who upon his return to China served in the late Qing Telegraph Administration. In sum, most Shanghai Rotarians were educated in top-ranking American universities, mostly on the Eastern coast of the United States. Only one member received a private education at home - a residual practice of imperial educational system.
|
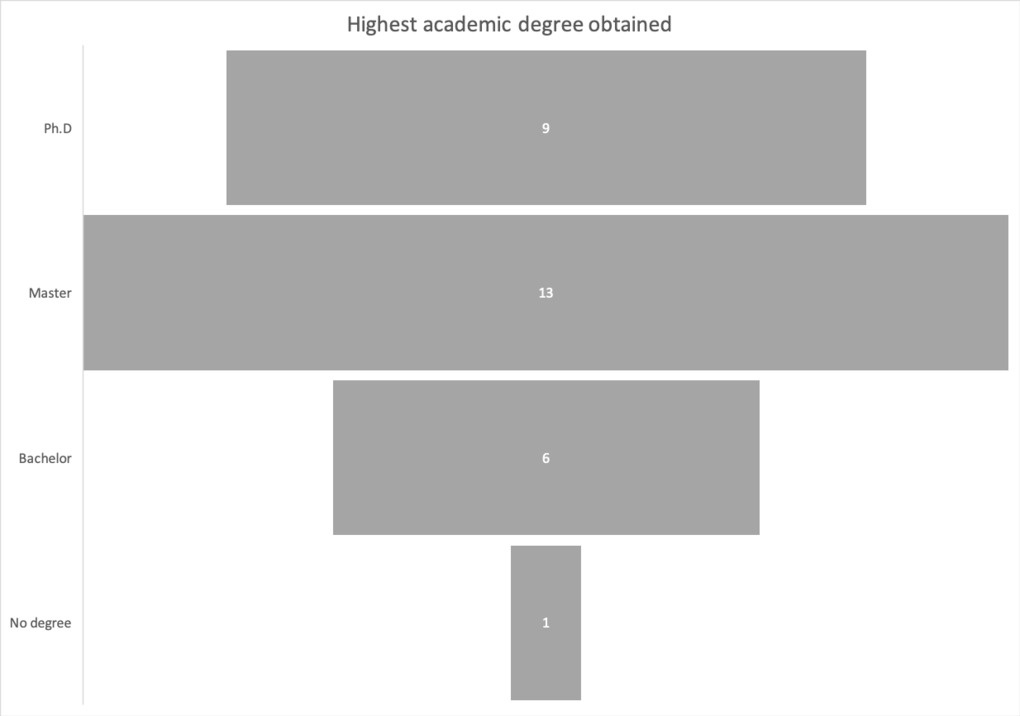 | 394 | Chinese Rotarians: Academic degree | The attached graphs examine Chinese Rotarians' level of education (based on the highest academic degree they earned). Data comes from the series of Who's Who available through the Integrated Information System on Modern and Contemporary Characters (IISMCC) hosted by the Academia Sinica’s Institute of Modern History. The tables used for building the graphs are available in the "Tables" Section. The graphs reveal the high level of qualifications of Chinese Rotarians, with a remarkably large number of Master and Ph.D graduates.
|
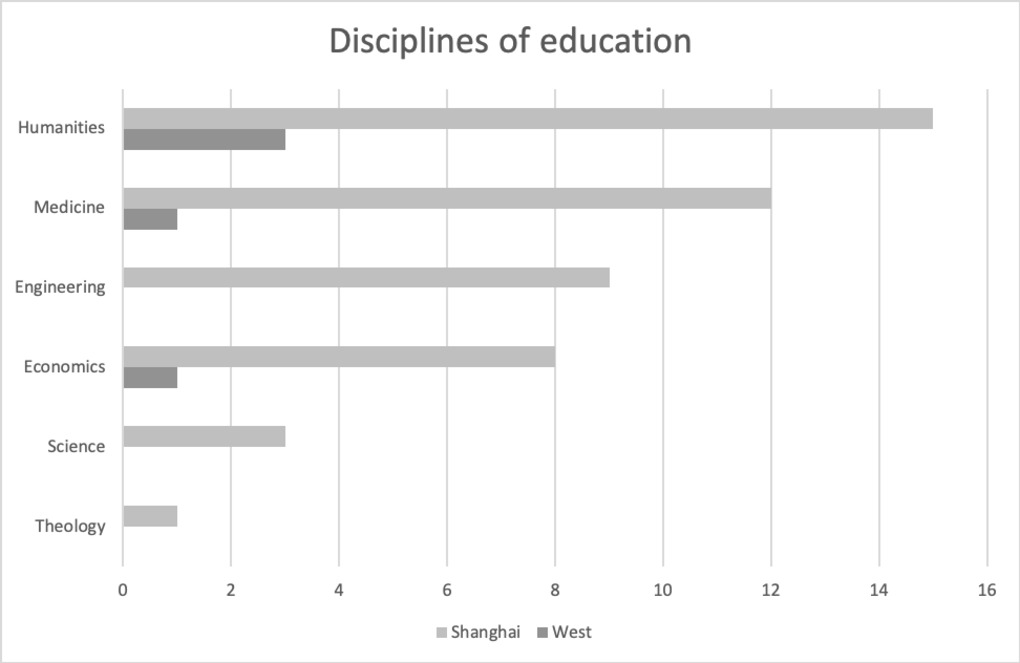 | 395 | Chinese Rotarians: Academic major | The attached graphs examine the discipline in which Chinese Rotarians graduated (based on the highest academic degree they earned). Data comes from the series of Who's Who available through the Integrated Information System on Modern and Contemporary Characters (IISMCC) hosted by the Academia Sinica’s Institute of Modern History. The tables used for building the graphs are available in the "Tables" Section. The graphs reveal that the humanities (foreign languages, education, law, journalism, political science) clearly dominated the educational choices of these "Americanized" Chinese. Medical studies came next due to the overwhelming representation of physicians in the club.
|
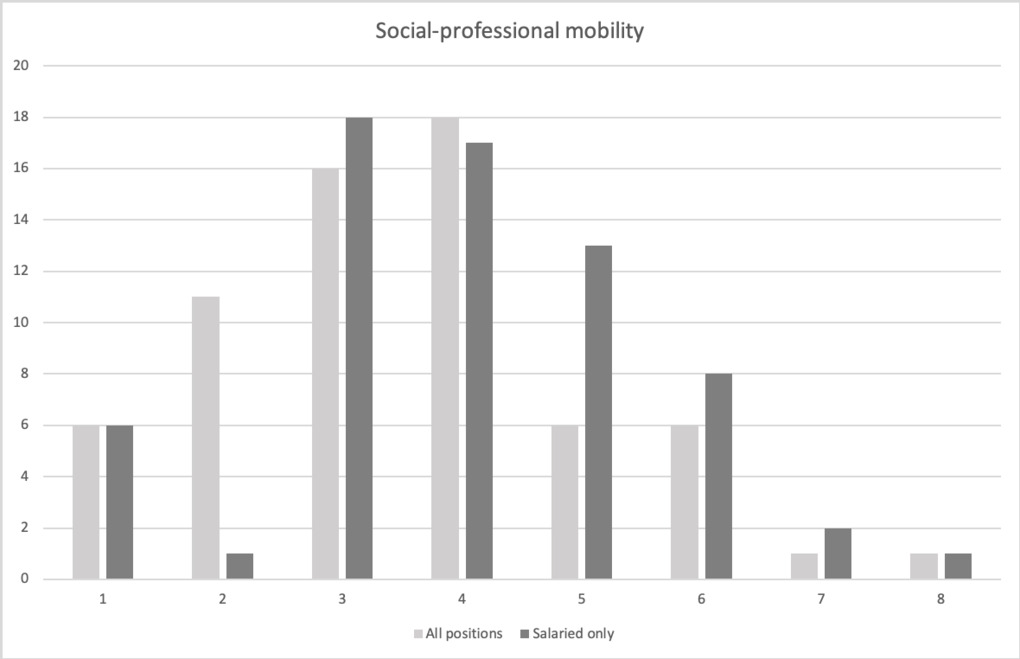 | 396 | Chinese Rotarians: Social-professional mobility | The attached graphs aim to examine the social-professional mobility of Chinese Rotarians. The two first graphs show the number of positions (salaried and not salaried) they took during their professional career. The last one examine theit mobility across various sectors of activity (number of positions taken in different sectors of activity). Data comes from the series of Who's Who available through the Integrated Information System on Modern and Contemporary Characters (IISMCC) hosted by the Academia Sinica’s Institute of Modern History. The tables used for building the graphs are available in the "Tables" Section. Overal, Chinese Rotarians demonstrated a high degree of social-professsional mobility, holding multiple positions across a wide range of sectors. The total number of positions (salaried or not) ranged from 1 to 65. Most of them (26 individuals, 39%) hold at least ten and up to twenty positions during their career. The next most important group hold between twenty and thirty positions (14 individuals, 21%). Thirteen members hold more than thirty positions, among whom six took more fifty positions (names) and two over sixty (names). We recorded less than ten positions for twelve Rotarians. Based on our classification of institutions into eleven sectors of activity (associations, private company, government, hospital, international organizations, church, army, court, political party, other), we observe that Chinese Rotarians also demonstrated a high degree of inter-professional mobility, with forty-eight members (72%) working across three to five sectors of activity. Eleven Rotarians (11%) served in more than five and up to eight different categories of institutions over their entire career. |
 | 397 | Chinese Rotarians: Institutional affiliation | The attached graphs examine the institutions that employed Chinese Rotarians. Data comes from the series of Who's Who available through the Integrated Information System on Modern and Contemporary Characters (IISMCC) hosted by the Academia Sinica’s Institute of Modern History. The tables used for building the graphs are available in the "Tables" Section. For analytical purposes, we classified the institutions into eleven categories (sorted by decreasing order of importance) (cf. graph) : associations (221 positions, 29%), private company (118, 15%), government and hospital (45, 6% each), international organizations (17, 2%), church (10, 1%), army (9, 1%), court (6, 1%), and other (6 positions, 1%), including political party (2 positions, less than 1%). Based on this classification, we observe that associations were by far the best represented category, followed private companies, universities, government and hospitals. Except for associations, the distribution reflects the professional composition of the population of Chinese Rotarians we described earlier. While any Rotarian from any profession could hold positions in private companies (as owners, board members or managers), serve in the government (either as ministers, technical advisers or members of commission) or teach in universities, positions in hospitals reflect more specifically the prominence of medical practitioners in the club. International organizations referred mostly to diplomats, but also to Rotarians who attended international conferences, such as the Peace Conference in Versailles (1919-20) or the Washington disarmament conference (1921), as government official delegates or technical advisers. This suggests that the freshly established Republican government was eager to capitalize on foreign-trained elites because of their superior linguistic skills. Positions in the army referred to senior Rotarians who were old enough to participate in the Revolution (1911) or later served in the Nationalist Army, especially during the Northern Expedition (1926-27). Military positions often combined with political responsibilities as provincial governors. Positions in court applied exclusively to lawyers or graduates in law. That only two Rotarians were affiliated to political parties is hardly surprising. Indeed, Americanized Chinese were known for being politically more conservative than their counterparts educated in China, Japan or Europe (especially France). In addition, this perfectly fitted with Rotary’s principle of political neutrality.The two occurrences of political affiliation referred to membership in the Tongmenhui (early revolutionary party) or in the Nationalist Guomindang. There were no Communists among Rotarians, but this reflects a more general trend among American-educated elites in China.
|
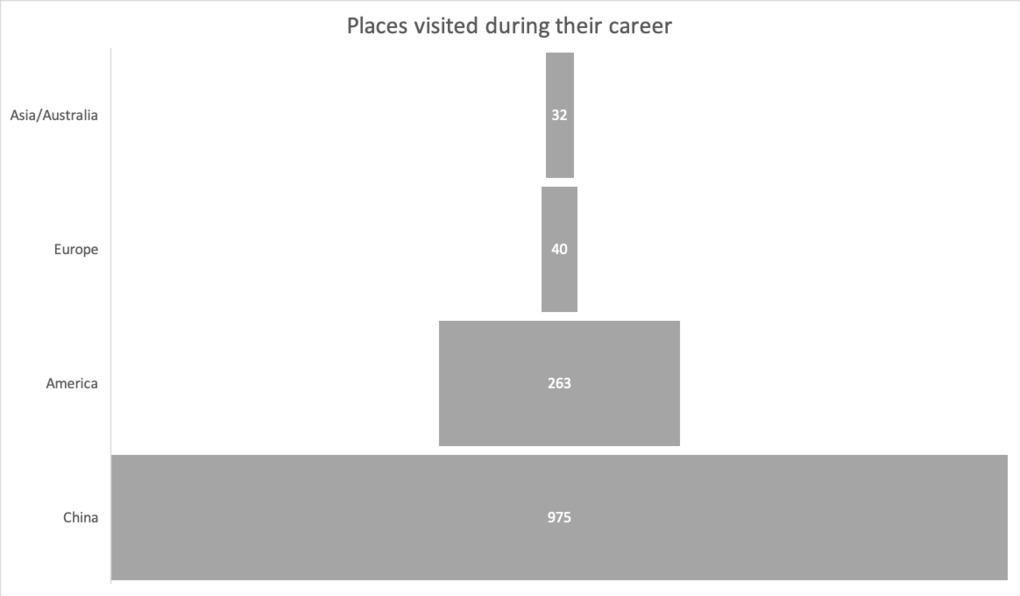 | 398 | Chinese Rotarians: Geographical mobility | The attached graphs aim to examine the geographical mobility of Chinese Rotarians based on the number of different places their visited during their life. Data comes from the series of Who's Who available through the Integrated Information System on Modern and Contemporary Characters (IISMCC) hosted by the Academia Sinica’s Institute of Modern History. The tables used for building the graphs are available in the "Tables" Section. From the graphs, we observe that Chinese Rotarians showed a high degree of geographical mobility during their life, which reflects their multilingual proficiency and their multicultural identity, rooted in their education abroad and for some of them, their overseas background. They traveled a lot not only in foreign countries but also in China proper. Of a total 1310 different places visited by 66 individuals, 75% were located in China (975), 20% (263) in North America (the United States, including Hawaii, and Canada), 40 in Europe, 32 in Asia or Australia (2). Most of them moved from their native place at an early age. Among the most mobile Rotarians, eight worked or lived in over ten different places, and twenty-seven individuals visited from five to ten places.
|
 | 399 | Chinese Rotarian officers: number and level of offices | The following graphs examine the number and level of offices that Chinese Rotarians took in the service of the club. We distinguished three main level of service (from bottom to top): committee, board and Rotary International. The two first graphs offer two different ways of visualizing the number of offices taken in relation to the number of officers (graph line and funnel). The third one shows the distribution of offices across the various levels of service while the fourth one examines in more detail the nature of positions. The last graph ranks the top Chinese Rotarian officers based on their respective number of positions in the club. Original data comes principally from Rotary International archives and the table we built for conducting the statistical analyses are available in the "Tables" section. Relying on the rosters and lists of officers available in Rotary archives, we identified 69 Chinese Rotarians who held 266 positions in the club between 1920 and 1948. While the majority (35) served at the committee level only, twenty-eight members took higher positions as officers or board members, and six were appointed to supreme positions in the organization as Chinese representatives of Rotary International (RI) in Chicago, Ill. Early Chinese members took high positions as officers prior to 1930. The first Chinese treasurer was elected in 1920 (Y.C. Tong), the first vice-president in 1926 (Fonc F. Sec), and the first president in 1927 (Luther M. Jee). The level of position increased in the 1930s, with three Chinese presidents elected: Fong F. Sec (1931-2), Percy Chu (1934-5) and W.H. Tan (1937-8). Mid-level positions as committee members also boomed during these years, which means that although all Chinese Rotarians could not reach the highest ranks, a growing number of ordinary members became more actively involved in the life of the club. Individually, forty-seven officers totaled less than five positions, thirteen between five to ten, and four over ten (cf. table 2). Fong Sec ranked first with twenty-seven positions, followed by Percy Kwok (17), Percy Chu (16) and L.M. Jee (10) (cf table 3). There was a strong correlation between the number and the level of positions taken (cf. table 4). Thirty-four Rotarians held sixty-six positions as board members, some of them being reelected for two or more successive years: Percy Chu (1928-35), Fong Sec (1926-35), T.K. Ho (1925-1938), Habin Jsu (1924-6), Percy Kwok (1931-5), V.F. Lam (1925-31), H.C. Mei (1933-35), S.D. Ren (1923, 1935). Four Chinese served as treasurer (10 positions), three of them being reelected three times to that position (K.P. Chen, Percy Chu and V.F. Lam). Over its entire existence (1919-52), the Rotary Club of Shanghai elected five Chinese presidents. Three of them topped the list of the twelve most active officers in the history of the club (L.M. Jee, Fong Sec and Percy Chu). In addition to the four presidents already mentioned (Jee, Fong, Chu, Tan), William Sung was elected the year before the club ceased functioning during the war (1941). He was reelected to that position when the club was reorganized in November 1945. Fong and Chu had previously served as vice-president (Fong in 1926 and 1928, Percy Chu in 1930-1931). The latter also became sergeant-at-arms after retiring as president in 1935. Four presidents were appointed to international positions in the organization. In 1922, Fong was sent as the first Chinese delegate to the Annual Convention of Rotary International (RI) in Los Angeles. He was later elected member of the board of directors of Rotary International (1932-4) and district governor for two consecutive years (1936-8). L.M. Jee was appointed commissioner of Rotary International in China for three consecutive years (1927-30). Although he never took positions in the Rotary Club of Shanghai itself, C.T. Wang was also appointed commissioner of Rotary International and first district governor when the 81st district (covering China and the Philippines) was officially established in 1935. As such, he was specifically in charge of arranging the Annual Convention of Rotary International that took place for the first time in China (Shanghai) in April 1936. During the war, he served as RI advisor to China (1942-6) and was elected board member (1944-6) and even vice-president of Rotary International (1945-6). In the postwar years, he was again appointed district governor (1946-7, 1948-9) and RI advisor for China, Hongkong and Macao (1951-3). W.H. Tan also acted as district governor (1940-1, 1947-8) and governor’s representative (1942) in the war and postwar years. William Sung served briefly as acting district governor in 1941.
|
 | 400 | Chinese Rotarians: Service in committees | The following graphs examine in detail the responsibilities that Chinese Rotarians took in the various committees of the club, using various visualization techniques (bar charts, tree maps). Original data comes principally from Rotary International archives and their tabulation is available in the "Tables" section. The graphs reveal that Chinese Rotarians served primarily in the Charities and Community Service committees (21), followed by Fellowship (18), Schools and Education (17) and Public Affairs (15). Thirteen Chinese were involved in the Rotary Extension committee, which played a crucial role in the formation of new Rotary clubs in China. Chinese Rotarians were also well-represented in the International Service committee (in charge of relations with Rotary International) and the Finance committee (responsible for the budget of the club), with 12 positions each. The prominence of Chinese members in the Finance committee reflected more generally the weight of Chinese bankers and financiers in the club. The Boy’s Work committee also ranked high despite its foreign origins. Chinese Rotarians who were concurrently involved in the Y.M.C.A movement often served in this committee. Chinese members were less involved in committees dealing with the internal affairs of the club (club service, business ethics, membership and classification, attendance), which represented less than ten positions each.
|
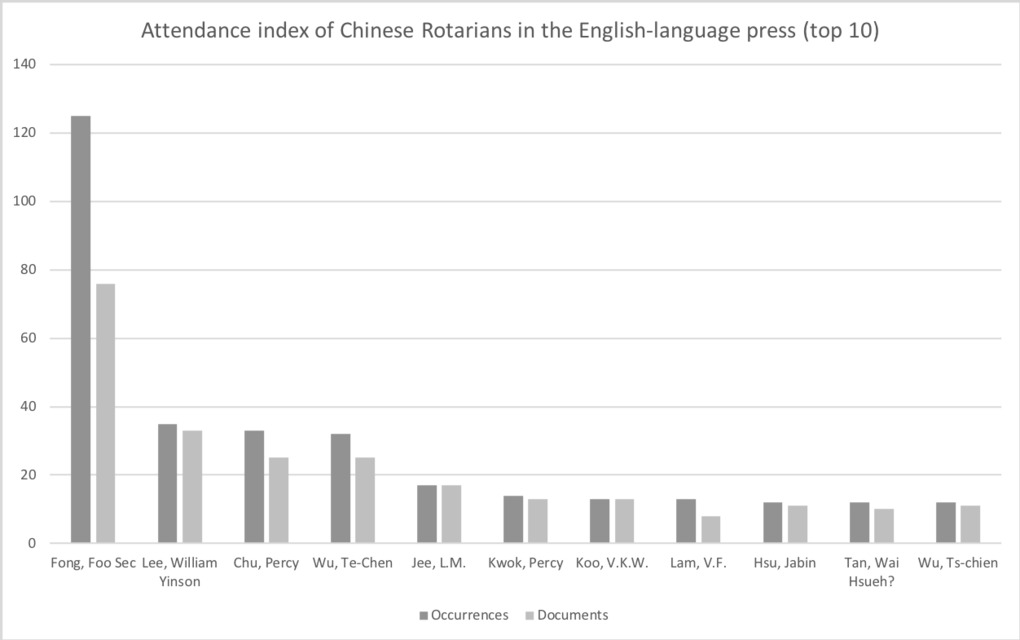 | 404 | Chinese Rotarians: Activity index | The following graphs aim to examine Chinese Rotarians‘ varying degree of involvement in the club, based on their presence in newspaper reports of Rotary meetings. The tabulated data we used for obtaining the graphs is available in the "Tables" section. Our method for measuring the degree of participation into the club consisted in three steps:
The two first graphs show the top 10 and 20 Rotarians mentioned in the press, ranked by decreasing number of occurrences. The two additional graphs retain ambiguous cases, providing a confidence index for ranking the same individuals (top 15 and 20). Building on this activity index, three major groups emerged: eleven “highly active” Rotarians (over 10 occurrences, with Fong Sec. leading far ahead with 75 occurrences), eight “moderately active” (5 to 10), and twenty-two “less active” members (under 5 occurrences). We should add to this list the 67 members who never appeared in newspapers and therefore can be considered as “inactive” or “invisible” members. Unsurprisingly, the varying degree of activity is directly correlated to their service in the club, i.e. the number of and the level of positions they took in Rotary. The index partly reflects the roles that members were expected to play according to the by-laws. For instance, the president was supposed to chair every meeting, and this largely accounts for the high scores of the three presidents Fong, Chu and Jee. The constitution, however, does not explain everything. Our findings reveal irregular cases that point to either discrepancies between the rules and their application, or to inevitable gaps in the available documentation. For instance, president Tan lags far behind less prominent members. Conversely, Wellington Koo, an honorary member who never took any positions in the club and barely attended its regular meetings, nonetheless ranks high on the list. |


- RAW DATA
- COOKED DATA
- NARRATIVES
- REFERENCES
- DATABASES
60 documents
return to data set
Contact us
Cécile Armand Institut d'Asie Orientale ENS de Lyon, Site Descartes 15 Parvis René Descartes 69341 Lyon Cedex 07 France Email: cecile.armand@gmail.com
Around the Web
![]()
![]()
![]()