


 12345
12345 

filter by Title A B C D E F G H I J K L M N O P Q R S T U V W X Y Z [all]
| ID | Title | Description | |
|---|---|---|---|
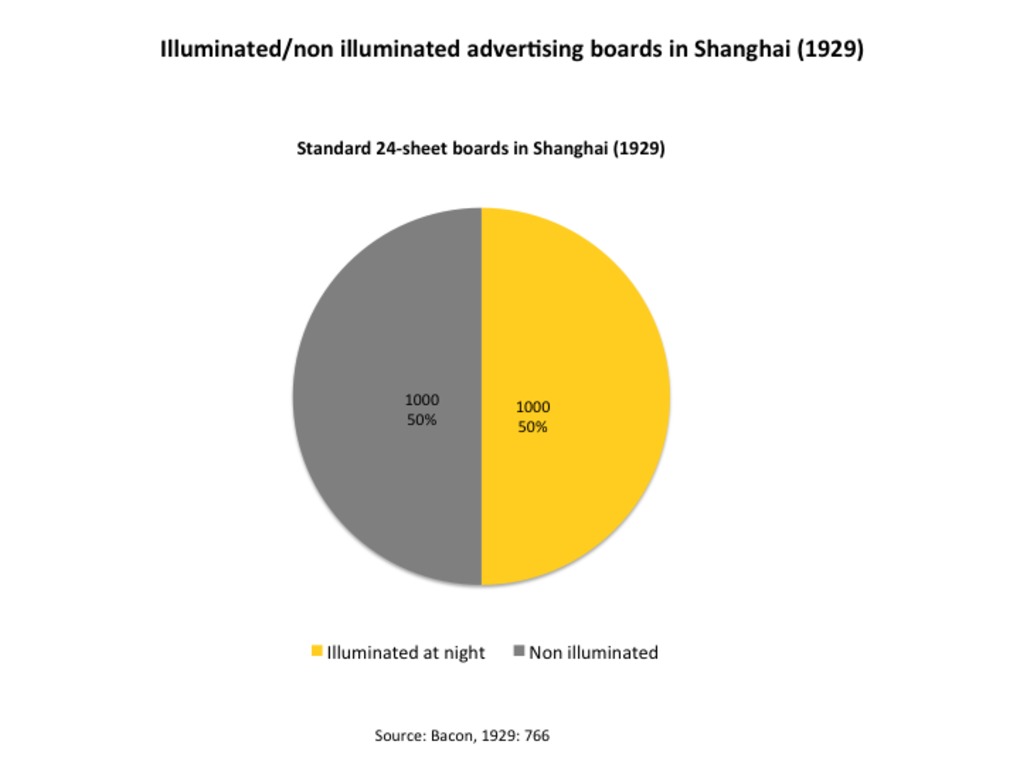 | 306 | 24-sheet boards in Shanghai: Equal distribution between illuminated/non illuminated boards (1929) | This pie charts shows the number and ratio of advertising boards (standard 24-sheet boards) in Shanghai before 1929, according to their illumination status - either illuminated or not. Before the popularization of light in the 1930s, illuminated boards were as numerous are non illuminated boards. This suggests that illumimated structures remains quite expensive for advertisers to build and maintain. Source: Bacon, 1929: 766. |
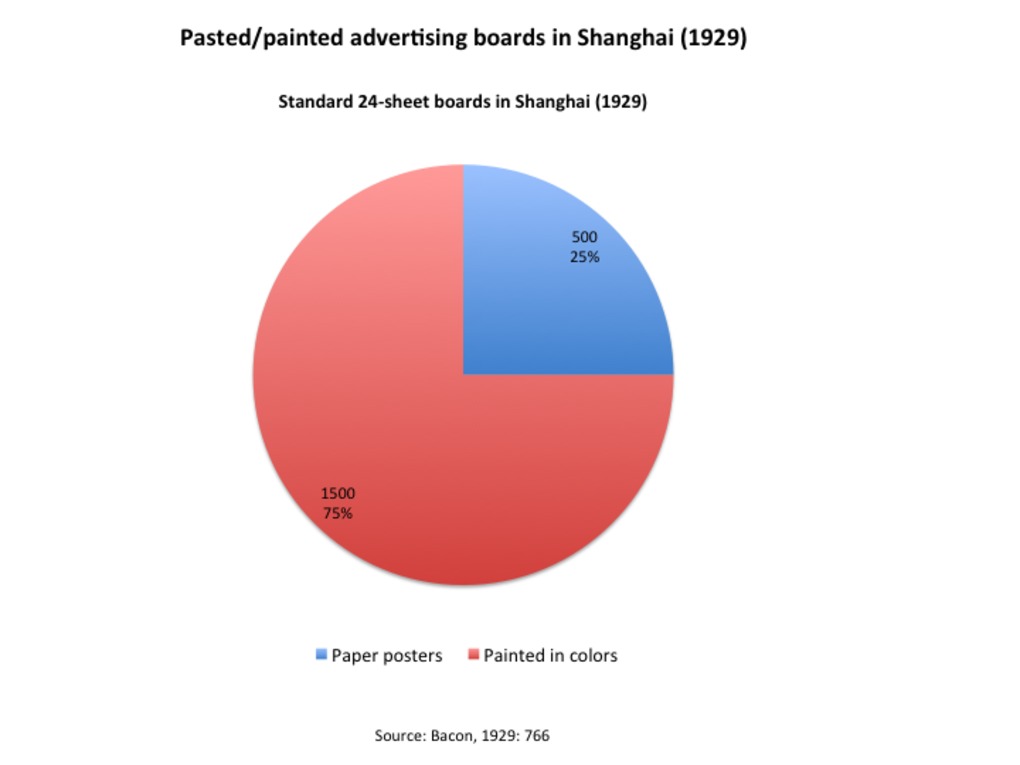 | 305 | 24-sheet boards in Shanghai: Prevailing of color-painted over paper-pasted boards (1929) | This pie charts shows the number and ratio of advertising boards (standard 24-sheet boards) in Shanghai before 1929, according to their materials - either paper/pasted or painted in color. Boards painted in colors clearly prevailed over paper pasted boards at the time. The preference for painted boards may result from their relative material resistance to bad weather and climatic conditions. Source: Bacon, 1929: 766. |
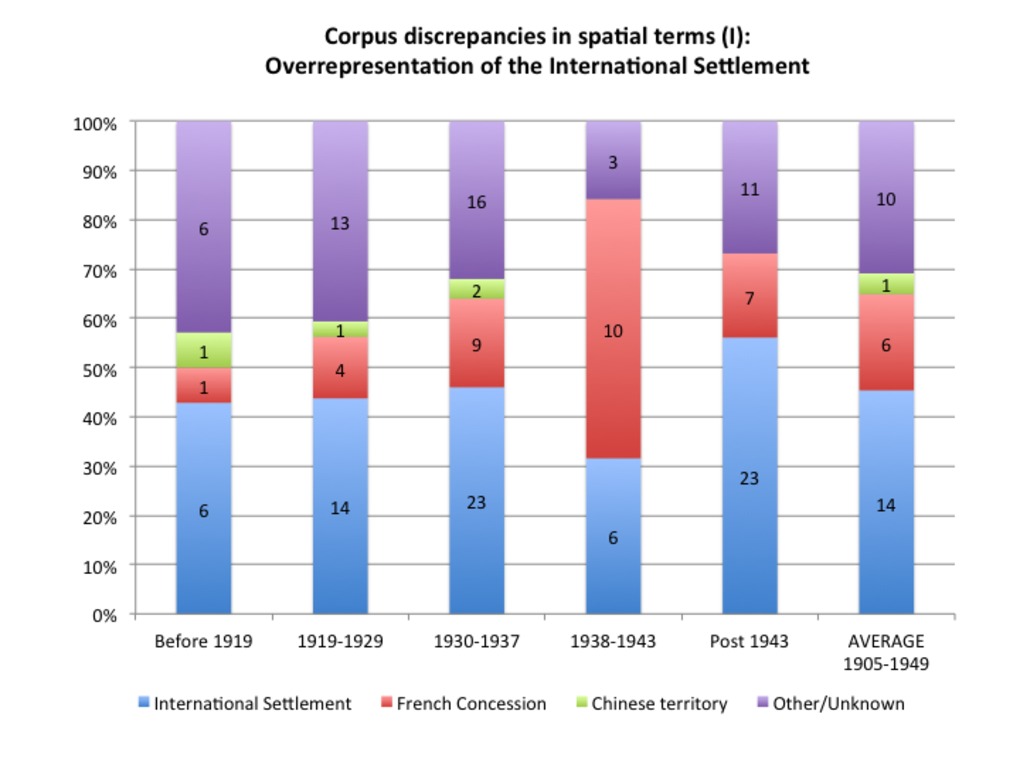 | 312 | A critical view of my photographic corpus (1905-1949): Spatial discrepancies (I): Overrepresentation of the International Settlement | This graph aims to better visualize corpus discrepancies in terms of space - more precisely the overrepration of the International Settlement (compared to French Concession and Chinese territories) depending on timeslices. It also reveals difficulties to attribute precise locations to many photos (especially before the 1930s). This graph has been drawn after the related table (See the "Tables" section - Table 171). |
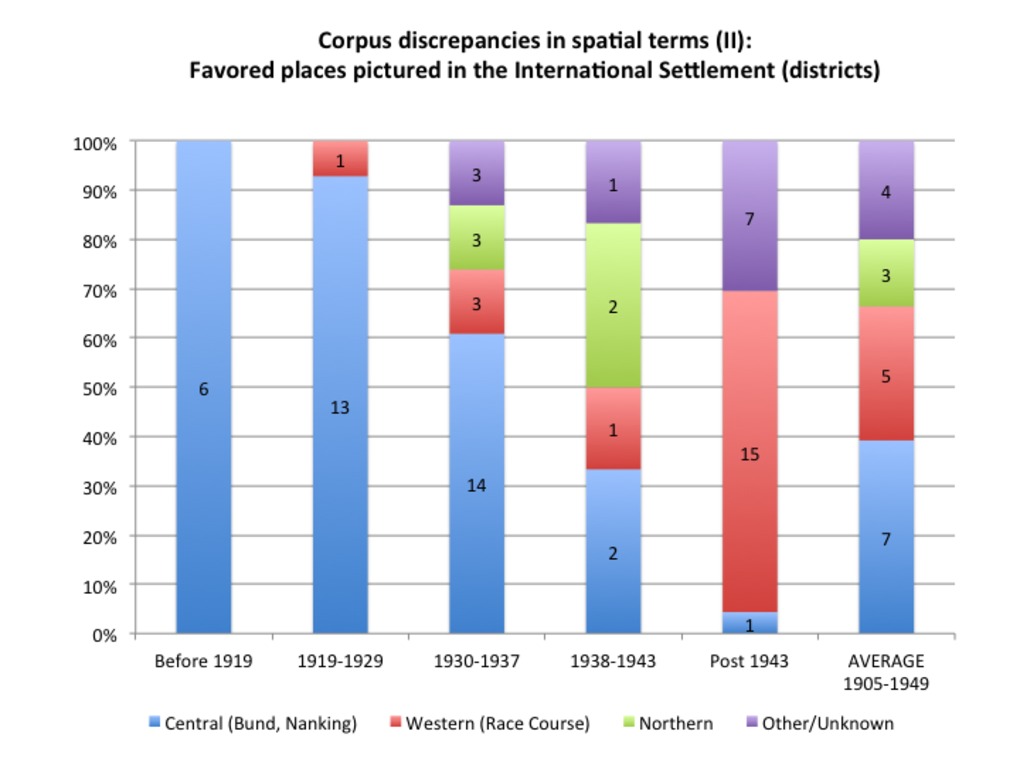 | 313 | A critical view of my photographic corpus (1905-1949): Spatial discrepancies (II): Favored places pictured the International Settlement | This graph aims to better visualize corpus discrepancies in terms of space - more precisely the overrepration of the Central district (Bund, Nanking Road, etc), and to a lesser extent, the Western district (Race Course) in the International Settlement - depending on timeslices. This graph eventually reveals photographic "topoi" or landmarks in Shanghai. It also reflects difficulties to attribute precise locations to many photos (especially before the 1930s). This graph has been drawn after the related table (See the "Tables" section - Table 171). |
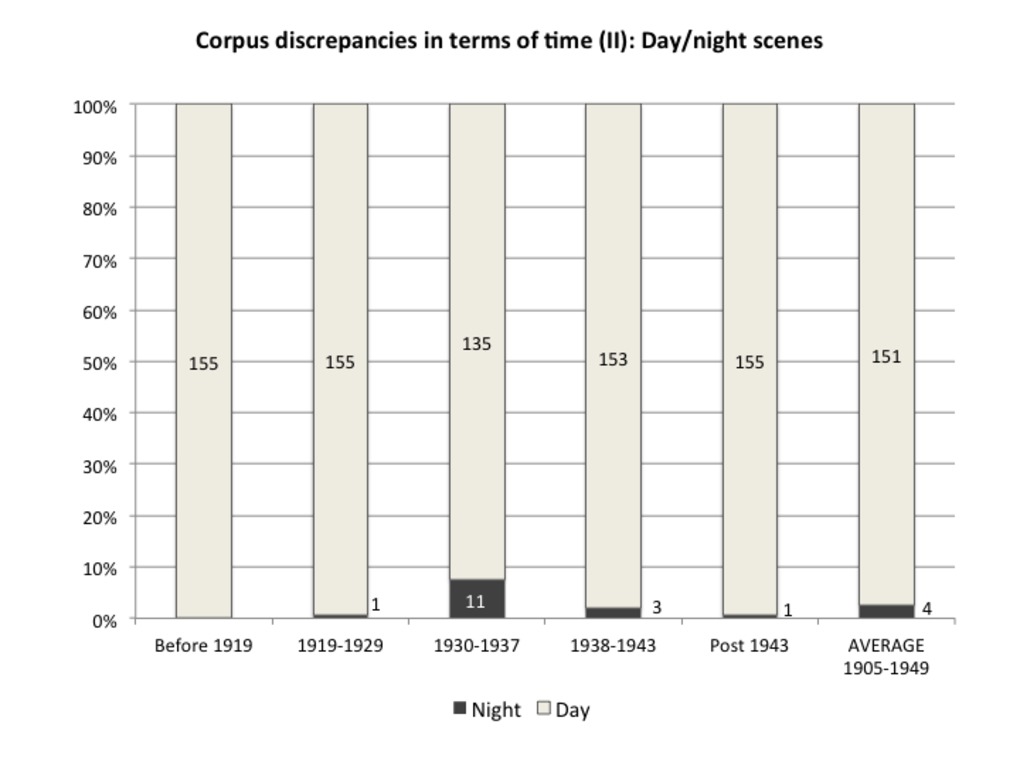 | 311 | A critical view of my photographic corpus (1905-1949): Temporal discrepancies (day/night scenes) | This graph aims to better visualize corpus discrepancies in terms of time - more precisely the uneven distribution between day/night scene, depending on timeslices. This graph been drawn after the related table (See the "Tables" section - Table 171). |
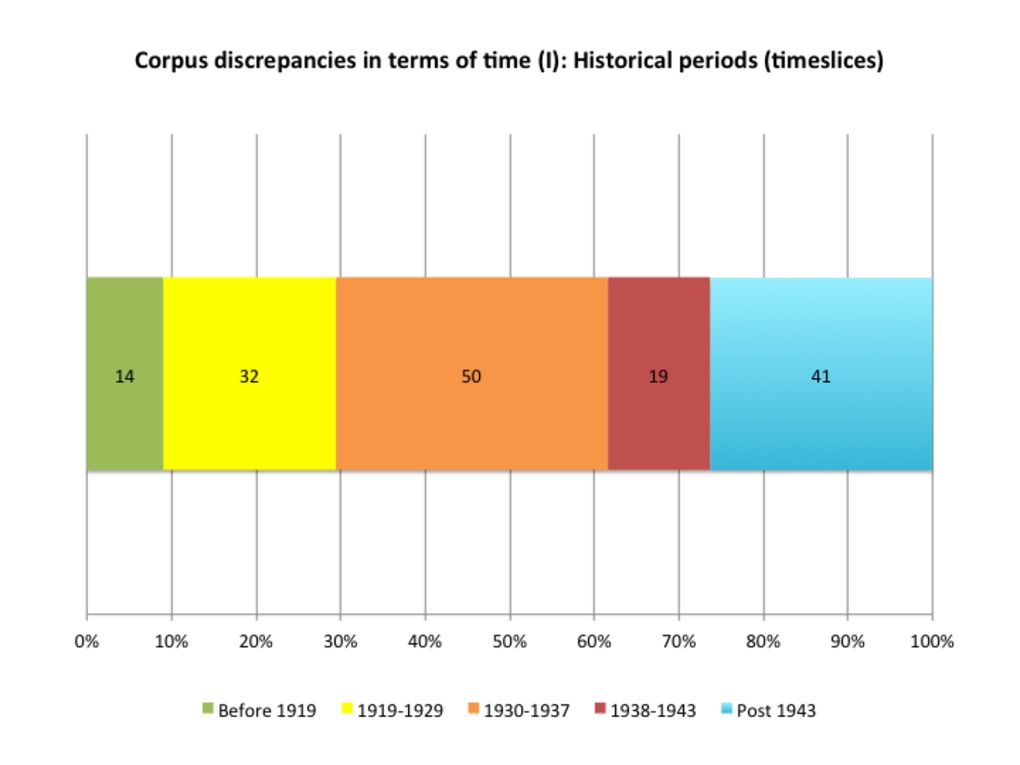 | 310 | A critical view of my photographic corpus (1905-1949): Temporal discrepancies (timeslices) | This graph aims to better visualize corpus discrepancies in terms of time (number and % of photos taken per timeslices). This graph has been drawn after the related table (See the "Tables" section - Table 171). |
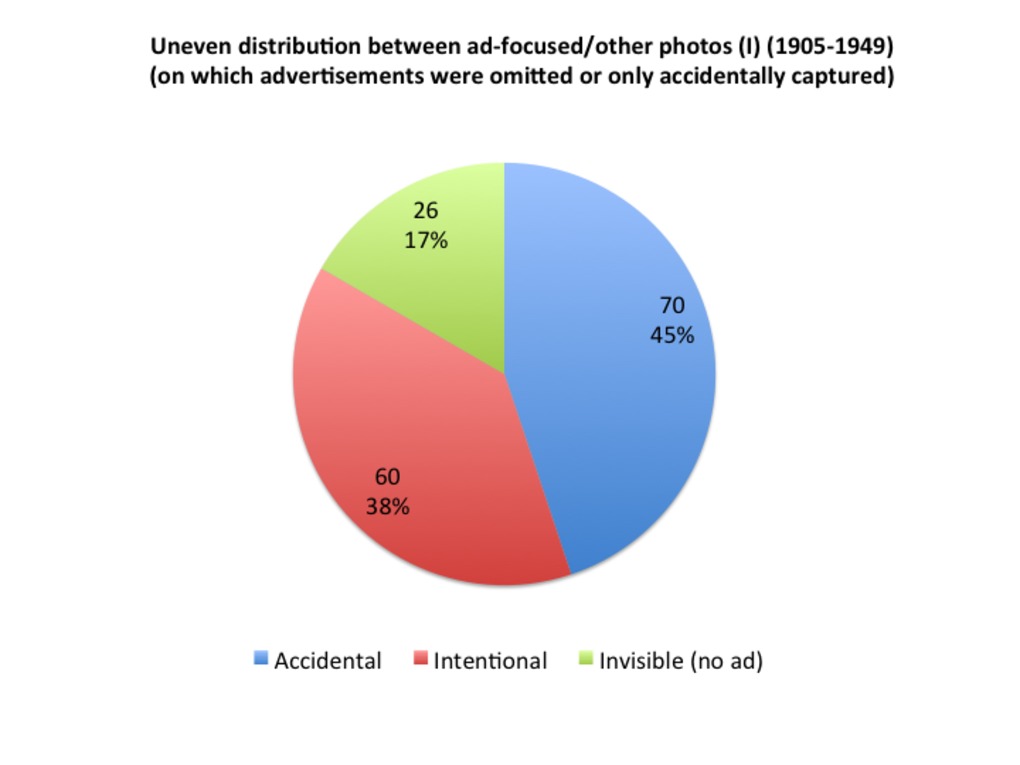 | 314 | A critical view of my photographic corpus (1905-1949): Uneven distribution between ad-focused and other photos (all period included) | This graph aims to better visualize the uneven distribution between ad-focused photos (photos that took advertisements as their intentional targets) (in red) and other photos (on which advertisements were either omitted or only accidentally captured). This graph has been drawn after the related table (See the "Tables" section - Table 171). |
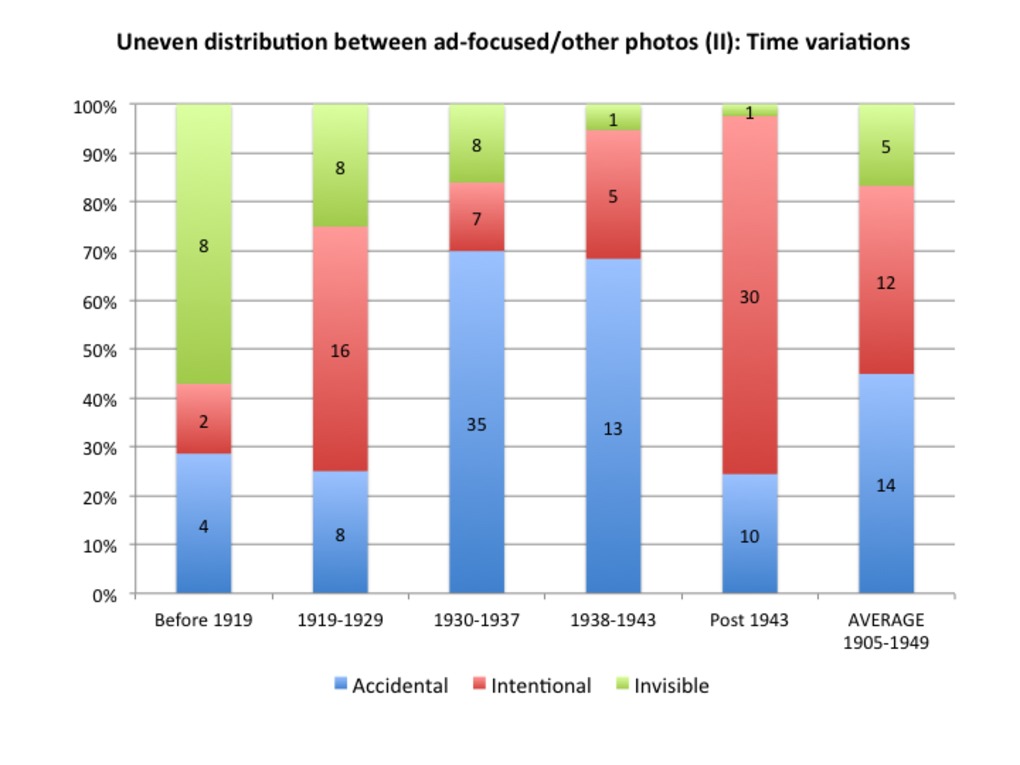 | 315 | A critical view of my photographic corpus (1905-1949): Uneven distribution between ad-focused and other photos (time variations) | This graph offered a refined view of the uneven distribution between ad-focused photos (photos that took advertisements as their intentional targets) (in red) and other photos (on which advertisements were either omitted or only accidentally captured), taking the time period into account. This graph reveals an increased advertising awareness at the end of the period - or more exactly, that professional photographers who chose advertisements as their intentional target were concentrated in the 1940s. This graph has been drawn after the related table (See the "Tables" section - Table 171). |
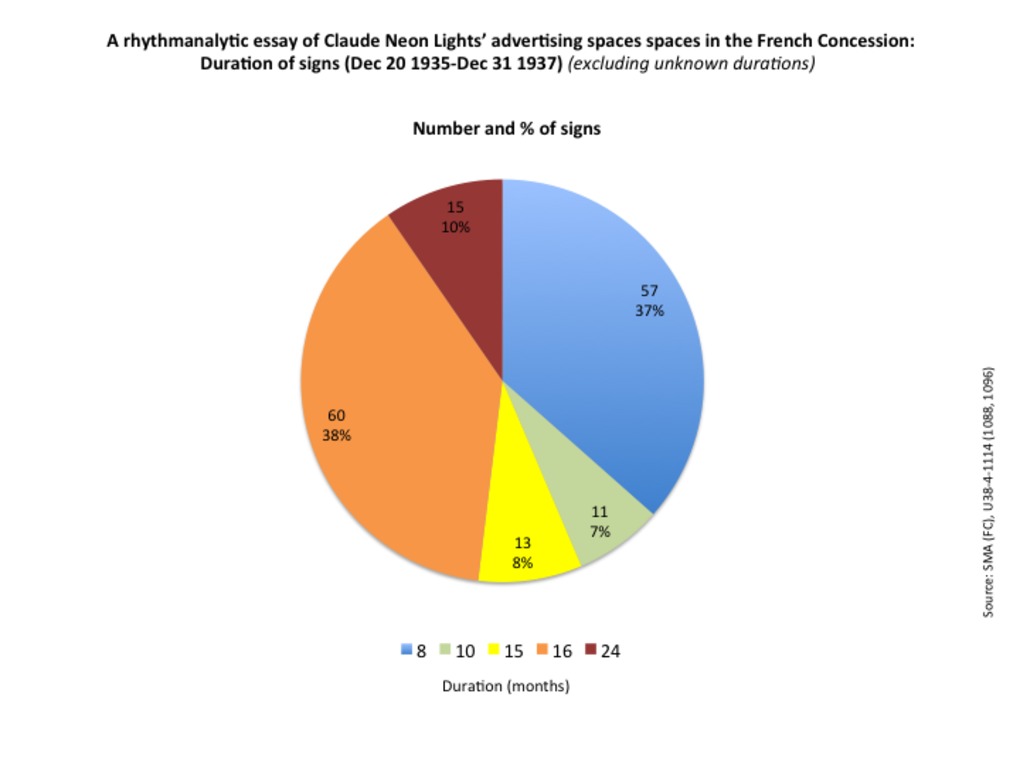 | 272 | A rhythmanalytic essay of Claude Neon Lights’ advertising spaces spaces in the French Concession: Duration of signs (Dec 20 1935-Dec 31 1937) | These set of three charts aims to evaluate the lifetime of Claude Neon Lights' signs in the French Concession between Dec 20, 1935 and Dec 31, 1937. The figures are based on the regular lists of signs that Claude Neon Lights sent to the French Municipal Council between December, 20 1935 and December, 31 1937, plus a few scattered signs recorded in other files in the Shanghai Municipal Archives (French concession and International Settlement in 1931 and 1941). Source: SMA (FC), U38-4-1114; SMA (SMC), U1-14-3261 (0246). The first pie chart ignores the boards for which we do not know the date of removal or end of contract. The second pie chart includes those under-documented artifacts (48%). The last bar charts compare the average, minimal, and maximal duration of contracts. Both pie charts reveal that Claude Neon Lights' signs enjoyed a longer lifetime than Oriental Advertising's boards in 1914. While the latter had lived for less than a year, 66% of the former lasted more than one year, 10% of which had lived for at least 2 years. This temporal lag may be due to the nature of the medium (boards being more temporary than signs, attached to a shop or a building), as well as the relative period of prosperity in the 1930 (in contrast with the war period). Yet it remains questionable to compare figures based on documentation of variable quality and length. |
 | 273 | A rhythmanalytic essay of Claude Neon Lights’ advertising spaces spaces in the French Concession: Duration of contracts/occupation of signs by advertisers (Dec 20 1935-Dec 31 1937) | These set of three charts aims to evaluate the duration of Claude Neon Lights' contracts with various clients in the French Concession between Dec 20, 1935 and Dec 31, 1937. The figures are based on the regular lists of signs that Claude Neon Lights sent to the French Municipal Council between December, 20 1935 and December, 31 1937, plus a few scattered signs recorded in other files in the Shanghai Municipal Archives (French concession and International Settlement in 1931 and 1941). Source: SMA (FC), U38-4-1114; SMA (SMC), U1-14-3261 (0246). The first pie chart ignores the boards for which we do not know the date of removal or end of contract. The second bar chart show the average, minimal and maximal duractions of contracts.
|
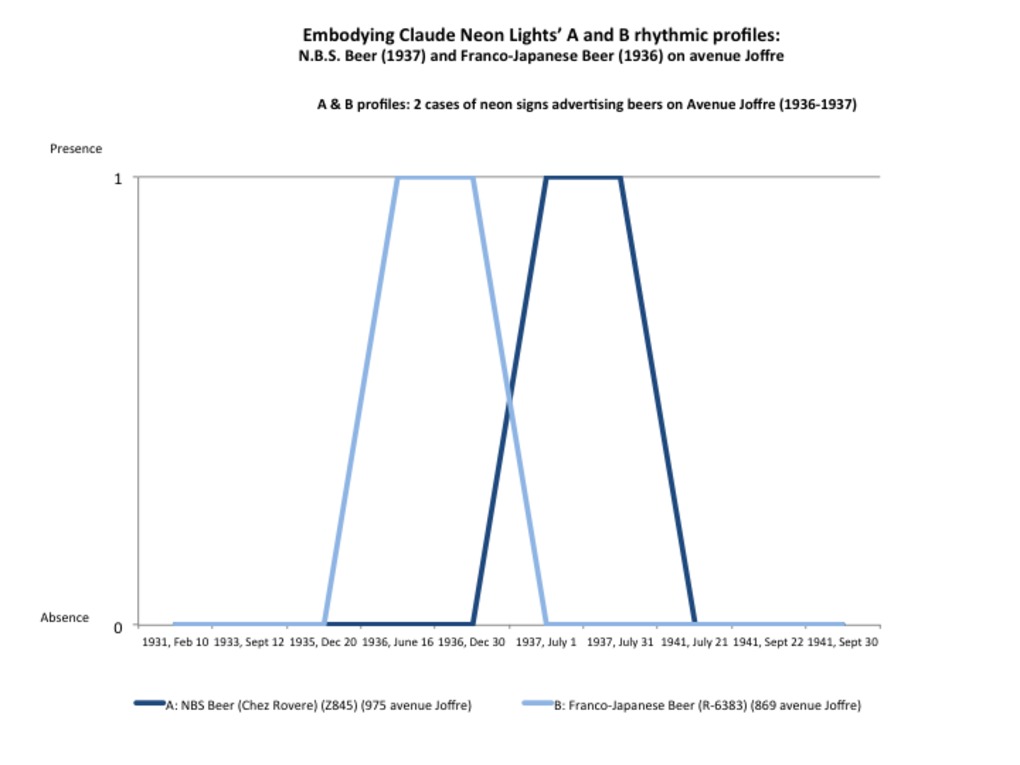 | 277 | A rhythmanalytic essay of Claude Neon Lights’ signs: Embodying the A, B, D, F and H rhythmic profiles (1935-1937) | In order to re-embody to figure and abstract typology of rhythms, this set of graphs aims to trace the lifetime a well-identified sign for each rhythmic profile as described in the related table (see "Related Document"). This set of five graphs precisely aim to embody the profiles with a single advertiser - namely A, B, D, F and H. The measurements are based on the regular lists of signs that Claude Neon Lights sent to the French Municipal Council between December, 20 1935 and December, 31 1937, plus a few scattered signs recorded in other files in the Shanghai Municipal Archives (French concession and International Settlement in 1931 and 1941). Source: SMA (FC), U38-4-1114; SMA (SMC), U1-14-3261 (0246). |
 | 278 | A rhythmanalytic essay of Claude Neon Lights’ signs: Embodying the G, I and J rhythmic profiles (1935-1937) | In order to re-embody to figure and abstract typology of rhythms, this set of graphs aims to trace the lifetime a well-identified sign for each rhythmic profile as described in the related table (see "Related Document"). This set of five graphs precisely aim to embody the profiles with a two or more advertisers - namely G, I and J. The measurements are based on the regular lists of signs that Claude Neon Lights sent to the French Municipal Council between December, 20 1935 and December, 31 1937, plus a few scattered signs recorded in other files in the Shanghai Municipal Archives (French concession and International Settlement in 1931 and 1941). Source: SMA (FC), U38-4-1114; SMA (SMC), U1-14-3261 (0246). |
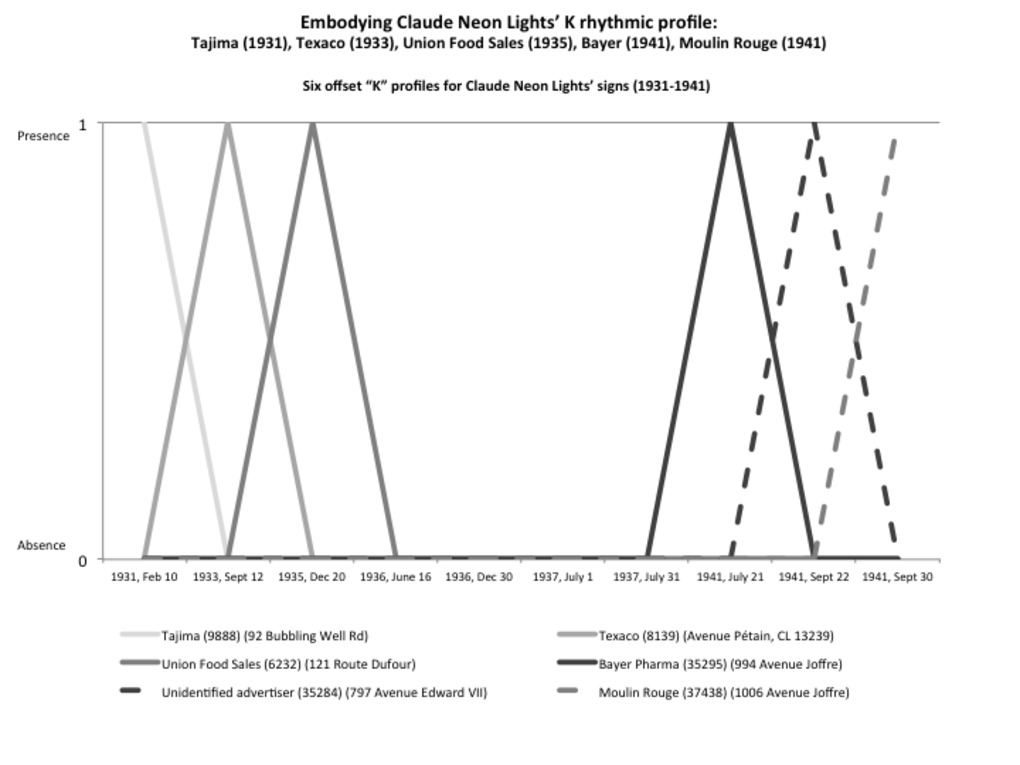 | 276 | A rhythmanalytic essay of Claude Neon Lights’ signs: Embodying the K rhythmic profile (1931-1941) | In order to re-embody to figure and abstract typology of rhythms, this set of graphs aims to trace the lifetime a well-identified sign for each rhythmic profile as described in the related table (see "Related Document"). On this graph, five case studies have been selected to embody the "K" profile (unknown duration). The measurements are based on the regular lists of signs that Claude Neon Lights sent to the French Municipal Council between December, 20 1935 and December, 31 1937, plus a few scattered signs recorded in other files in the Shanghai Municipal Archives (French concession and International Settlement in 1931 and 1941). Source: SMA (FC), U38-4-1114; SMA (SMC), U1-14-3261 (0246). |
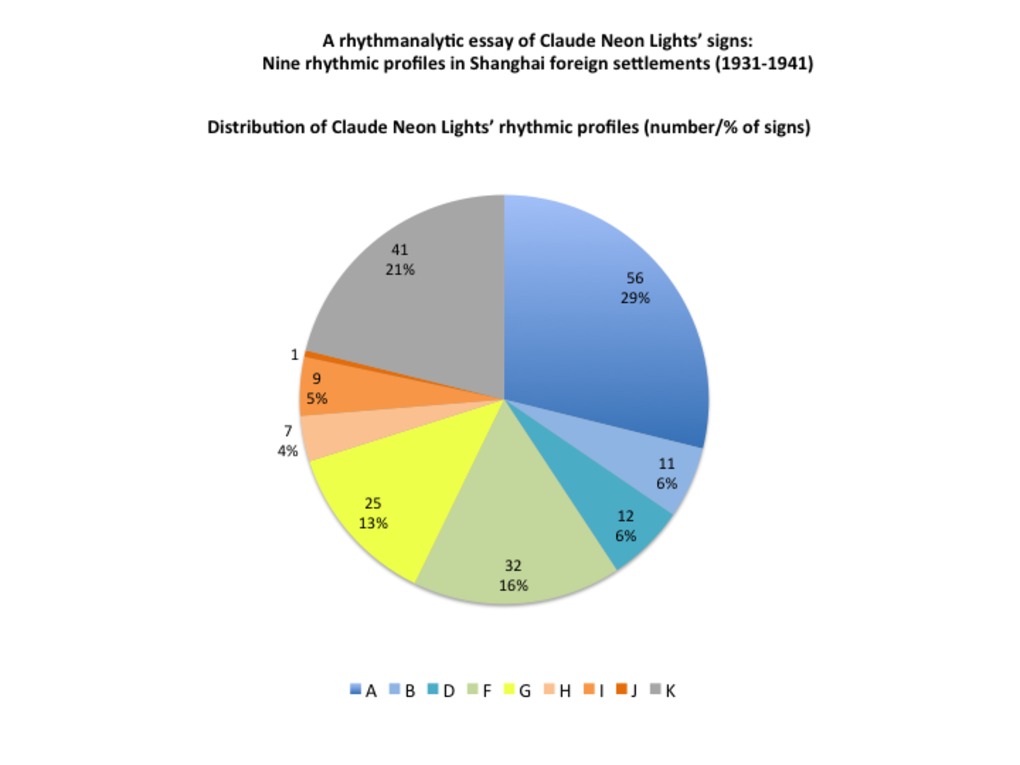 | 275 | A rhythmanalytic essay of Claude Neon Lights’ signs: Nine rhythmic profiles in Shanghai foreign settlements (1931-1941) | This table and the related pie aims to further refine the rhythmanalysis based on signs or advertisers' duraction by combining signs duration and the number of advertisers they respectfully hosted. Such combination has resulted in establishing nine rythmic profiles, noted by a letter from A to K (unknown). The typology is explained in the table, and the share occupied by each rhythmic profile is measured on the pie chart.
The pie chart shows that signs that enjoyed the shortest lifetime with a single advertiser lead the way (almost 30%), followed by longer signs with a single advertiser as well. Signs hosting two or more advertisers represent only a small minority, and the longer, the fewer (13% for shorter signs, and less than 10% for the longest signs). The measurements are based on the regular lists of signs that Claude Neon Lights sent to the French Municipal Council between December, 20 1935 and December, 31 1937, plus a few scattered signs recorded in other files in the Shanghai Municipal Archives (French concession and International Settlement in 1931 and 1941). Source: SMA (FC), U38-4-1114; SMA (SMC), U1-14-3261 (0246). |
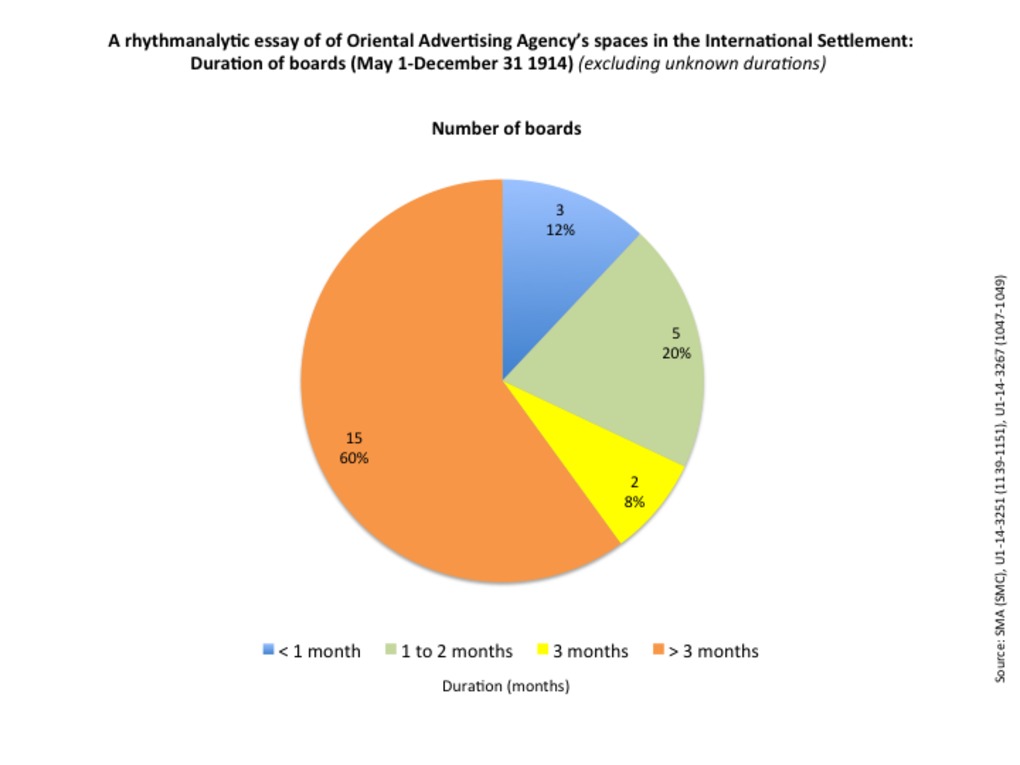 | 262 | A rhythmanalytic essay of Oriental Advertising Agency’s spaces in the International Settlement: Duration of boards (May 1-December 31 1914) | These set of three charts aims to evaluate the lifetimes of Oriental Advertising's boards in the International Settlement during the year 1914. The figure are based on the the census made by the S.M.C. in 1914 and the regular inventories of boards that Oriental Advertising Agency's sent to the Council between May 1 and December 31, 1914. Source: SMA (SMC), U1-14-3251 (1139-1151), U1-14-3267 (1047-1049). The first pie chart ignores the boards for which we do not know the date of removal or end of contract. The second pie chart includes those under-documented artifacts (63%). Both pie charts reveal that despite the war, longer contracts (more than three months) tend to dominate (60%, 22%), followed by contracts between 1 to 2 months (20%, 7%), less than one month (12%, 5%) and eventually three-month contracts (8%, 3%). The last bart chart indicates the average duration of contracts (92 days, about 3 months). Beyond this average figure, it reveals strong gaps between the maximal (153 days) and minimal durations (19 days). |
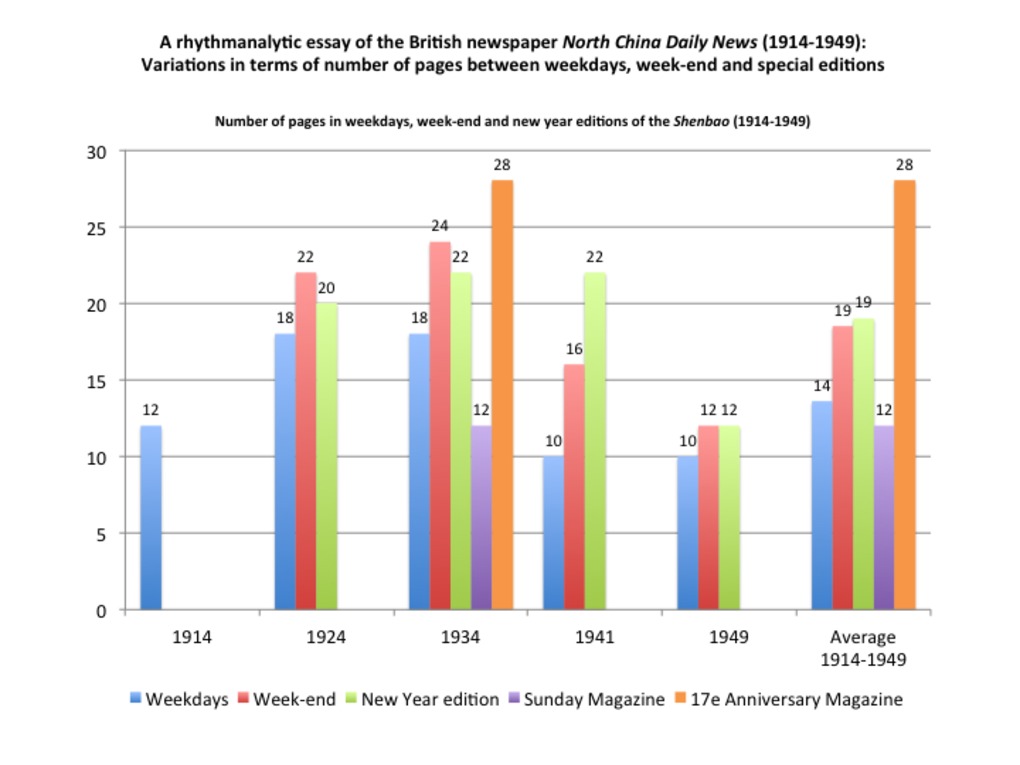 | 281 | A rhythmanalytic essay of the British newspaper North China Daily news: three ways of measuring variations between weekdays, week-end and special editions (1914-1949) | This set of three bar charts aims to compare weekdays, week-end and special editions (New Year) of the Biriths newspaper North China Daily News between 1914 and 1949. My purpose here is to identify variations in the material dimensions of the newspaper and its advertising spaces. For that very purpose, our five usual samples (Jan 7, 1914, Jan 3 1924, Jan , 1934, Feb 1, 1941, Jan 1, 1949) have been contrasted to week-end and special editions published more or less at the same time. The list of selected samples is provided in the associated table (see the "Tables" section). In each sample issue, we have then measured the three following criteria, directly borrowed from the first and second chapters of my dissertation: number of pages in the issue, advertsing population (number of advertisements in the same issue), advertising area (precisely, the maximal area covered by a single advertisement, on a scale ranging from 0, for subdistricts covering less than 10% of the page, to 4, refering to advertising "empires", i.e. full-page advertisements). The first set of bar charts aims to measure variations in terms of number of pages between weekdays (in blue), week-end (red), New Year editions (green), 1930s Sunday magazine (orange) and special Anniversary magazine (purple) in the 1930s. The second bar charts does the same in terms of advertising population, while the third and last graph proceeds in a similar fashion for measuring advertising areas. These graphs reveal two main findings: (1) While there are no obvious differences between weekdays and week-end or special editions at early times (1914) - especially in the North China Daily News (NCDN), which was not published on Sundays, and whose New Year edition is not available that year - and very slight variations at the end of the period (1941-1949), the strongest contrasts are to be found in the 1920-1930s editions, especially in Chinese newspaper Shenbao, whose number of pages more than doubled in New Year editons (Jan 1 1924 and 1934). (2) The number of pages and advertisements are more subject to variations than advertising areas, which usually remained the same, except for New Year editions which are more encouraging to full-page advertisements, especially in the 1930s. By juxtaposing the graphs of the Chinese and British newspapers, two further observations shall be made: (3) The Chinese newspaper Shenbao shows stronger contrasts (between weekdays, week-end and New Year editions) than the British newspaper. Compared to the Chinese newspaper, the NCDN appeared very stable, if not conservative, from one day to another. In 1914 and 1924, it was not published on Sundays (the Sunday edition was probably replaced by its weekly edition, the North China Herald). The sharpest contrasts are to be found in the 1930s, due to the publications of Sunday magazines and special editions (70th Anniversary supplement on July 29, 1934). At the end of the period, (1941-1949), the NCDN appeared more repetitive than ever, probably due to the reduction of expenses and creativity during wartime. (4) Paradoxically, the Chinese newspaper proved more affected by the Western New Year than its British counterpart NCDN. The Chinese editors seemed to have cleverly appropriated the Western tradition as a profitable opportunity for expanding newspaper and advertising spaces. By contrast, the NCDN New Year edition had nothing special. From 1914 to 1949, it appeared quite similar to ordinary editions. |
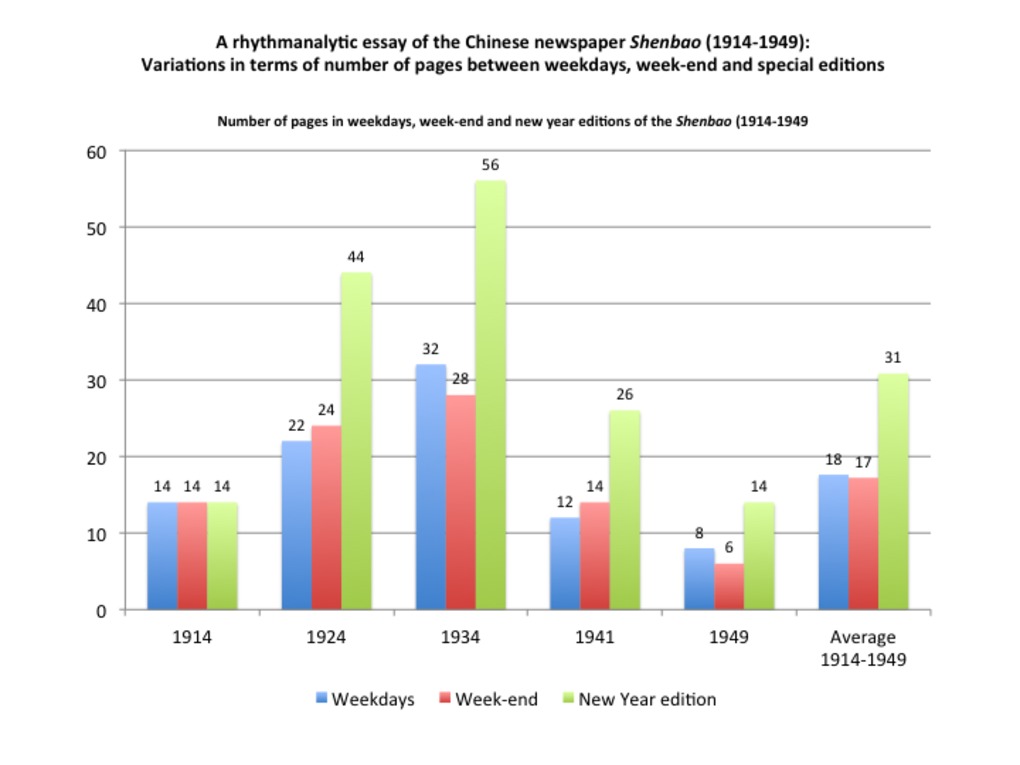 | 280 | A rhythmanalytic essay of the Chinese newspaper Shenbao: three ways of measuring variations between weekdays, week-end and special editions (1914-1949) | This set of three bar charts aims to compare weekdays, week-end and special editions (New Year) of the Chinese newspaper Shenbao between 1914 and 1949. My purpose here is to identify variations in the material dimensions of the newspaper and its advertising spaces. For that very purpose, our five usual samples (Jan 7, 1914, Jan 3 1924, Jan , 1934, Feb 1, 1941, Jan 1, 1949) have been contrasted to week-end and special editions published more or less at the same time. The list of selected samples is provided in the associated table (see the "Tables" section). In each sample issue, we have then measured the three following criteria, directly borrowed from the first and second chapters of my dissertation: number of pages in the issue, advertsing population (number of advertisements in the same issue), advertising area (precisely, the maximal area covered by a single advertisement, on a scale ranging from 0, for subdistricts covering less than 10% of the page, to 4, refering to advertising "empires", i.e. full-page advertisements). The first set of bar charts aims to measure variations in terms of number of pages between weekdays (in blue), week-end (red) and New Year (green) editions. The second bar charts does the same in terms of advertising population, while the third and last graph proceeds in a similar fashion for measuring advertising areas. These graphs reveal two main findings: (1) While there are no obvious differences between weekdays and week-end or special editions at early times (1914) - especially in the North China Daily News (NCDN), which was not published on Sundays, and whose New Year edition is not available that year - and very slight variations at the end of the period (1941-1949), the strongest contrasts are to be found in the 1920-1930s editions, especially in Chinese newspaper Shenbao, whose number of pages more than doubled in New Year editons (Jan 1 1924 and 1934). (2) The number of pages and advertisements are more subject to variations than advertising areas, which usually remained the same, except for New Year editions which are more encouraging to full-page advertisements, especially in the 1930s. By juxtaposing the graphs of the Chinese and British newspapers, two further observations shall be made: (3) The Chinese newspaper Shenbao shows stronger contrasts (between weekdays, week-end and New Year editions) than the British newspaper. Compared to the Chinese newspaper, the NCDN appeared very stable, if not conservative, from one day to another. In 1914 and 1924, it was not published on Sundays (the Sunday edition was probably replaced by its weekly edition, the North China Herald). The sharpest contrasts are to be found in the 1930s, due to the publications of Sunday magazines and special editions (70th Anniversary supplement on July 29, 1934). At the end of the period, (1941-1949), the NCDN appeared more repetitive than ever, probably due to the reduction of expenses and creativity during wartime. (4) Paradoxically, the Chinese newspaper proved more affected by the Western New Year than its British counterpart NCDN. The Chinese editors seemed to have cleverly appropriated the Western tradition as a profitable opportunity for expanding newspaper and advertising spaces. By contrast, the NCDN New Year edition had nothing special. From 1914 to 1949, it appeared quite similar to ordinary editions. |
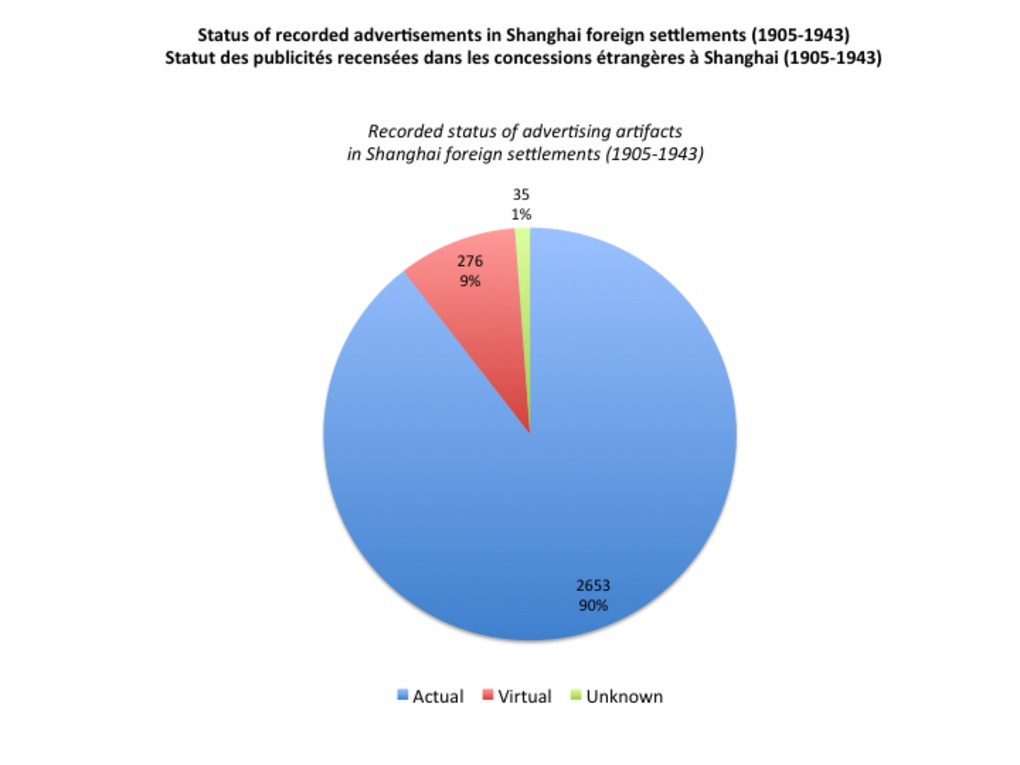 | 227 | Actual and virtual spaces of advertising in Shanghai (1905-1943) | This pie chart shows the global distribution between virtual (imaginary) (in blue) and actual (red) spaces of advertising in Shanghai foreign settlements (1905-1943). Uncertain status is materialized by the green color. This chart has been established after the Shanghai municipal archives. |
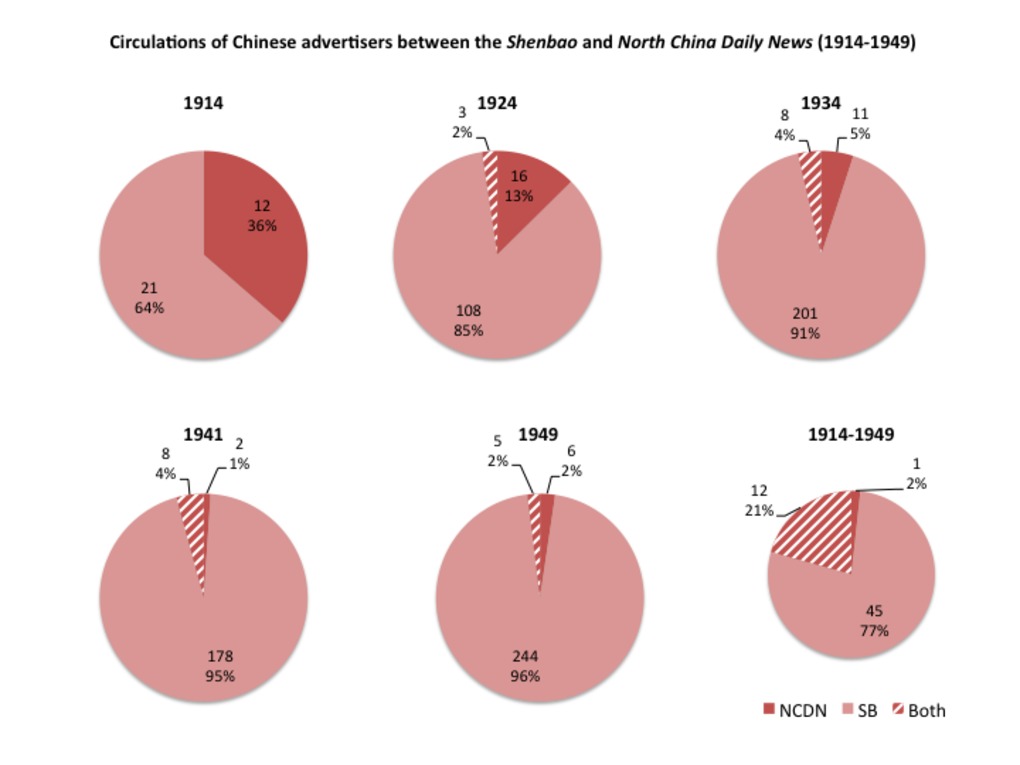
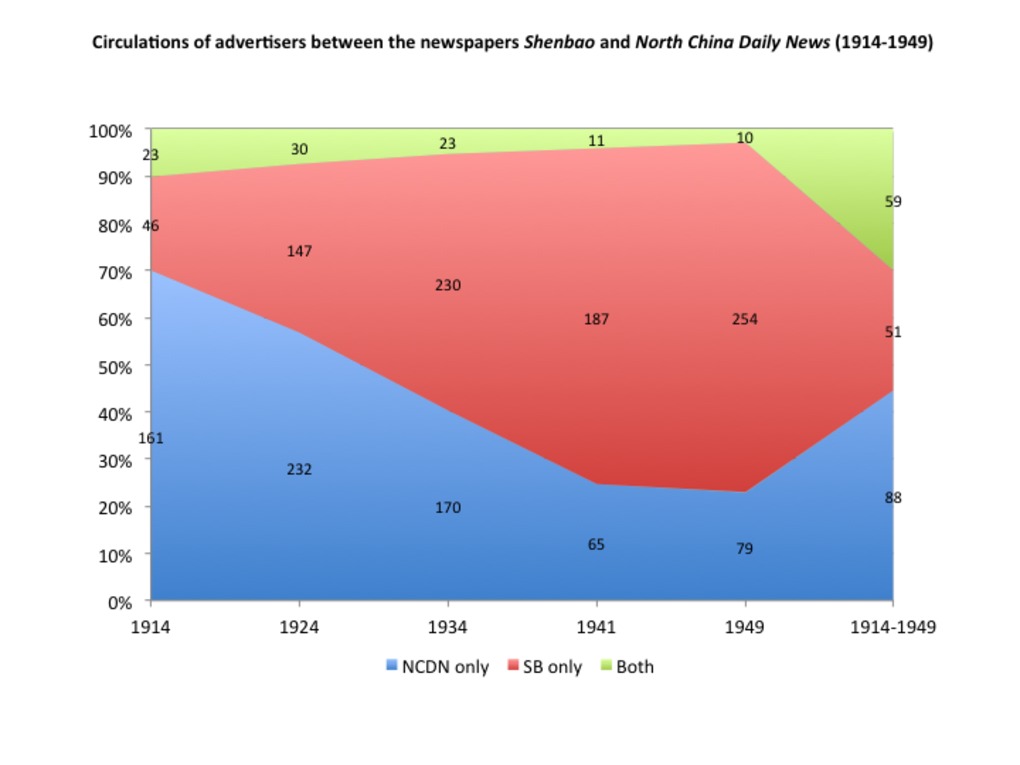 | 282 | Advertisers circulating between the newspapers Shenbao and North China Daily News (1914-1949) | Ce graphique a été réalisé à partir de la table associée : http://madspace.org/cooked/Tables?ID=158 |
 | 283 | Advertisers circulating between the press and streets of Shanghai (1905-1949) | Ce graphique a été réalisé à partir de la table associée : http://madspace.org/cooked/Tables?ID=158 |
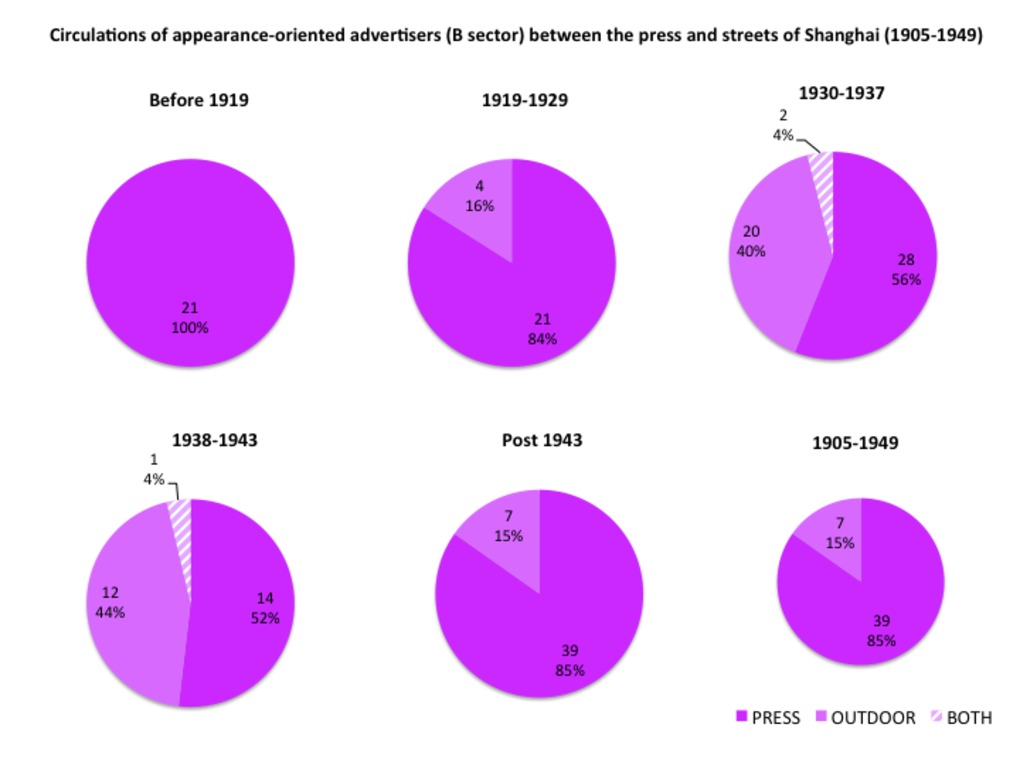 | 290 | Advertisers circulating between the press and streets of Shanghai, according to their business sector: appearance (B) and culture (C) (1914-1949) | Ce triple jeu de six camemberts chacun suit les circulations (ou les blocages) des annonceurs entre la presse et les rues de Shanghai, en fonction de leur secteur d'activité (selon le code adopté dans le quatrième chapitre, associant une lettre et une couleur à chaque secteur: http://madspace.org/cooked/Tables?ID=103). L'objectif est de savoir si certains secteurs productifs sont plus mobiles que d'autres, et si les circulations sont multilatérales ou unilatérales d'un journal à l'autre. Ce tableau a été réalisé à partir de la table associée : http://madspace.org/cooked/Tables?ID=158 Le premier ensemble de camemberts concerne la culture des apparences (B, en rose : cosmétiques, parures, objects décoratifs pour la maison, etc); le second la culture et les produits dits "culturels" (C, en marron). On rappelle que cette catégorie globale inclut les livres, radio, musique, annonces scolaires, cinéma, photographie, matériel bureautique, etc). |
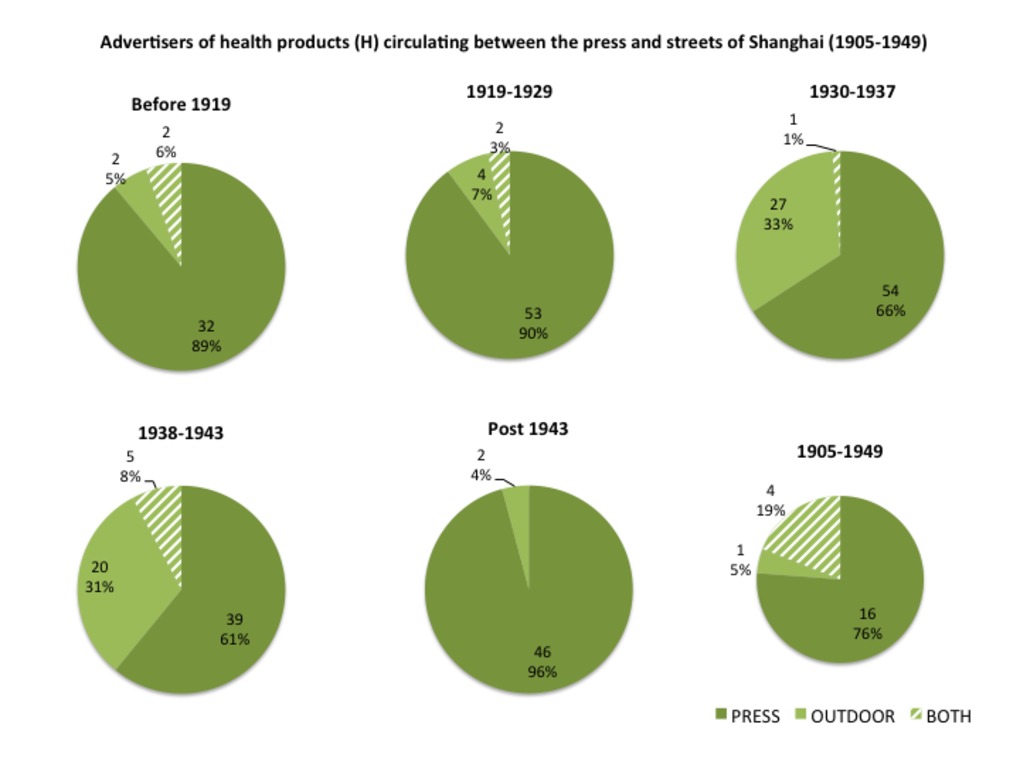 | 291 | Advertisers circulating between the press and streets of Shanghai, according to their business sector: health (H) and nutrition (N) (1914-1949) | Ce triple jeu de six camemberts chacun suit les circulations (ou les blocages) des annonceurs entre la presse et les rues de Shanghai, en fonction de leur secteur d'activité (selon le code adopté dans le quatrième chapitre, associant une lettre et une couleur à chaque secteur: http://madspace.org/cooked/Tables?ID=103). L'objectif est de savoir si certains secteurs productifs sont plus mobiles que d'autres, et si les circulations sont multilatérales ou unilatérales d'un journal à l'autre. Ce tableau a été réalisé à partir de la table associée : http://madspace.org/cooked/Tables?ID=158 Le premier ensemble de camemberts concerne la santé (H, en vert); le second les aliments et les boissons (N, en marron-vert). |
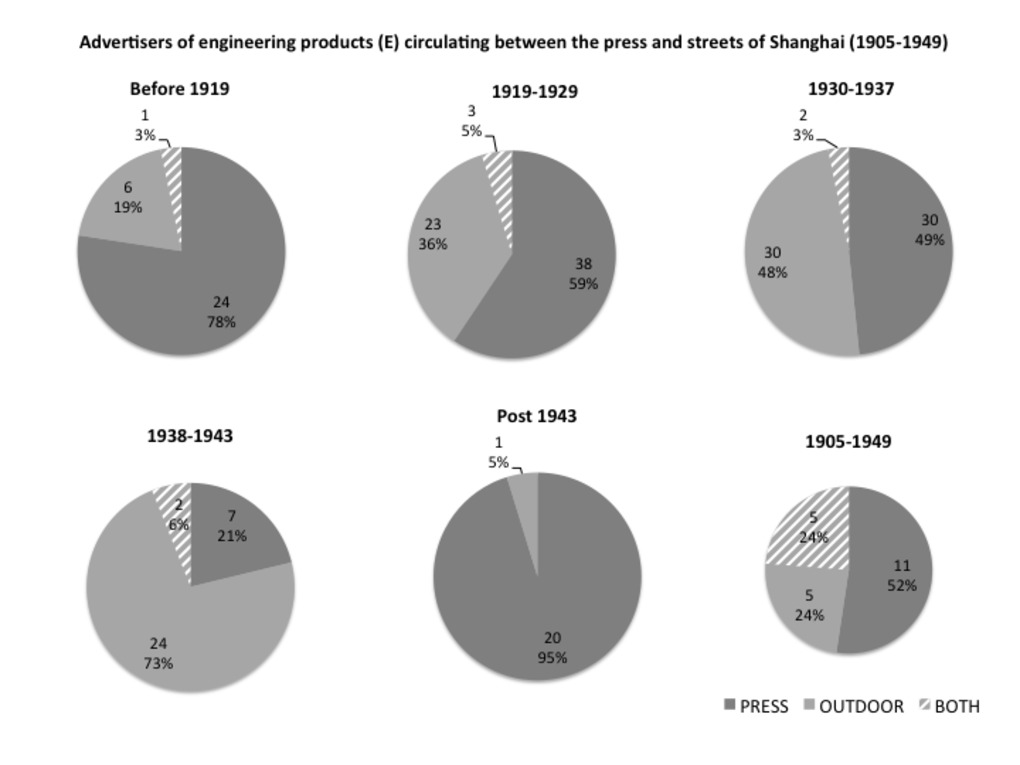 | 293 | Advertisers circulating between the press and streets of Shanghai, according to their business sector: industry (E), finance (F) and urban services (U) (1914-1949) | Ce triple jeu de six camemberts chacun suit les circulations (ou les blocages) des annonceurs entre la presse et les rues de Shanghai, en fonction de leur secteur d'activité (selon le code adopté dans le quatrième chapitre, associant une lettre et une couleur à chaque secteur: http://madspace.org/cooked/Tables?ID=103). L'objectif est de savoir si certains secteurs productifs sont plus mobiles que d'autres, et si les circulations sont multilatérales ou unilatérales d'un journal à l'autre. Ce tableau a été réalisé à partir de la table associée : http://madspace.org/cooked/Tables?ID=158 Le premier jeu de camemberts concerne le secteur financier (F, en violet); le deuxième l'industrie (E, en gris); le troisième les services (énergie et transports) (U, en bleu). |
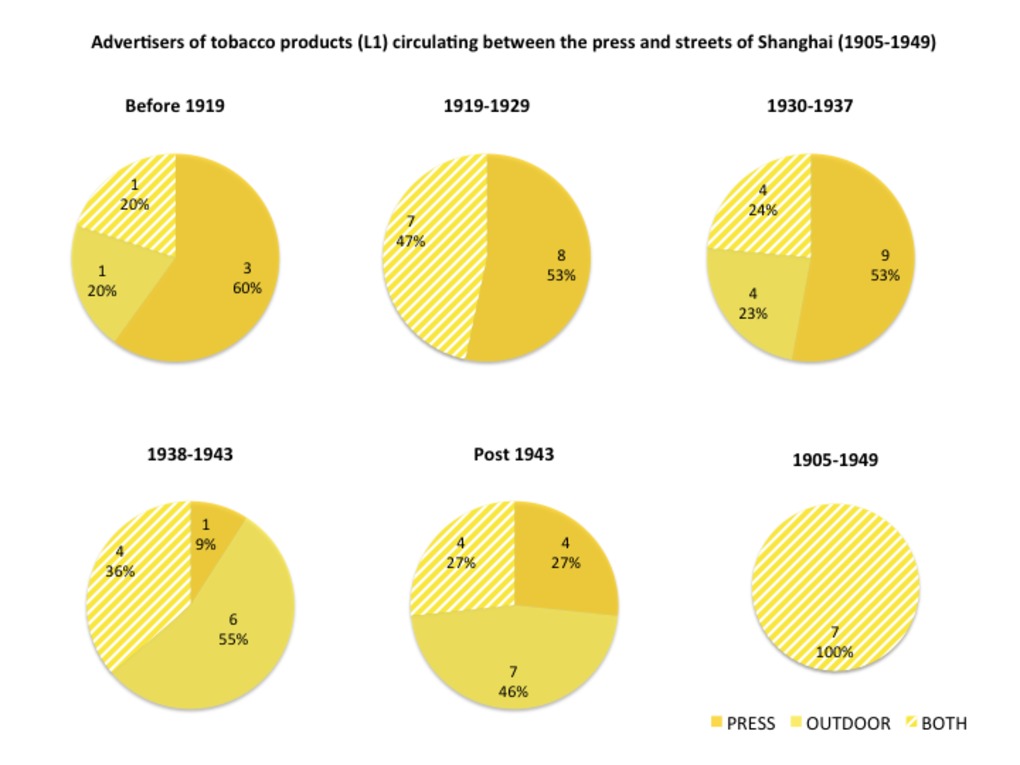 | 292 | Advertisers circulating between the press and streets of Shanghai, according to their business sector: tobacco (L1), alcohol (L2) and leisure (L3-L5) (1914-1949) | Ce triple jeu de six camemberts chacun suit les circulations (ou les blocages) des annonceurs entre la presse et les rues de Shanghai, en fonction de leur secteur d'activité (selon le code adopté dans le quatrième chapitre, associant une lettre et une couleur à chaque secteur: http://madspace.org/cooked/Tables?ID=103). L'objectif est de savoir si certains secteurs productifs sont plus mobiles que d'autres, et si les circulations sont multilatérales ou unilatérales d'un journal à l'autre. Ce tableau a été réalisé à partir de la table associée : http://madspace.org/cooked/Tables?ID=158 Le premier jeu de camemberts concerne le tabac (L1, en jaune); le deuxième les boissons alcoolisées (L2, en orange foncé); le troisième les loisirs et autres formes de plaisirs (L3-L5) (théâtre, cinéma, bar, restaurant, grand magasin, etc). |
 | 285 | Advertisers circulating between the press and streets of Shanghai, according to their nationalities: Chinese, Western, Japanese (1905-1949) | Ce triple jeu de six camemberts chacun suit les circulations (ou les blocages) des annonceurs la presse et les rues de Shanghai, en fonction de leur nationalité. L'objectif est de savoir si certaines "nationalités" sont plus mobiles que d'autres, si les circulations sont multilatérales ou unilatérales d'un espace à l'autre. Ce tableau a été réalisé à partir de la table associée : http://madspace.org/cooked/Tables?ID=158 Le premier ensemble de camemberts suit les annonceurs chinois (rouge), le deuxième les annonceurs "occidentaux" (européens et américains) en bleu, le troisième procède de même pour les annonceurs japonais (en jaune). |
 | 286 | Advertisers circulating within the Shanghai press, according to their business sector: appearance (B) and culture (C) (1914-1949) | Ce triple jeu de six camemberts chacun suit les circulations (ou les blocages) des annonceurs entre le quotidien chinois Shenbao et son homologue britannique North China Daily News, en fonction de leur secteur d'activité (selon le code adopté dans le quatrième chapitre, associant une lettre et une couleur à chaque secteur: http://madspace.org/cooked/Tables?ID=103). L'objectif est de savoir si certains secteurs productifs sont plus mobiles que d'autres, et si les circulations sont multilatérales ou unilatérales d'un journal à l'autre. Ce tableau a été réalisé à partir de la table associée : http://madspace.org/cooked/Tables?ID=158 Le premier ensemble de camemberts concerne la culture des apparences (B, en rose : cosmétiques, parures, objects décoratifs pour la maison, etc); le second la culture et les produits dits "culturels" (C, en marron). On rappelle que cette catégorie globale inclut les livres, radio, musique, annonces scolaires, cinéma, photographie, matériel bureautique, etc). |
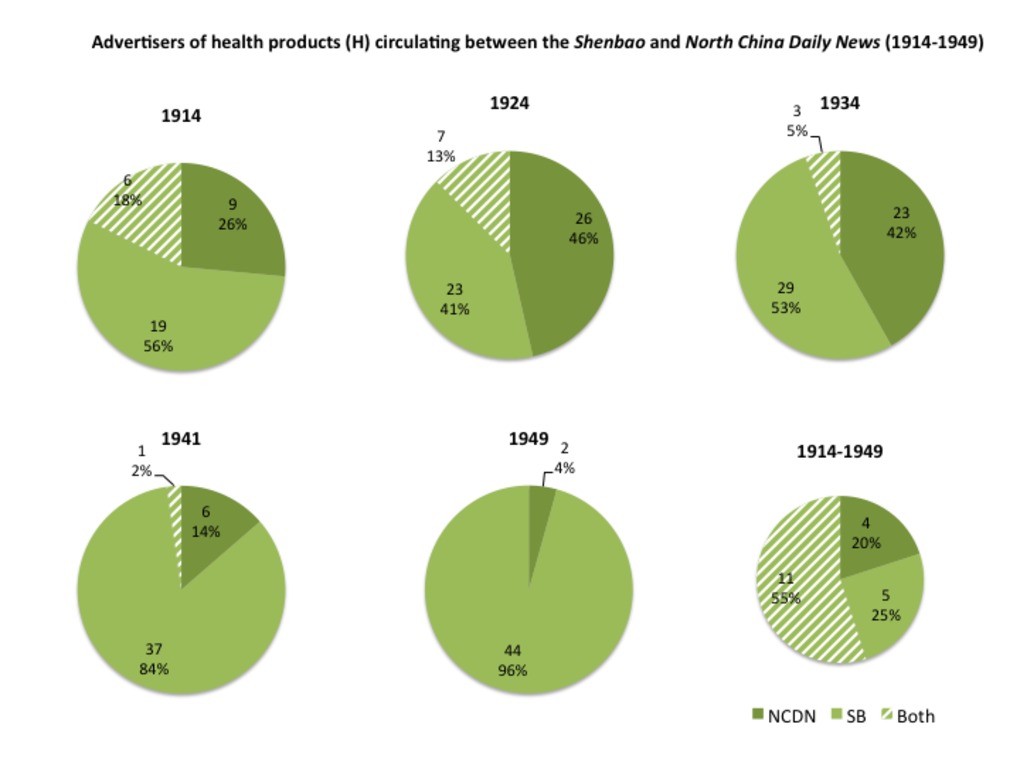 | 287 | Advertisers circulating within the Shanghai press, according to their business sector: health (H) and nutrition (N) (1914-1949) | Ce triple jeu de six camemberts chacun suit les circulations (ou les blocages) des annonceurs entre le quotidien chinois Shenbao et son homologue britannique North China Daily News, en fonction de leur secteur d'activité (selon le code adopté dans le quatrième chapitre, associant une lettre et une couleur à chaque secteur: http://madspace.org/cooked/Tables?ID=103). L'objectif est de savoir si certains secteurs productifs sont plus mobiles que d'autres, et si les circulations sont multilatérales ou unilatérales d'un journal à l'autre. Ce tableau a été réalisé à partir de la table associée : http://madspace.org/cooked/Tables?ID=158 Le premier ensemble de camemberts concerne la santé (H, en vert); le second les aliments et les boissons (N, en marron-vert). |
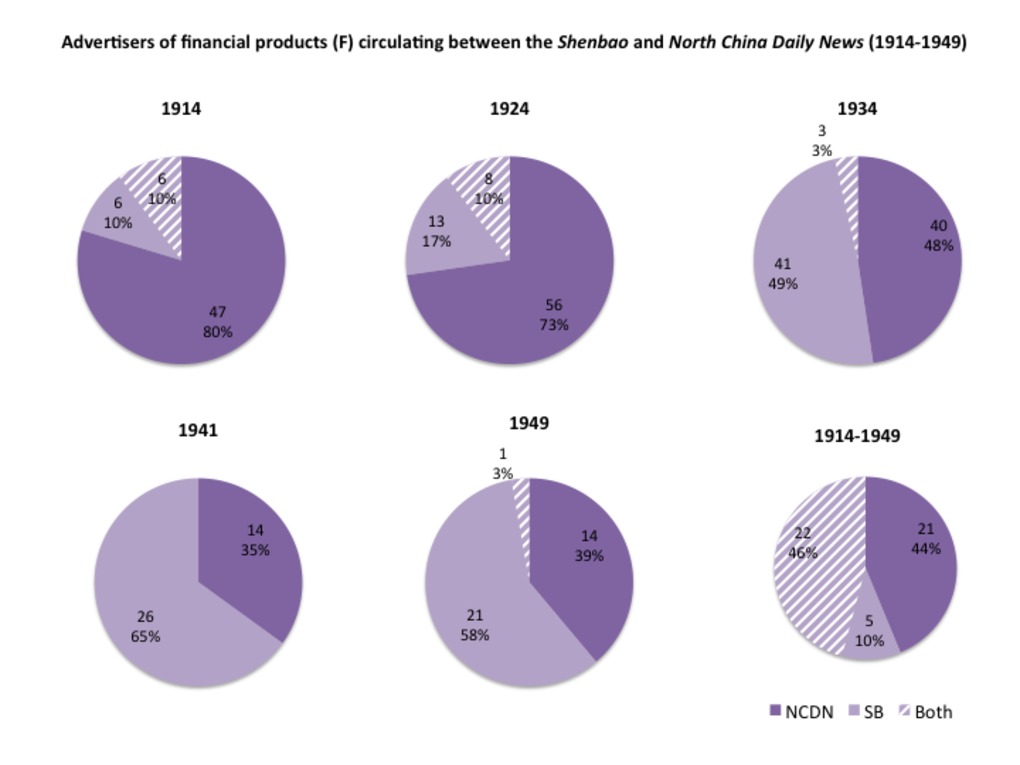 | 289 | Advertisers circulating within the Shanghai press, according to their business sector: industry (E), finance (F) and urban services (U) (1914-1949) | Ce triple jeu de six camemberts chacun suit les circulations (ou les blocages) des annonceurs entre le quotidien chinois Shenbao et son homologue britannique North China Daily News, en fonction de leur secteur d'activité (selon le code adopté dans le quatrième chapitre, associant une lettre et une couleur à chaque secteur: http://madspace.org/cooked/Tables?ID=103). L'objectif est de savoir si certains secteurs productifs sont plus mobiles que d'autres, et si les circulations sont multilatérales ou unilatérales d'un journal à l'autre. Ce tableau a été réalisé à partir de la table associée : http://madspace.org/cooked/Tables?ID=158 Le premier jeu de camemberts concerne le secteur financier (F, en violet); le deuxième l'industrie (E, en gris); le troisième les services (énergie et transports) (U, en bleu). |
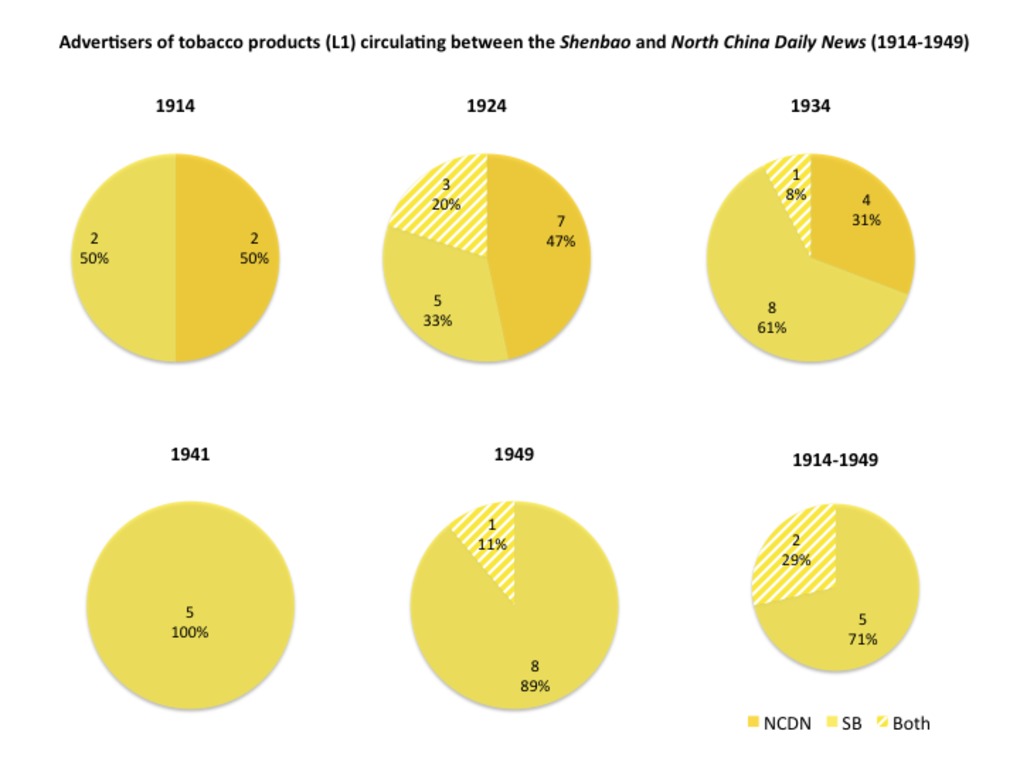 | 288 | Advertisers circulating within the Shanghai press, according to their business sector: tobacco (L1), alcohol (L2) and leisure (L3-L5) (1914-1949) | Ce triple jeu de six camemberts chacun suit les circulations (ou les blocages) des annonceurs entre le quotidien chinois Shenbao et son homologue britannique North China Daily News, en fonction de leur secteur d'activité (selon le code adopté dans le quatrième chapitre, associant une lettre et une couleur à chaque secteur: http://madspace.org/cooked/Tables?ID=103). L'objectif est de savoir si certains secteurs productifs sont plus mobiles que d'autres, et si les circulations sont multilatérales ou unilatérales d'un journal à l'autre. Ce tableau a été réalisé à partir de la table associée : http://madspace.org/cooked/Tables?ID=158 Le premier jeu de camemberts concerne le tabac (L1, en jaune); le deuxième les boissons alcoolisées (L2, en orange foncé); le troisième les loisirs et autres formes de plaisirs (L3-L5) (théâtre, cinéma, bar, restaurant, grand magasin, etc). |
 | 284 | Advertisers circulating within the Shanghai press, according to their nationalities: Chinese, Western, Japanese (1914-1949) | Ce triple jeu de six camemberts chacun suit les circulations (ou les blocages) des annonceurs entre le quotidien chinois Shenbao et son homologue britannique North China Daily News, en fonction de leur nationalité. L'objectif est de savoir si certaines "nationalités" sont plus mobiles que d'autres, si les circulations sont multilatérales ou unilatérales d'un journal à l'autre. Ce tableau a été réalisé à partir de la table associée : http://madspace.org/cooked/Tables?ID=158 Le premier ensemble de camemberts suit les annonceurs chinois (rouge), le deuxième les annonceurs "occidentaux" (européens et américains) en bleu, le troisième procède de même pour les annonceurs japonais (en jaune). |
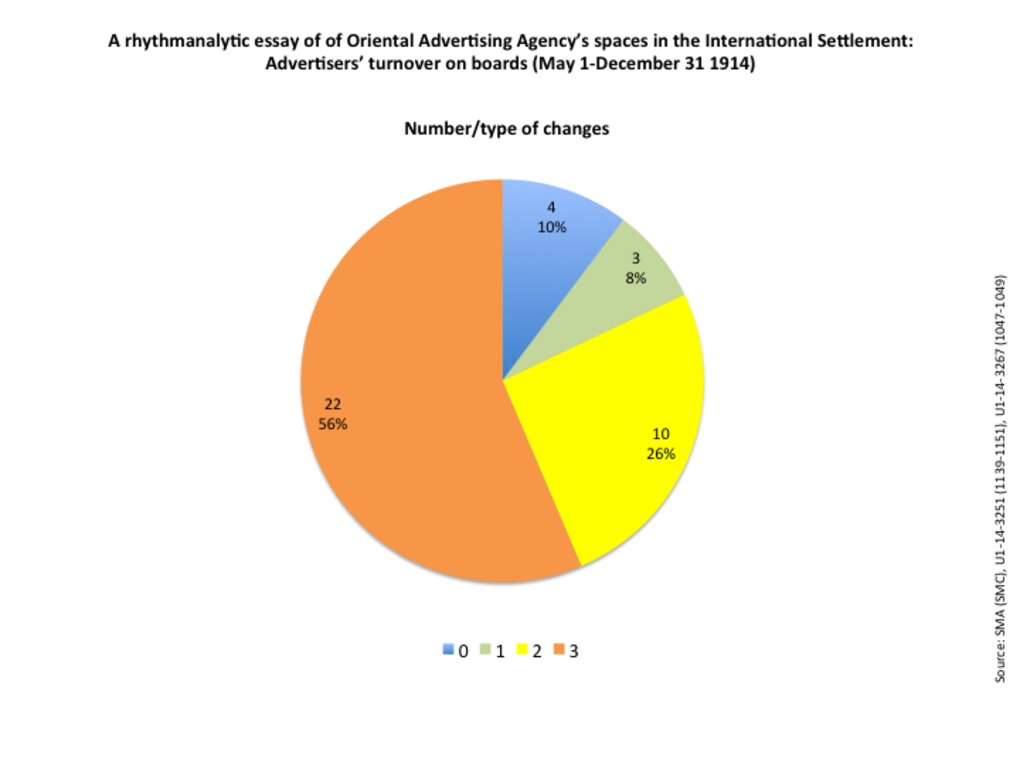 | 263 | Advertisers’ turnover on Oriental Advertising Agency's boards in the International Settlement (May 1-December 31 1914) | These set of three charts aims to refine the rhythmanalysis based on contracts duraction by appreciating the nature and degree of turnover within the same advertising spaces rented by the Oriental Advertising Agency in 1914. For that very purpose, we have established scale of change ranging from 0 to 3:
The pie chart suggests that Oriental Advertising Agency's spaces are marked by a high degree of instability in wartime. The maximal degree of change (3) represent 56% of the changes, followed by changes of location (26%), identical revewal (10%) and change of dimensions. The measurements are based on the the census made by the S.M.C. in 1914 and the regular inventories of Oriental Advertising Agency's boards sent to the Council by the company itself, between May 1 and December 31, 1914. Source: SMA (SMC), U1-14-3251 (1139-1151), U1-14-3267 (1047-1049). |
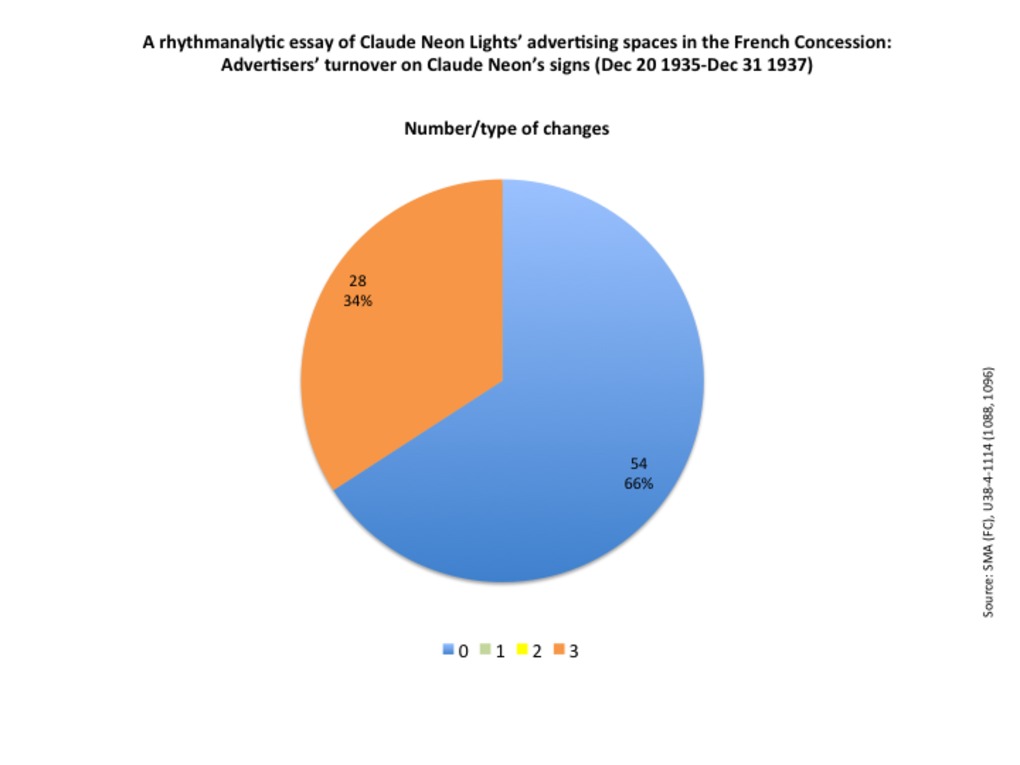 | 274 | Advertiser’s turnover on Claude Neon’s signs in the French Concession (Dec 20 1935-Dec 31 1937) | These set of three charts aims to refine the rhythmanalysis based on contracts duraction by appreciating the nature and degree of turnover within the advertising spaces owned by Claude Neon Lights between 1935 and 1937. For that very purpose, we have established scale of change ranging from 0 to 3:
The pie chart clearly reveals that Claude Neon Lights' signs enjoyed a relatively high degree of stability: 2/3 of signs remained unchanged during the entire period, while only 1/3 had experienced a change of advertiser. On can note that there is no intermediary changes, in terms of location or dimension (either a change of owner, either no change at all). This is due to the nature of the sign itsefl, firmly attached to the shop or building, with fixed dimensions. The measurements are based on the regular lists of signs that Claude Neon Lights sent to the French Municipal Council between December, 20 1935 and December, 31 1937, plus a few scattered signs recorded in other files in the Shanghai Municipal Archives (French concession and International Settlement in 1931 and 1941). Source: SMA (FC), U38-4-1114; SMA (SMC), U1-14-3261 (0246). |
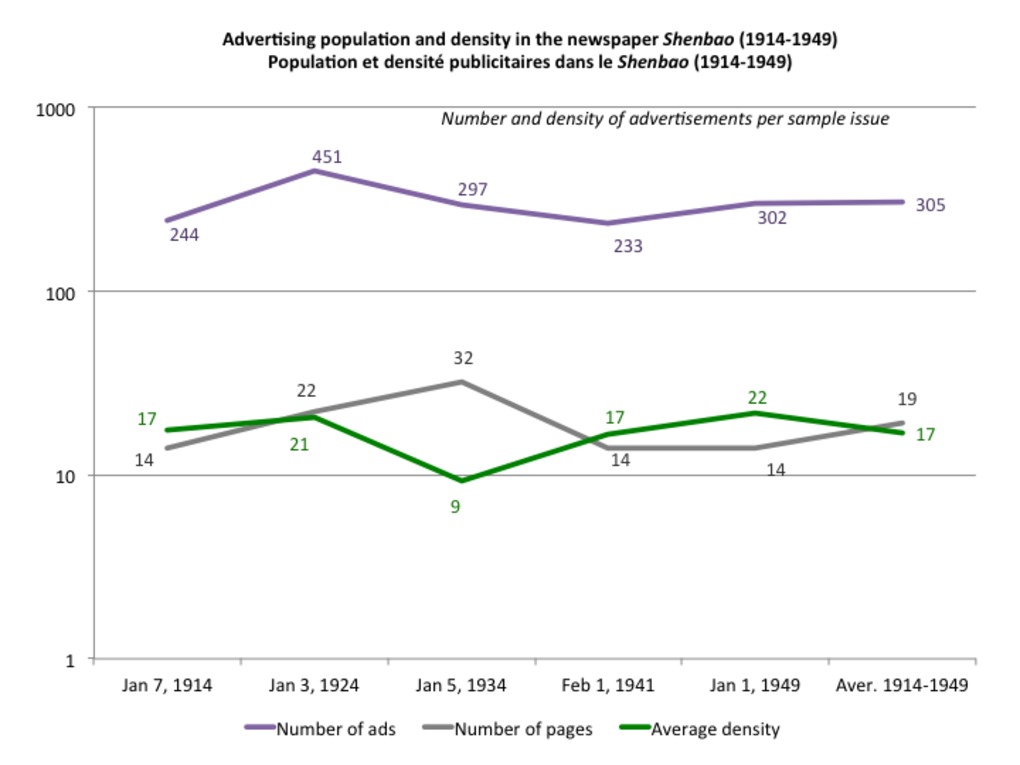 | 223 | Advertising population in the Chinese newspaper Shenbao (1914-1949) | This set of three curves traces the evolutions of advertising population and density in the Chinese newspaper Shenbao between 1914 and 1949. The green curve stands for the total number of advertisements (in each sample issue), the grey line indicates the total number of pages in each sample issue, the purple line indicates the average density of ads (number of ads/number of pages) in each sample issue). The measurements were made after our usual five samples of the Shenbao (January 7, 1914; January 3, 1924; January 5, 1934; February 1, 1941; January 1, 1949). *** Le jeu des trois courbes ci-joint retrace les tendances démographiques globales dans le quotidien chinois Shenbao entre 1914 et 1949 : l’évolution la population totale par numéro (courbe verte), évolution du nombre de pages (en gris), ainsi que l’évolution de la densité moyenne (c’est-à-dire le rapport entre nombre de publicités totale et nombre de pages, en violet). Les mesures ont été réalisées à partir de nos cinq échantillons habituels (7 janvier 1914, 3 janvier 1924, 5 janvier 1934, 1er février 1941, 1er janvier 1949) |
 | 239 | Advertising population in the newspaper North China Daily News (1914-1949) | This set of three curves traces the evolutions of advertising population and density in the Shanghai-based British newspaper North China Daily News between 1914 and 1949. The green curve stands for the total number of advertisements (in each sample issue), the grey line indicates the total number of pages in each sample issue, the purple line indicates the average density of ads (number of ads/number of pages) in each sample issue). For consistency reasons, the measurements were made after the same five samples as for the Chinese newspaper Shenbao (January 7, 1914; January 3, 1924; January 5, 1934; February 1, 1941; January 1, 1949). *** Le jeu des trois courbes ci-joint retrace les tendances démographiques globales dans le quotidien britannique North China Daily News entre 1914 et 1949 : l’évolution la population totale par numéro (courbe verte), évolution du nombre de pages (en gris), ainsi que l’évolution de la densité moyenne (c’est-à-dire le rapport entre nombre de publicités totale et nombre de pages, en violet). Par souci de cohérence, les mesures ont été réalisées à partir des mêmes cinq échantillons que pour le Shenbao (7 janvier 1914, 3 janvier 1924, 5 janvier 1934, 1er février 1941, 1er janvier 1949) |
 | 234 | Advertising press media in China: distribution between daily and non daily publications (1929) | This pie chart shows the distribution of press advertising media between daily newspapers and non daily publications (periodicals, magazines) in China before 1929. Source: Bacon, 1929 (755). Daily papers are obviously overwhelming the press business in China before the 1930s (89%). |
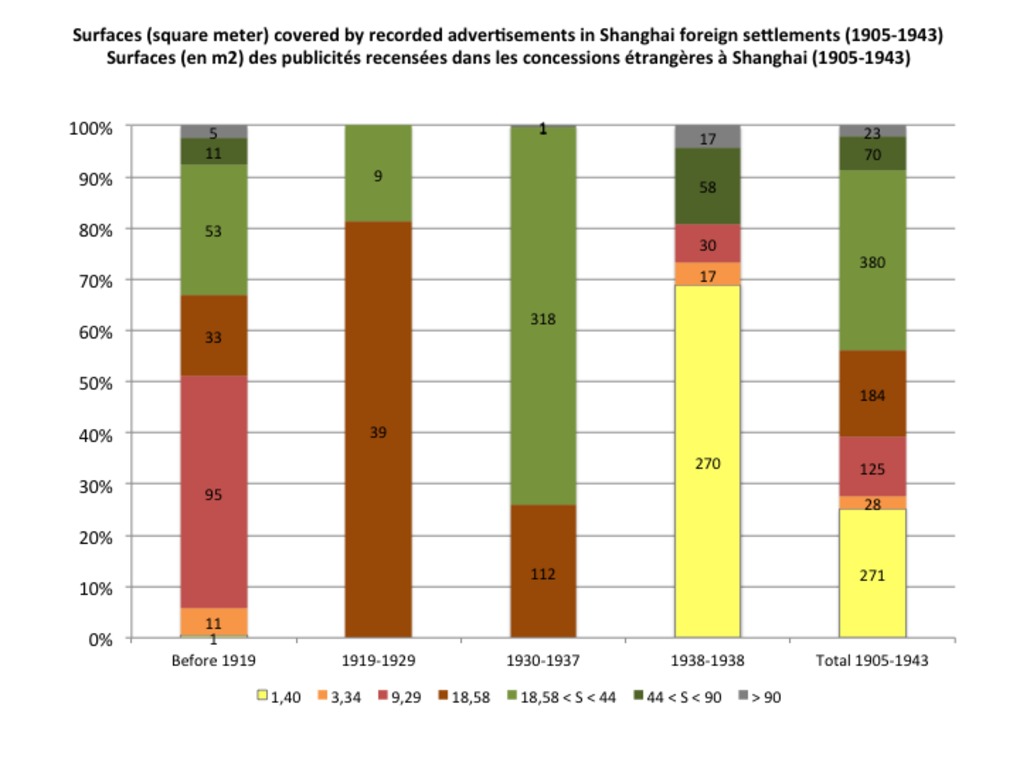 | 228 | Advertising surfaces (standards and size slices) in Shanghai foreign settlements (1905-1943) | This set of bar charts shows the distribution of advertising structures according to their dimensions in Shanghai foreign settlements (1905-1943). The size standards and "slices" have been identified after two main sources: professional handbooks (Crow, 1926, Bacon, 1929) and my own records in the Shanghai municipal archives. |
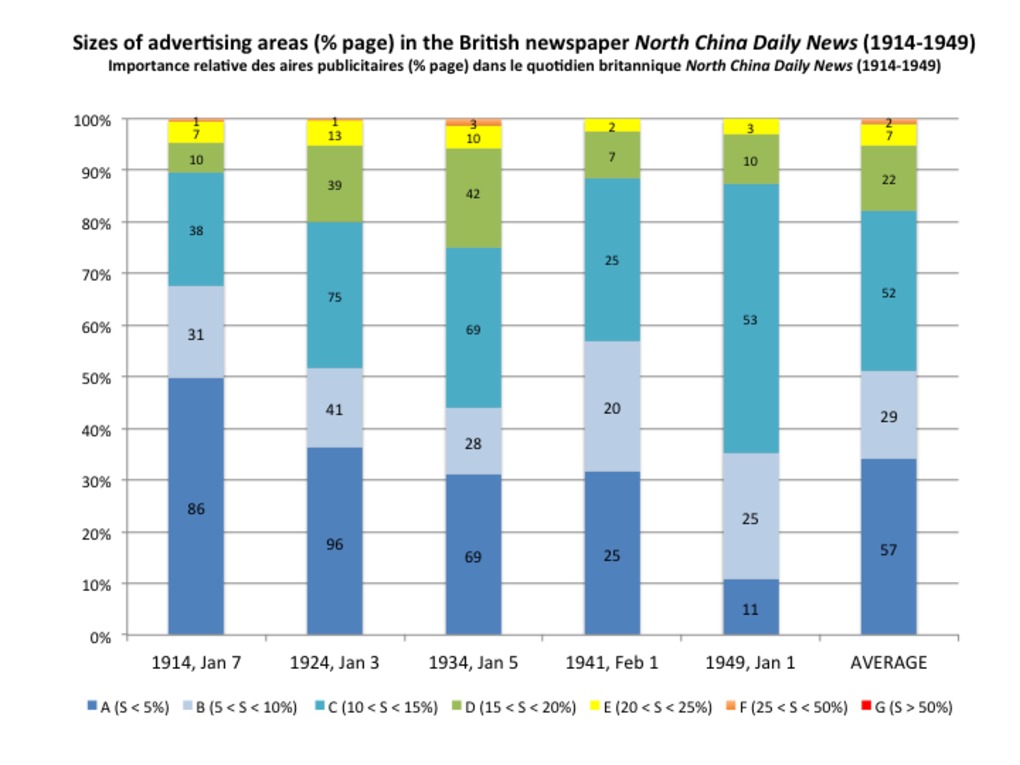 | 240 | Advertising-populated regions in the British newspaper North China Daily News (1914-1949) | This set of bar charts aims to measure the surfaces covered by advertisements in the Shanghai-based British newspaper North China Daily News, according to the following gradual scale of areas*:
*For visibility and convenience reasons, each type has been associated with a letter and a color ("S" standing for "surface"). For consistency reasons, measurements have been made after the same five samples as for the Chinese newspaper Shenbao (Jan 9, 1914; Jan 3, 1924; Jan 5, 1934; Feb 1, 1941; Jan 1, 1949). *** Les histogrammes ci-joint mesurent en termes numériques (nombre d’aires relevant de chaque catégorie) : l’importance relative des aires publicitaires dans le Shenbao, selon l'échelle graduée établie par ailleurs :
Par commoditité et par souci de lisibiité, une lettre et un code couleur a été associé à chaque catégorie. Plus la couleur est « froide » (bleu), plus les aires sont petites (types A, B, C : moins de 15% de la page). Inversement, plus les couleurs sont « chaudes » (du jaune au rouge), plus les surfaces sont étendues (type F et G : plus de 25% de la page). Le vert signale finalement les surface intermédiaires (D et E : entre 15 et 25%). La contance de ce code permet de suivre l’évolution des surfaces au fil des âges et de comparer les deux quotidiens. Par souci de cohérence, les mesures qui suivent ont été réalisées à partir des mêmes échantillons que pour le Shenbao (7 janvier 1914, 3 janvier 1924, 5 janvier 1934, 1er février 1941, 1er janvier 1949). |
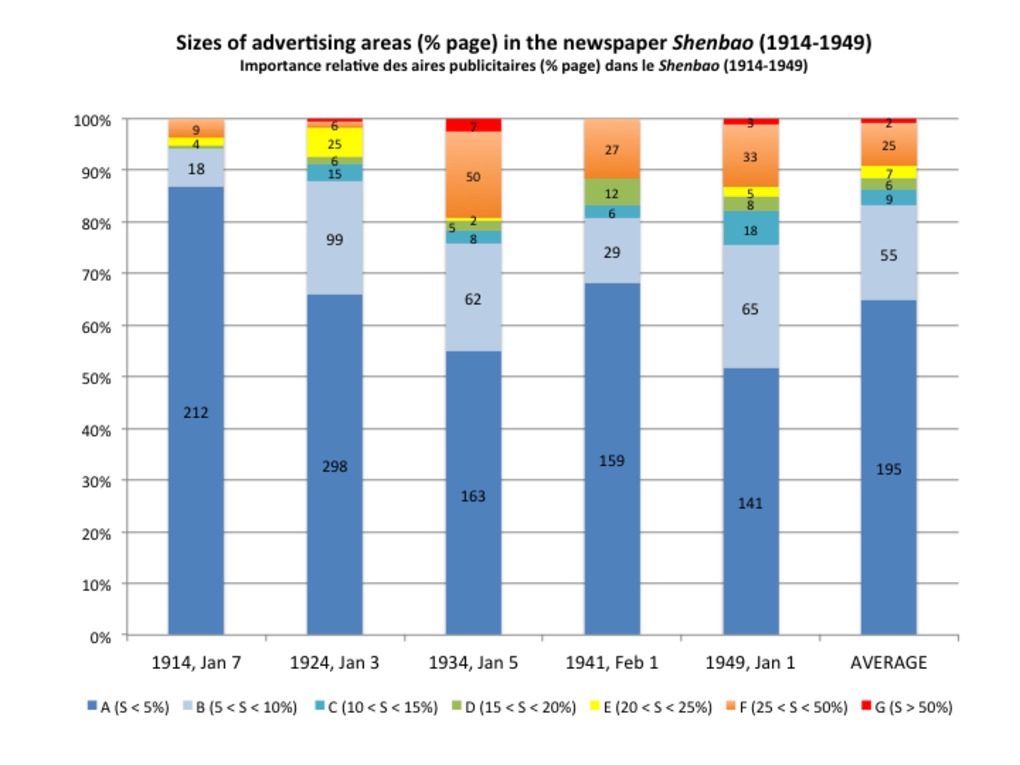 | 220 | Advertising-populated regions in the Chinese newspaper Shenbao (1914-1949) | This set of bar charts aims to measure the surfaces covered by advertisements in the newspaper Shenbao, according to the following gradual scale of areas*:
*For visibility and convenience reasons, each type has been associated with a letter and a color ("S" standing for "surface"): The measurements have been made after our five usual sample issues of the newspaper Shenbao (Jan 9, 1914; Jan 3, 1924; Jan 5, 1934; Feb 1, 1941; Jan 1, 1949). *** Les histogrammes ci-joint mesurent en termes numériques (nombre d’aires relevant de chaque catégorie) : l’importance relative des aires publicitaires dans le Shenbao, selon l'échelle graduée établie par ailleurs :
Par commoditité et par souci de lisibiité, une lettre et un code couleur a été associé à chaque catégorie. Plus la couleur est « froide » (bleu), plus les aires sont petites (types A, B, C : moins de 15% de la page). Inversement, plus les couleurs sont « chaudes » (du jaune au rouge), plus les surfaces sont étendues (type F et G : plus de 25% de la page). Le vert signale finalement les surface intermédiaires (D et E : entre 15 et 25%). La contance de ce code permet de suivre l’évolution des surfaces au fil des âges et de comparer le Shenbao à d'autres quotidiens. Par souci de cohérence, les mesures ont été réalisées à partir de nos cinq échantillons habituels du Shenbao (7 janvier 1914, 3 janvier 1924, 5 janvier 1934, 1er février 1941, 1er janvier 1949). |
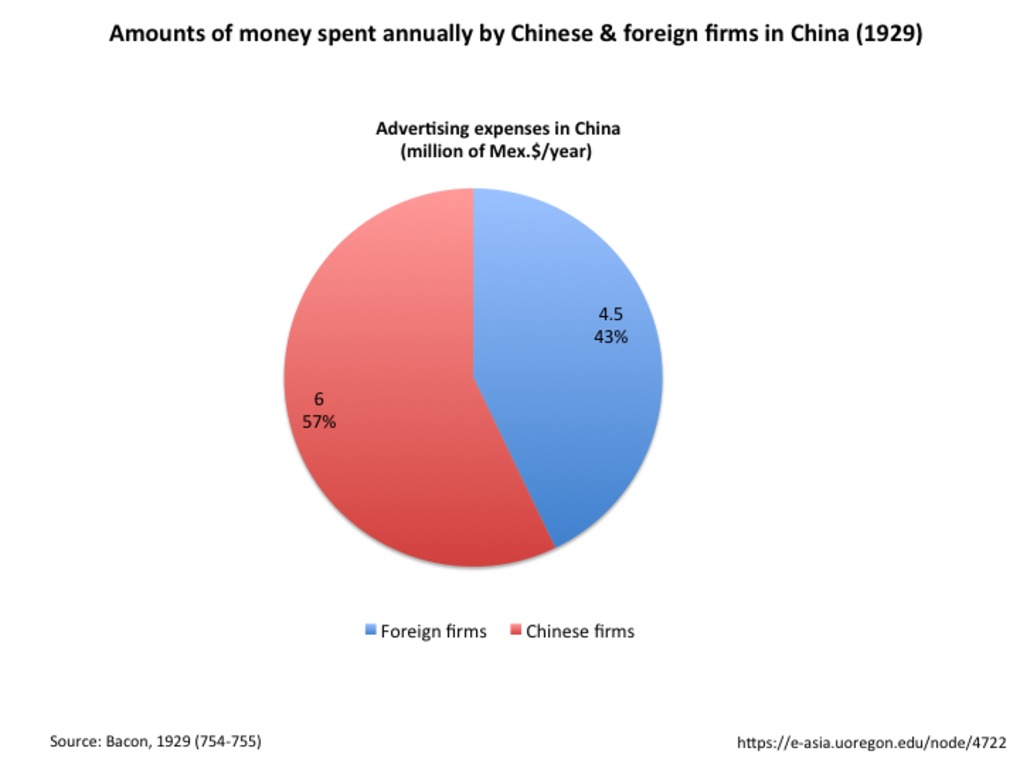 | 233 | Annual advertising expenses by Chinese and foreign firms in China (1929) | This pie charts shows the distribution of the money spent in advertising by Chinese and foreign firms in China before 1929 (expressed in million of mexican dollars/year). Source: Bacon, 1929 (754-755) |
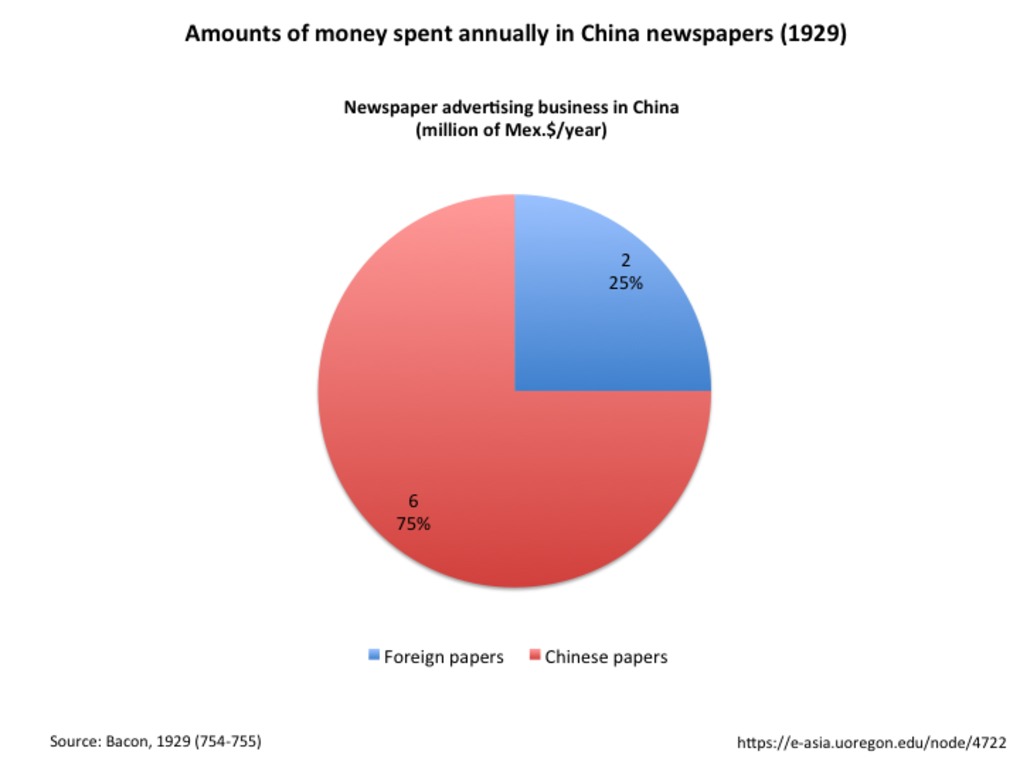 | 231 | Annual advertising expenses in China newspapers: distribution betwen Chinese and foreign newspaper (1929) | This pie charts shows the distribution of the money spent in advertising newspapers between Chinese and foreign newspaper in China before 1929 (expressed in million of mexican dollars/year). Source: Bacon, 1929 (754-755) |
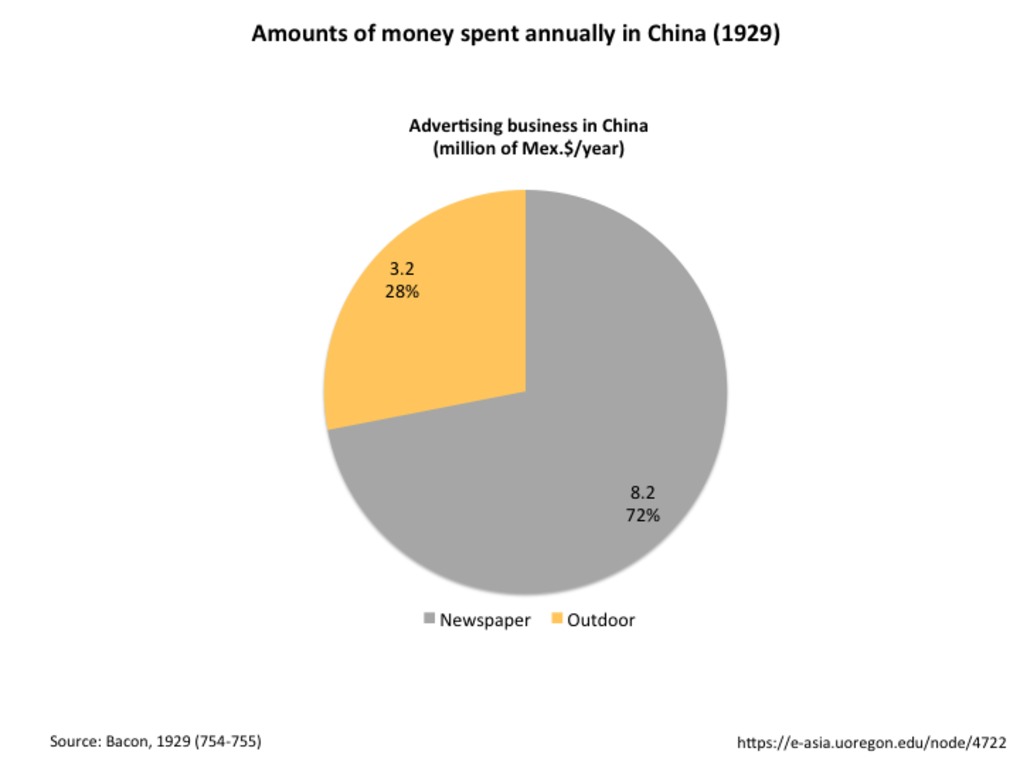 | 230 | Annual advertising expenses in China: distribution betwen newspaper and outdoor advertising (1929) | This pie charts shows the distribution of the money spent in advertising between newspaper and outdoor advertising in China before 1929 (expressed in million of mexican dollars/year). Source: Bacon, 1929 (754-755) |
 | 232 | Annual advertising expenses in Shanghai and China newspapers (1929) | This pie charts shows the distribution of the money spent in advertising newspapers in Shanghai and other cities in China before 1929 (expressed in million of mexican dollars/year). Source: Bacon, 1929 (754-755) |
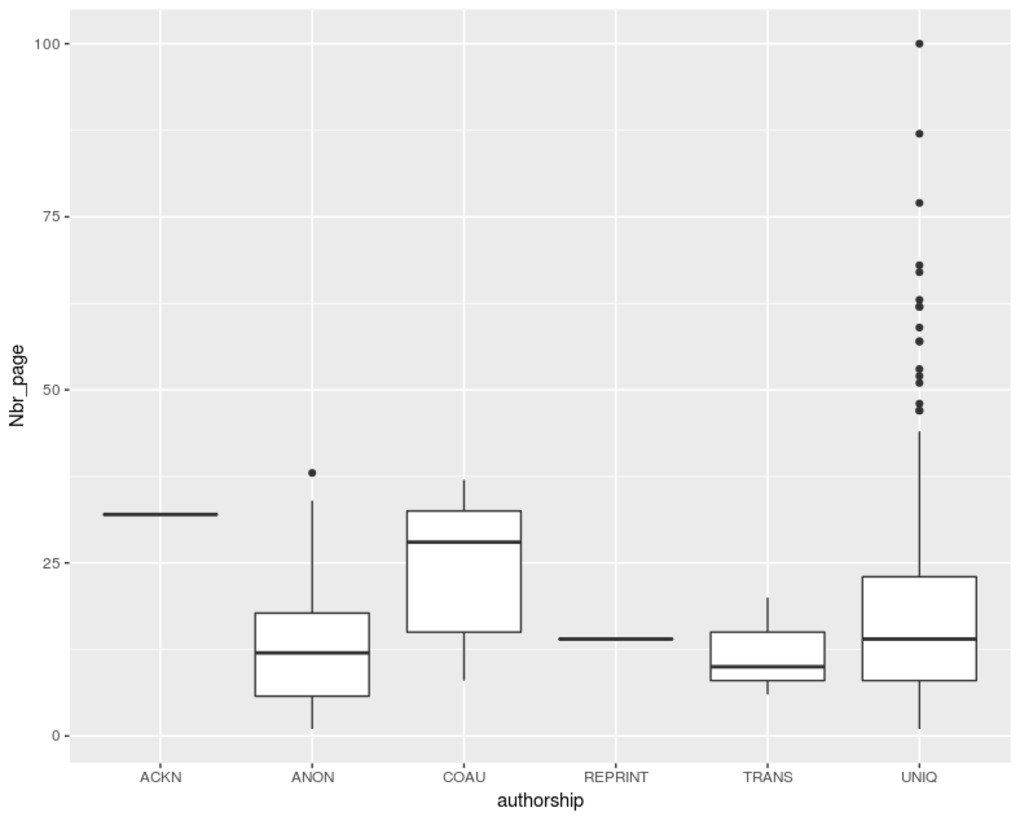 | 347 | Authorship in the Chinese Economic Journal | Based on the following dataset, the attached graphs explore the nature of authorship the Chinese Economic Monthly/Journal between 1924 and 1936, in relation to the the length of articles (1) and to the topics they addressed (2, 3). Relying on R package "ggplot2", we alternatively used boxplots (1, 2) and bar charts (3). The codes used for classifying topics and authorship are described in the notice attached to the original dataset. |
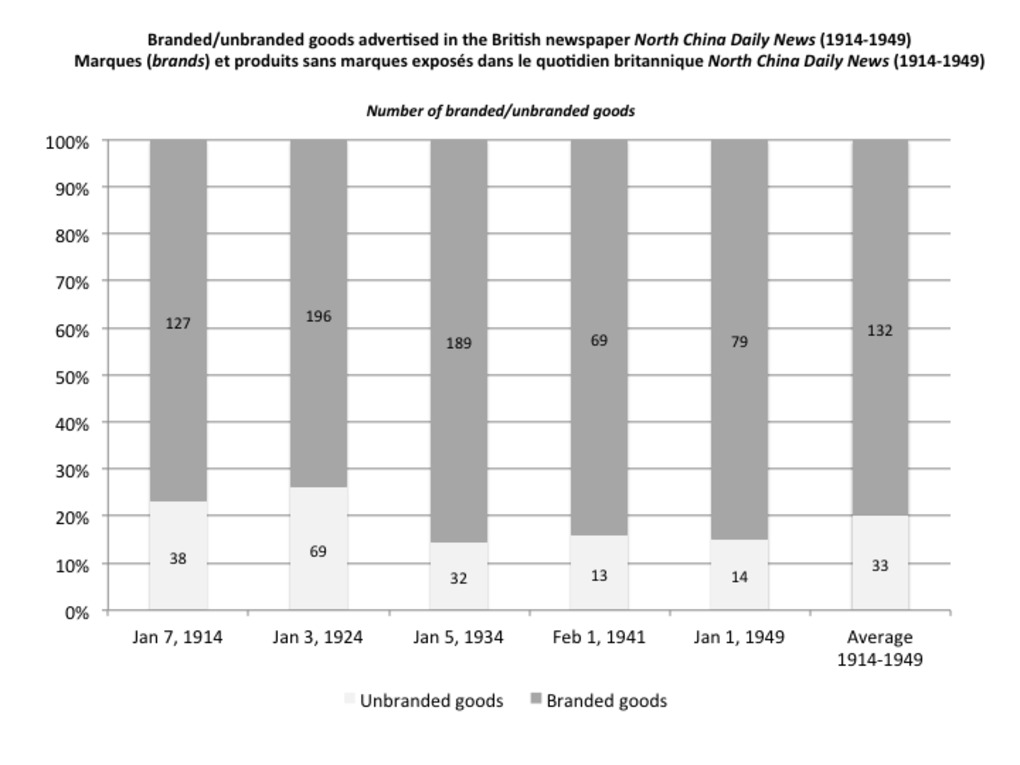 | 246 | Branded/unbranded goods in the British newspaper North China Daily News (1914-1949) | This set of bar charts aims to trace the emergence of branding and measure the proportion of branded (grey)/unbranded goods (white) advertised in the Shanghai-based British newspaper North China Daily News between 1914 and 1949. For consistency reasons, the measurements were made after the same five samples as those used for the Chinese newspaper Shenbao (Jan 7, 1914; Jan 3, 1924; Jan 5, 1934; Feb 1, 1941; Jan 1, 1949). |
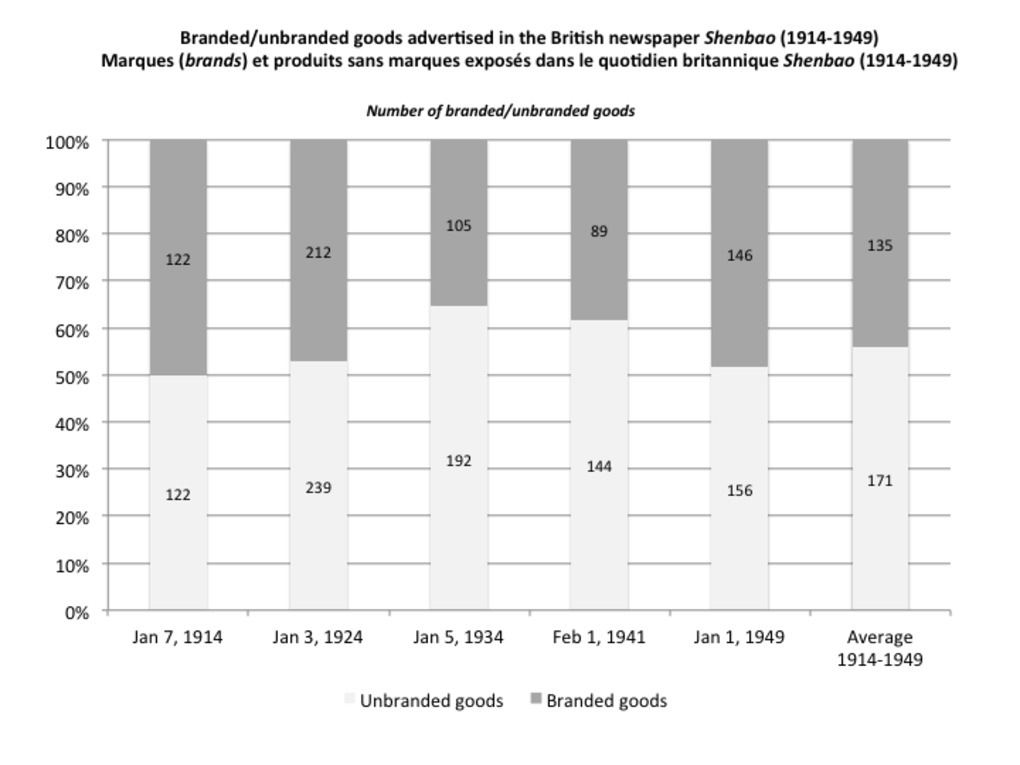 | 255 | Branded/unbranded goods in the Chinese newspaper Shenbao (1914-1949) | This set of bar charts aims to trace the emergence of branding and measure the proportion of branded (grey)/unbranded goods (white) advertised in the Shanghai-based Chinese newspaper Shenbao between 1914 and 1949. The measurements were made after our five usual samples (Jan 7, 1914; Jan 3, 1924; Jan 5, 1934; Feb 1, 1941; Jan 1, 1949). |
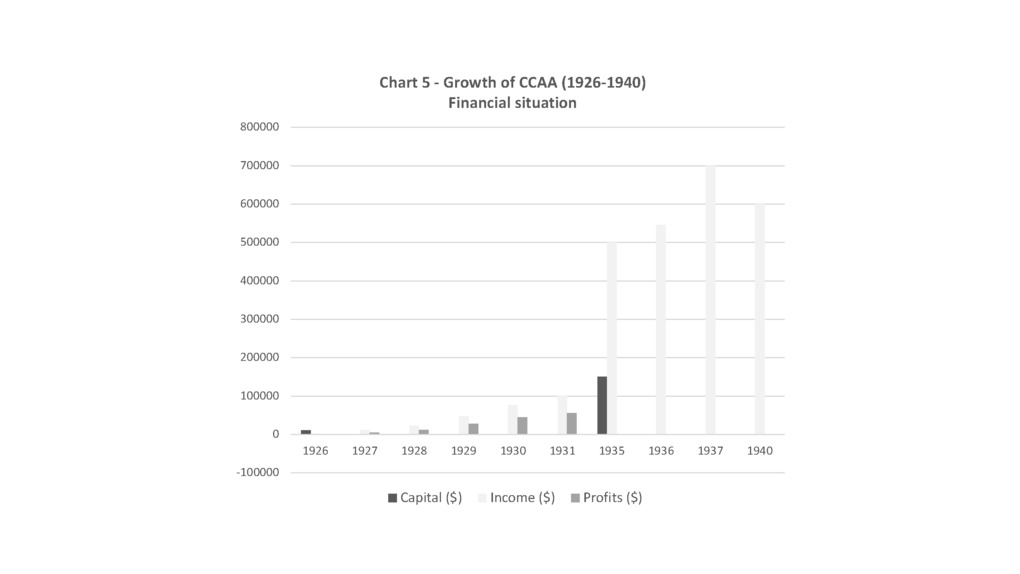 | 319 | China Commercial Advertising Agency’s financial situation | Graph showing the capital, income and profits of one of the first and leading Chinese agencies - the China Commercial Advertising Agency (CCAA) - founded in Shanghai in 1926. The chart reveals CCAA's spectacular growth between 1926 and 1940. Source: SMA, Q275-1-1840-37, Q275-1-1840-1. |
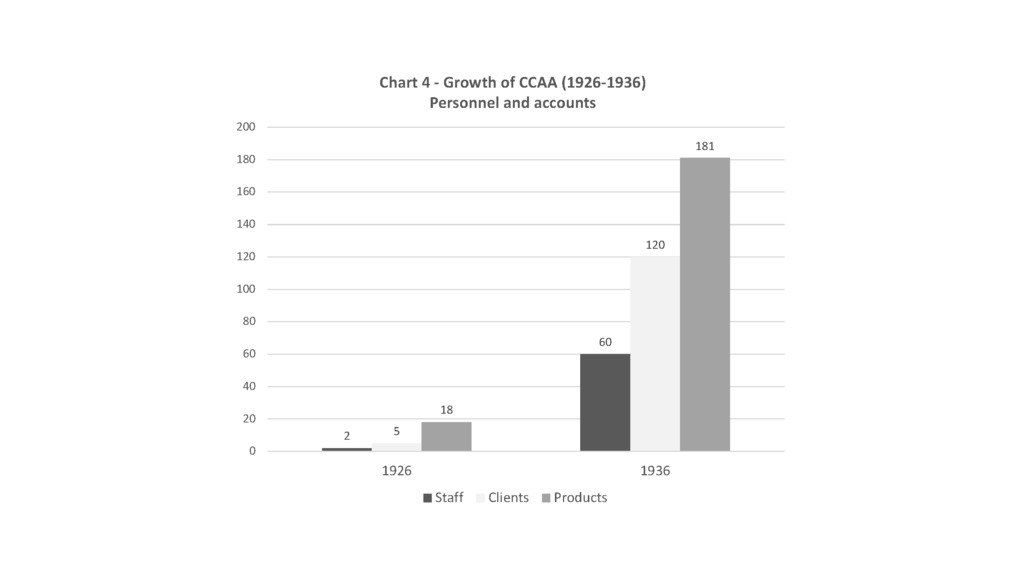 | 318 | China Commercial Advertising Agency’s staff and clients | Graph showing the number of employees and clients of one of the first and leading Chinese agencies - the China Commercial Advertising Agency (CCAA) - founded in Shanghai in 1926. The chart reveals CCAA's spectacular growth during the decade 1926-1936. |
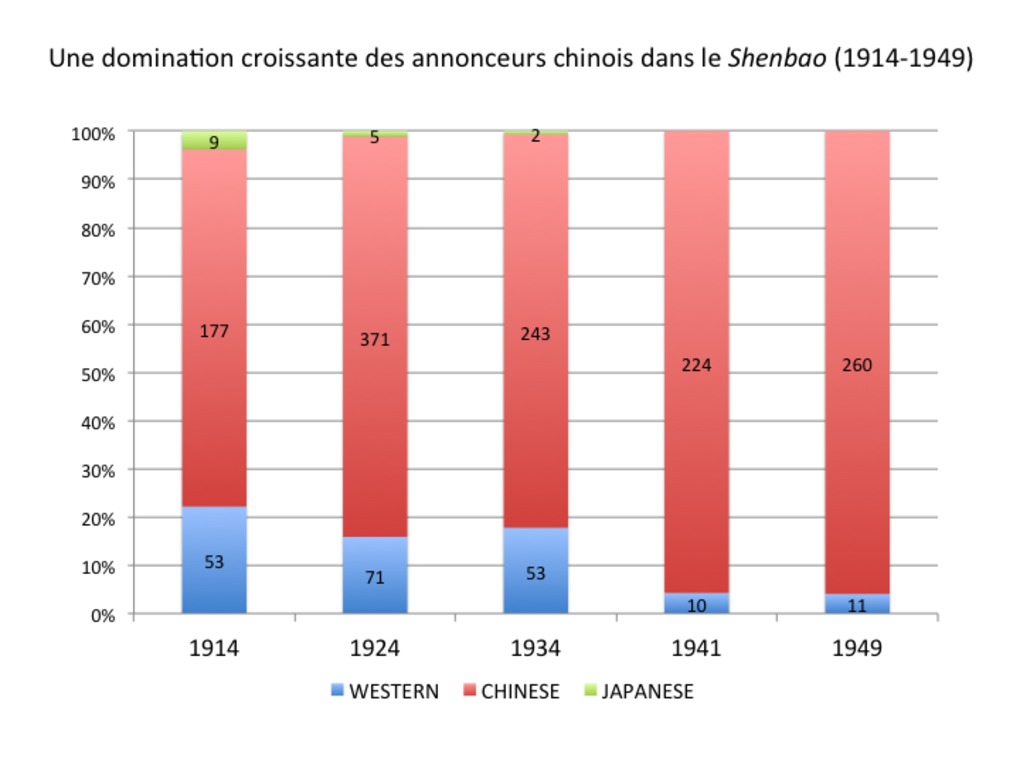 | 105 | Chinese and foreign advertisers in the Chinese newspaper Shenbao (1914-1949) | Répartition entre annonceurs chinois et étrangers dans le quotidien chinois Shenbao (1914-1949) Ces cinq histogrammes permettent de mesurer la répartition entre annonceurs chinois (en rouge) et étrangers (bleu) dans le Shenbao sur la période 1914-1949. Chaque histogramme a été réalisé à partir d'un échantillon restreint à un numéro (7 janvier 1914, 3 janvier 1924, 5 janvier 1934, 1er février 1941, 1er janvier 1949). Si les Chinois sont déjà en position de supériorité en 1914, ils ne cessent de progresser entre 1914 et 1949. Cette première évaluation duale et quelque peu "grossière" de l'origine des anonceurs sera affinée par la suite : les graphiques associés ("related data") mesurent la répartition au sein de la population d'annonceurs étrangers, d'une part ; et chinoise (différentes provinces ou localités en Chine), d'autre part. Pour les groupes culturels les plus représentatifs, on s'efforce également d'identifier leurs éventuelles "spécialisations" productives. Proportion of Chinese and foreign advertisers in the Chinese newspaper Shenbao (1914-1949) This set of five bar charts aims to measure the proportion of either Chinese (red) or foreign (blue) advertisers in the Chinese newspaper Shenbao between 1914-1949. The measurements were made after our five samples (Jan 7, 1914; Jan 3, 1924; Jan 5, 1934; Feb 1, 1941; Jan 1, 1949). Chinese advertisers are obviously overwhelming the pages of the Chinese newspaper as early as 1914, and they kept on growing during the whole period, especially in the 1930s. This first dual and somewhat "coarse" appreciation of the advertisers' origins need to be refined in a second place: the related graphs (see "related data") aim to measure the distribution of ads between various foreign nationalities (British, American, French, German, Japanese) and between Chinese advertisers (from various provinces or localities in China). For the most prominent cultural groups, we have strived to identify their potential business "specialization". |
 | 359 | Chinese contributors to the Chinese Economic Journal (educational institutions) | Based on the following dataset, the attached graphs explore Chinese contributors' educational institutions (the university in which they received their highest degree) in the Chinese Economic Monthly/Journal between 1924 and 1936, all periods included (1) and per period (2, 3). We relied on R package "ggplot2" to build these bar charts. |
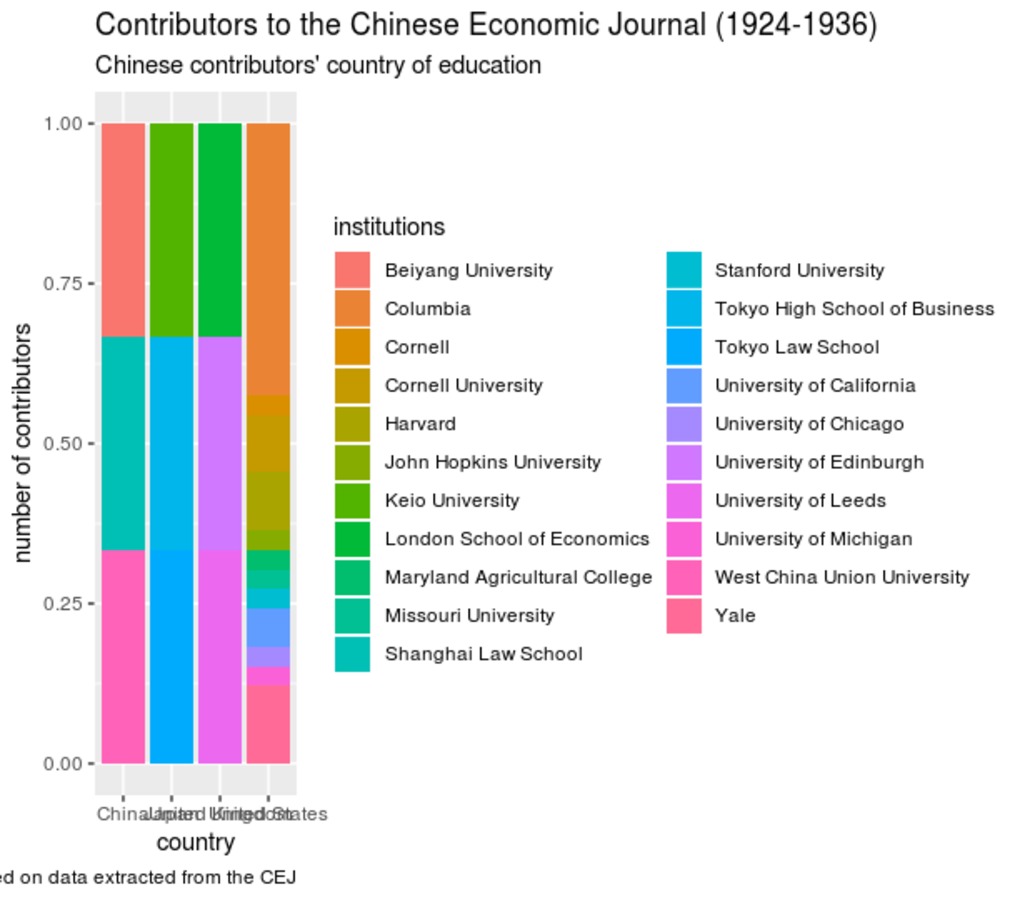
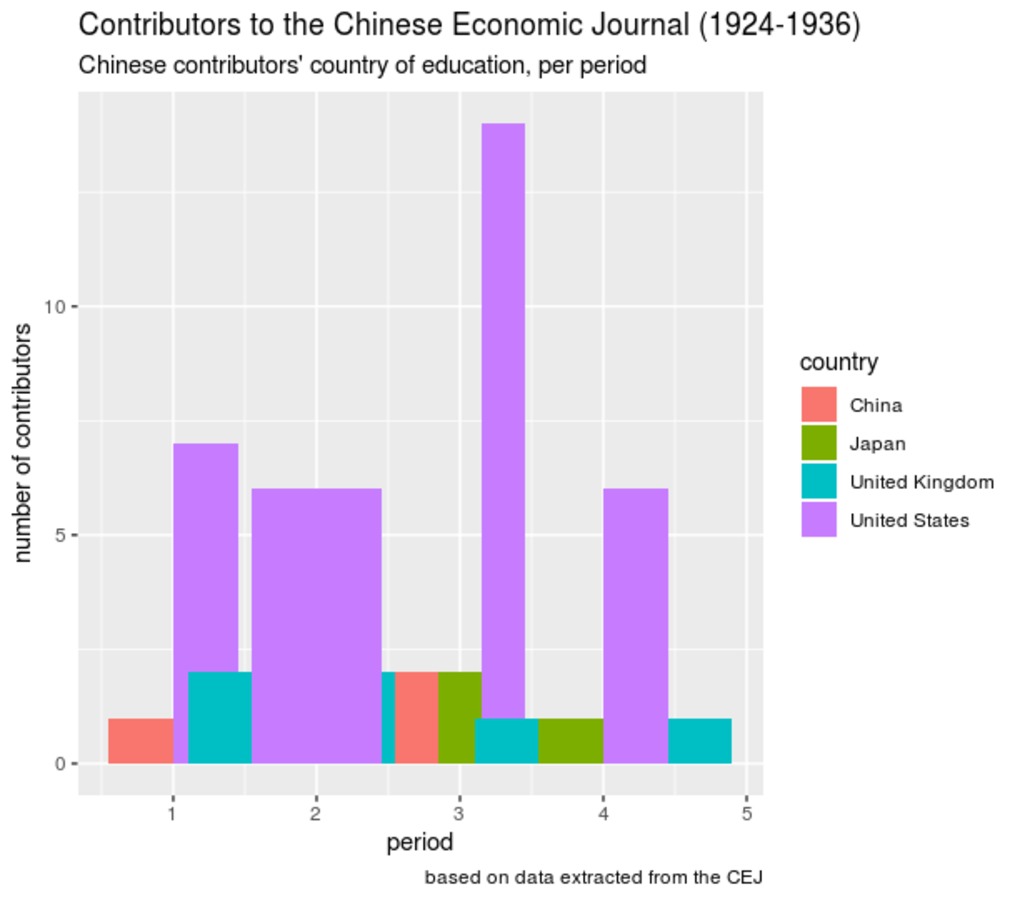 | 357 | Chinese contributors to the Chinese Economic Journal, per period (country of education) | Based on the following dataset, the attached graphs explore Chinese contributors' country of education (the country in which they received their highest degree) in the Chinese Economic Monthly/Journal between 1924 and 1936, per period. Relying on R package "ggplot2", we alternatively used faceted and dodged bar charts. |
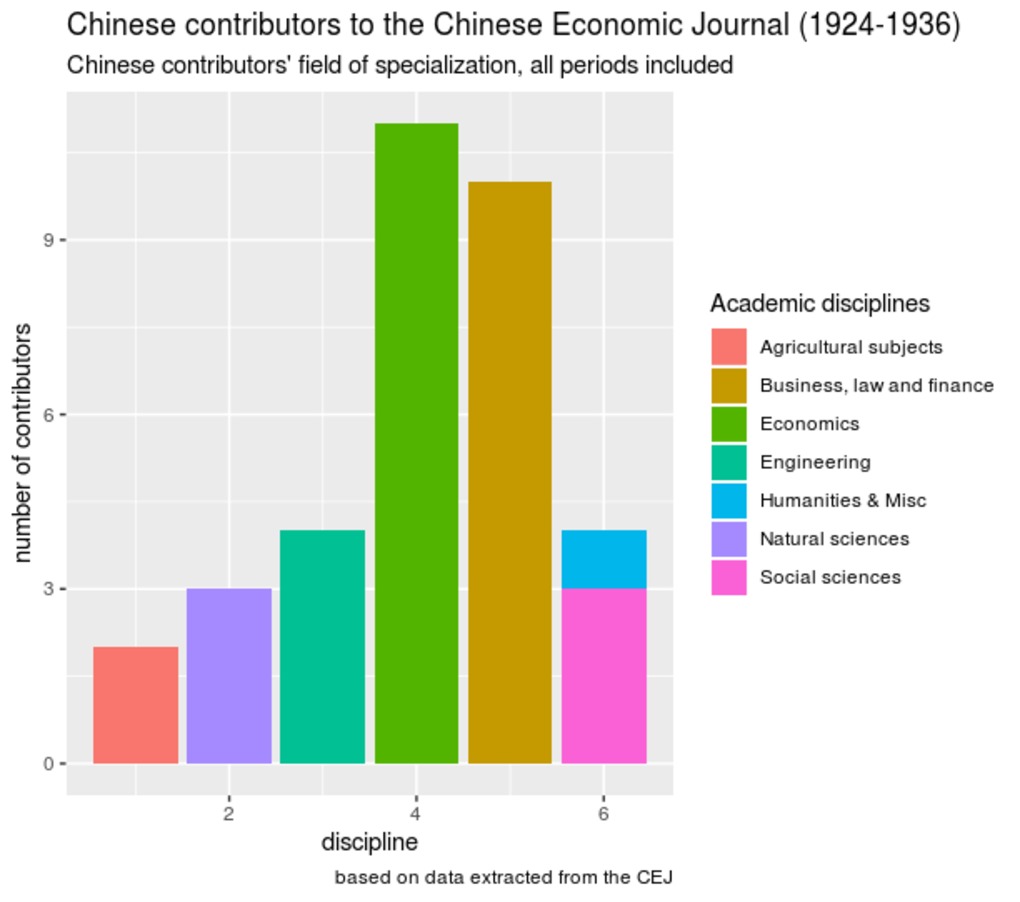 | 353 | Chinese contributors to the Chinese Economic Journal, per period (field of specialization) | Based on the following dataset, the attached graphs explore more specificially Chinese contributors' fields of specialization (the academic disciplines in which they graduated) in the Chinese Economic Monthly/Journal between 1924 and 1936, all periods included (1), and per period (2, 3, 4). Relying on R package "ggplot2", we alternatively used stacked, dodged and faceted bar charts. |
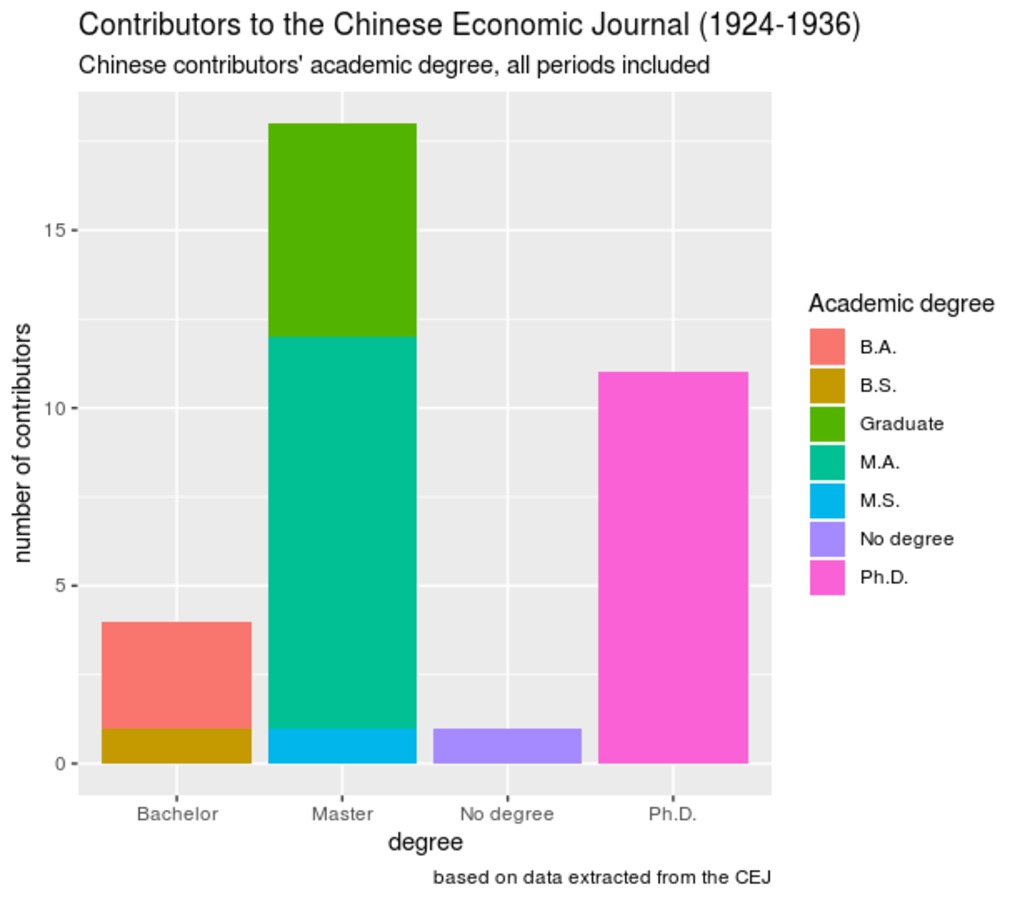 | 355 | Chinese contributors to the Chinese Economic Journal, per period (level of education) | Based on the following dataset, the attached graphs explore Chinese contributors' level of education (the highest academic degrees obtained) in the Chinese Economic Monthly/Journal between 1924 and 1936, all periods included (1), and per period (2, 3, 4). Relying on R package "ggplot2", we alternatively used stacked and dodged bar charts. |
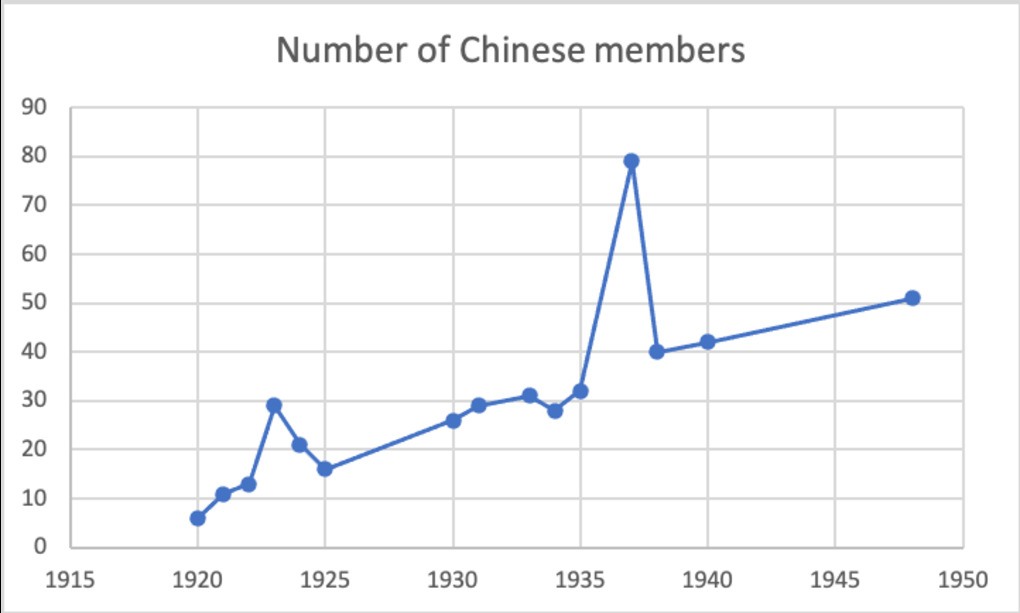 | 385 | Chinese membership in the Rotary Club of Shanghai | The attached graphs show the growth of Chinese membership in the Rotary Club of Shanghai from 1920 to 1948. The first graph reflect the growth in number while the two others show the proportion of Chinese members compared to foreign members and total membership. Data comes from rosters of members and membership lists available in the Archives of Rotary International, Evanston, Ill. The tables used for building the graphs are available in the "Tables" Section. The graphs reveal that Chinese membership increased gradually over time. There was a steady growth between 1920 (only one member, Y.C. Tong) and 1948 (51 members), with a short peak in 1937 (80). In the aftermath of the outbreak of the Sino-Japanese war in August 1937, Chinese membership declined significantly. It was halved during the first year of the war, falling to 40 members in 1938, 43 in 1939 and finally 30 in 1945. During the postwar years, however, the incorporation of members resumed, and Chinese membership climbed to 51 members in July 1948, a few months before the establishment of the Chinese-speaking Rotary Club of Shanghai West. The growth of Chinese membership is even more striking when compared to the total membership. On average, Chinese members represented 29% of all Shanghai Rotarians during the entire period. While they amounted to less than 20% of the total membership until 1923, their share rose to more than one quarter between 1923 and 1935 (except in 1924, with 18%) and reached a peak just before the outbreak of the war (61%). For the first time, Chinese members represented the majority in the club. This figure fell to 32% in 1938 but rose again to 44% in 1939, 40% in 1945 and 42% in 1948. In the end, the war reversed the proportion of Chinese and foreign members. As many foreigners left the country immediately after the bombings in August 1937, and even more after Pearl Harbor (December 1941), Chinese members remained close to the majority from 1938 onwards. |
 | 399 | Chinese Rotarian officers: number and level of offices | The following graphs examine the number and level of offices that Chinese Rotarians took in the service of the club. We distinguished three main level of service (from bottom to top): committee, board and Rotary International. The two first graphs offer two different ways of visualizing the number of offices taken in relation to the number of officers (graph line and funnel). The third one shows the distribution of offices across the various levels of service while the fourth one examines in more detail the nature of positions. The last graph ranks the top Chinese Rotarian officers based on their respective number of positions in the club. Original data comes principally from Rotary International archives and the table we built for conducting the statistical analyses are available in the "Tables" section. Relying on the rosters and lists of officers available in Rotary archives, we identified 69 Chinese Rotarians who held 266 positions in the club between 1920 and 1948. While the majority (35) served at the committee level only, twenty-eight members took higher positions as officers or board members, and six were appointed to supreme positions in the organization as Chinese representatives of Rotary International (RI) in Chicago, Ill. Early Chinese members took high positions as officers prior to 1930. The first Chinese treasurer was elected in 1920 (Y.C. Tong), the first vice-president in 1926 (Fonc F. Sec), and the first president in 1927 (Luther M. Jee). The level of position increased in the 1930s, with three Chinese presidents elected: Fong F. Sec (1931-2), Percy Chu (1934-5) and W.H. Tan (1937-8). Mid-level positions as committee members also boomed during these years, which means that although all Chinese Rotarians could not reach the highest ranks, a growing number of ordinary members became more actively involved in the life of the club. Individually, forty-seven officers totaled less than five positions, thirteen between five to ten, and four over ten (cf. table 2). Fong Sec ranked first with twenty-seven positions, followed by Percy Kwok (17), Percy Chu (16) and L.M. Jee (10) (cf table 3). There was a strong correlation between the number and the level of positions taken (cf. table 4). Thirty-four Rotarians held sixty-six positions as board members, some of them being reelected for two or more successive years: Percy Chu (1928-35), Fong Sec (1926-35), T.K. Ho (1925-1938), Habin Jsu (1924-6), Percy Kwok (1931-5), V.F. Lam (1925-31), H.C. Mei (1933-35), S.D. Ren (1923, 1935). Four Chinese served as treasurer (10 positions), three of them being reelected three times to that position (K.P. Chen, Percy Chu and V.F. Lam). Over its entire existence (1919-52), the Rotary Club of Shanghai elected five Chinese presidents. Three of them topped the list of the twelve most active officers in the history of the club (L.M. Jee, Fong Sec and Percy Chu). In addition to the four presidents already mentioned (Jee, Fong, Chu, Tan), William Sung was elected the year before the club ceased functioning during the war (1941). He was reelected to that position when the club was reorganized in November 1945. Fong and Chu had previously served as vice-president (Fong in 1926 and 1928, Percy Chu in 1930-1931). The latter also became sergeant-at-arms after retiring as president in 1935. Four presidents were appointed to international positions in the organization. In 1922, Fong was sent as the first Chinese delegate to the Annual Convention of Rotary International (RI) in Los Angeles. He was later elected member of the board of directors of Rotary International (1932-4) and district governor for two consecutive years (1936-8). L.M. Jee was appointed commissioner of Rotary International in China for three consecutive years (1927-30). Although he never took positions in the Rotary Club of Shanghai itself, C.T. Wang was also appointed commissioner of Rotary International and first district governor when the 81st district (covering China and the Philippines) was officially established in 1935. As such, he was specifically in charge of arranging the Annual Convention of Rotary International that took place for the first time in China (Shanghai) in April 1936. During the war, he served as RI advisor to China (1942-6) and was elected board member (1944-6) and even vice-president of Rotary International (1945-6). In the postwar years, he was again appointed district governor (1946-7, 1948-9) and RI advisor for China, Hongkong and Macao (1951-3). W.H. Tan also acted as district governor (1940-1, 1947-8) and governor’s representative (1942) in the war and postwar years. William Sung served briefly as acting district governor in 1941.
|
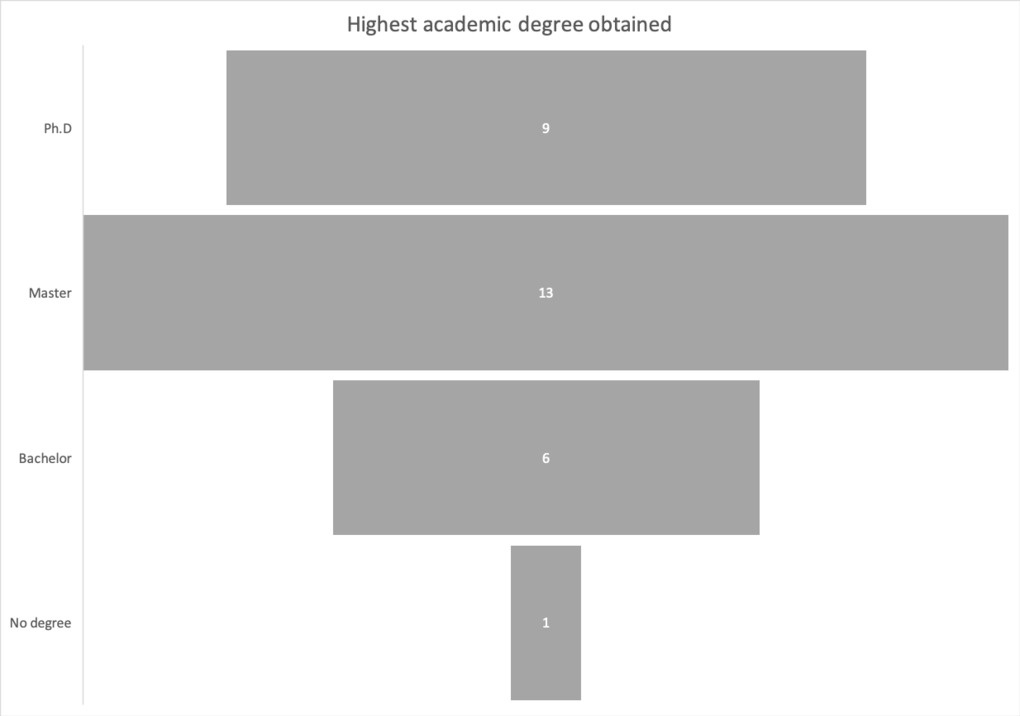 | 394 | Chinese Rotarians: Academic degree | The attached graphs examine Chinese Rotarians' level of education (based on the highest academic degree they earned). Data comes from the series of Who's Who available through the Integrated Information System on Modern and Contemporary Characters (IISMCC) hosted by the Academia Sinica’s Institute of Modern History. The tables used for building the graphs are available in the "Tables" Section. The graphs reveal the high level of qualifications of Chinese Rotarians, with a remarkably large number of Master and Ph.D graduates.
|
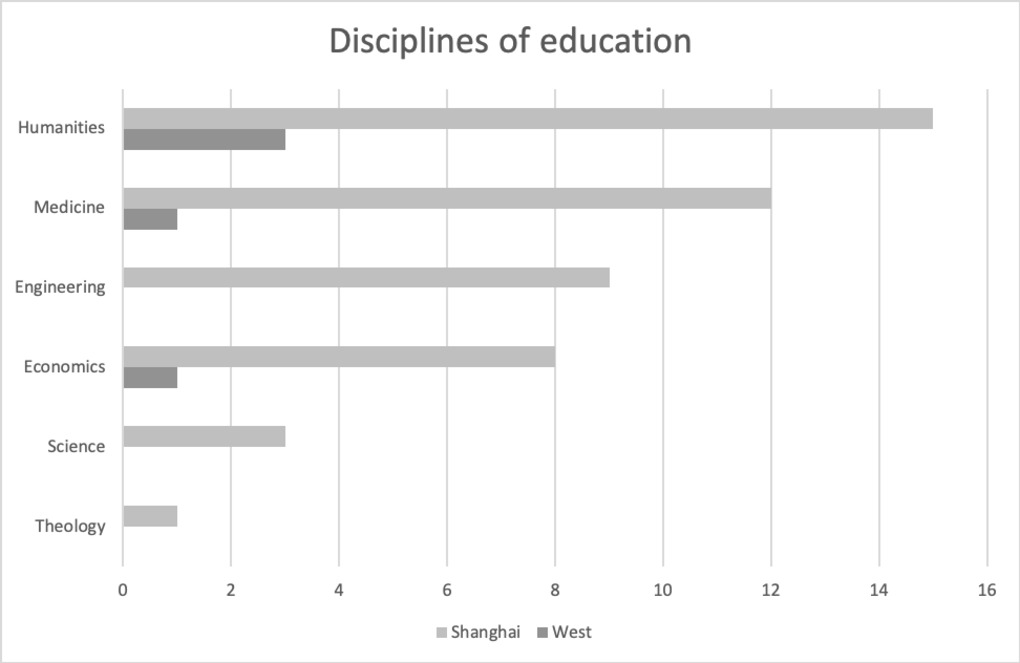 | 395 | Chinese Rotarians: Academic major | The attached graphs examine the discipline in which Chinese Rotarians graduated (based on the highest academic degree they earned). Data comes from the series of Who's Who available through the Integrated Information System on Modern and Contemporary Characters (IISMCC) hosted by the Academia Sinica’s Institute of Modern History. The tables used for building the graphs are available in the "Tables" Section. The graphs reveal that the humanities (foreign languages, education, law, journalism, political science) clearly dominated the educational choices of these "Americanized" Chinese. Medical studies came next due to the overwhelming representation of physicians in the club.
|
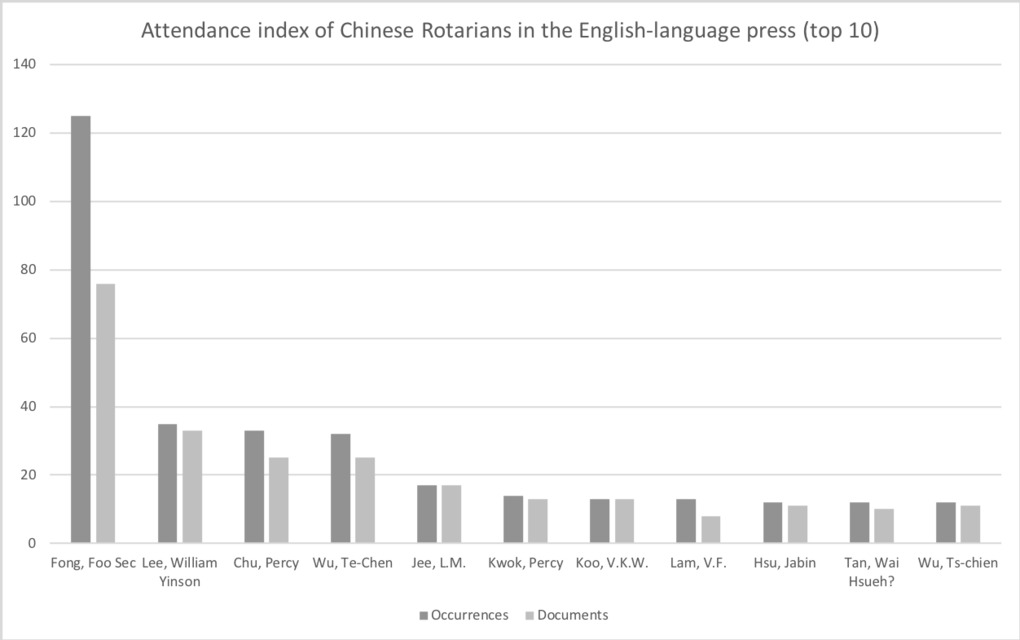 | 404 | Chinese Rotarians: Activity index | The following graphs aim to examine Chinese Rotarians‘ varying degree of involvement in the club, based on their presence in newspaper reports of Rotary meetings. The tabulated data we used for obtaining the graphs is available in the "Tables" section. Our method for measuring the degree of participation into the club consisted in three steps:
The two first graphs show the top 10 and 20 Rotarians mentioned in the press, ranked by decreasing number of occurrences. The two additional graphs retain ambiguous cases, providing a confidence index for ranking the same individuals (top 15 and 20). Building on this activity index, three major groups emerged: eleven “highly active” Rotarians (over 10 occurrences, with Fong Sec. leading far ahead with 75 occurrences), eight “moderately active” (5 to 10), and twenty-two “less active” members (under 5 occurrences). We should add to this list the 67 members who never appeared in newspapers and therefore can be considered as “inactive” or “invisible” members. Unsurprisingly, the varying degree of activity is directly correlated to their service in the club, i.e. the number of and the level of positions they took in Rotary. The index partly reflects the roles that members were expected to play according to the by-laws. For instance, the president was supposed to chair every meeting, and this largely accounts for the high scores of the three presidents Fong, Chu and Jee. The constitution, however, does not explain everything. Our findings reveal irregular cases that point to either discrepancies between the rules and their application, or to inevitable gaps in the available documentation. For instance, president Tan lags far behind less prominent members. Conversely, Wellington Koo, an honorary member who never took any positions in the club and barely attended its regular meetings, nonetheless ranks high on the list. |
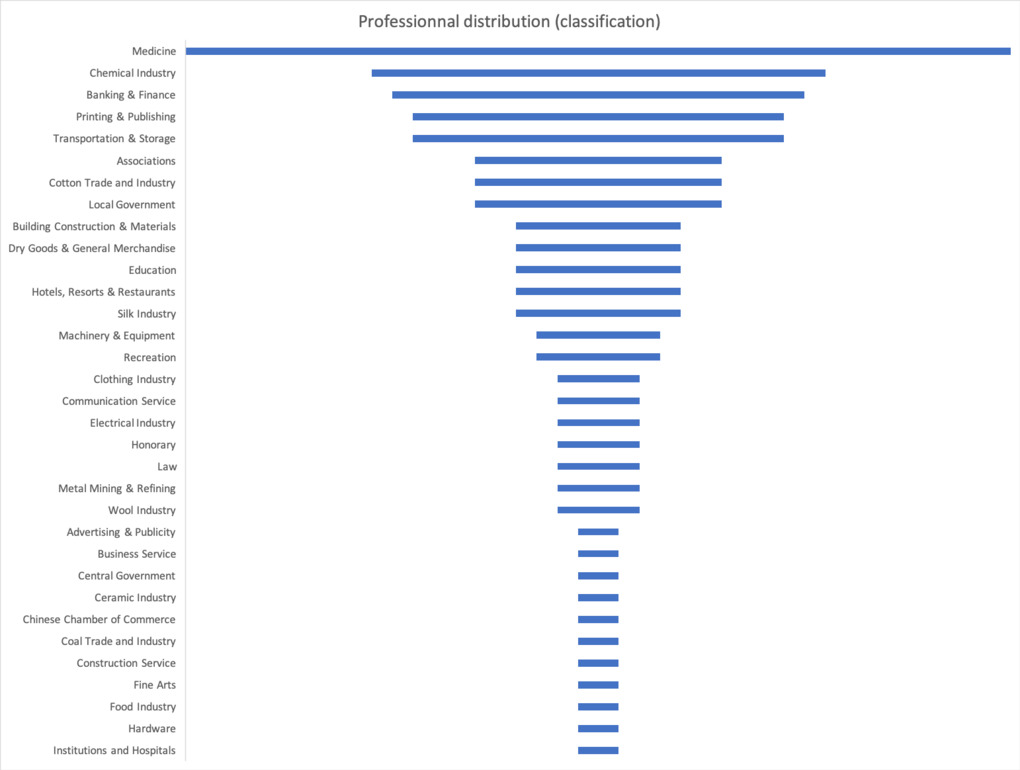 | 387 | Chinese Rotarians: Classification | The attached graphs offer various ways of visualizing the professional distribution of Chinese members of the Rotary Club of Shanghai (funnel, bar charts, tree maps). Our analysis is based on a simplified version of the standard classification of professions devised by Rotary International in the early 1920s. The four first graphs shows the general distribution (all periods included), while the last one shows the distribution of professions across the three major periods we delineated in the history of the club from the perspective of Chinese membership: (1) the beginning of the club and weak Chinese membership prior to 1930 (2) growth of Chinese membership and climax of the club in the 1930s (1930-1937) (3) war and postwar period (1938-1948). Data comes from rosters of members and membership lists available in the Archives of Rotary International, Evanston, Ill. The tables used for building the graphs are available in the "Tables" Section. The graphs reveal that the medical profession was by far the best represented occupation among Chinese Rotarians (20 members, 16%). The chemical industry and financial services (including banking, insurance and savings banks) formed the second largest professional group (11 members, 9% each), followed by printing/publishing (newspapers, publishing houses), and transportation/storage (9 members, 7% each). The fourth group included four main sectors represented by six Rotarians each (5%): the cotton industry, associations, education/hospitals, and local government. The latter referred mostly to officers in the municipality of Greater Shanghai, but there was also one member who worked for the Shanghai Municipal Council and two for the provincial government. The next group (representing less than 5% of Chinese members) comprised five branches of activities that were also well-developed in Shanghai during the Republican period: building construction and materials (including architecture) (five members, 4%), general merchandising (especially department stores), tourism (hotels, restaurants), silk industry (which probably reflected the proximity of Suzhou, major center for silk production), and machinery (four Rotarians, 3% each). Next, recreation (movie theatres) and communication services (radio, advertising) employed three Rotarians each (2%). The last group was made up of less-developed industries that employed two Rotarians each: metal, electrical, wool and clothing. The remaining Rotarians were scattered across miscellaneous sectors: fine arts, ceramic, coal and food industry. Two industrial branches made only a short appearance in the reorganized club in 1945 (grain and tobacco leaf distribution). In addition, there were two lawyers (H.C. Mei and W. Hung) and three honorary members, either government officials (C.T. Wang, Wellington Koo) or Y.M.C.A. leaders (Fong Sec). Although the by-laws stated that “Persons holding elective or appointive public office, for a specified term only, shall not be eligible to active membership as a representative of such office” it is interesting to notice that the Mayor of Shanghai (Wu Tiesheng) was a member of the club while he was in office, and that honorary members C.T. Wang and Wellington Koo were concurrently holding prominent positions in the central government at the time of their membership. The war did not affect much the professional distribution of members, except for the disappearance of the Printing/Publishing class - a longstanding, major sector of activity in Shanghai. After the war, therefore, medicine, the chemical industry, banking/finance and the cotton/textile industry still topped the list in the reorganized club in 1945. There were no major changes in 1948, except that associations had gained in importance due to the postwar reconstruction work, ranking third after medicine and the chemical industry, equaling banking and superseding the cotton industry. What can we draw from this analysis? The classification structure of Chinese Rotarians reflected quite faithfully the local industrial fabric and the social-professional make-up of Chinese elites in Shanghai during the Republican period. Indeed, the Rotary Club of Shanghai functioned as a microcosm of Shanghai business and professional elites, with only one (ideally the best) representative of each branch of activity, as the by-laws requested. It is interesting to notice, however, that some sectors remained utterly missing – especially agriculture-related activities – sectors that were poorly developed in Shanghai and among Chinese Westernized elites more particularly. |
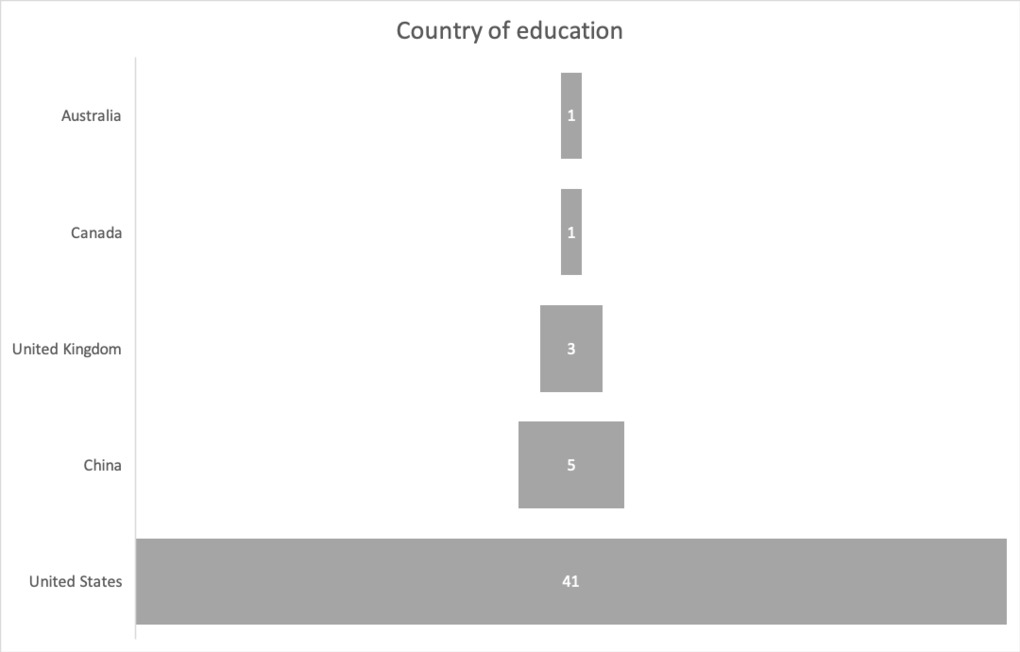 | 392 | Chinese Rotarians: Country of education | The attached graphs offer various ways of visualizing the distribution of Chinese Rotarians' country of education. They reveal the dominance of American-returned students. Data comes from the series of Who's Who available through the Integrated Information System on Modern and Contemporary Characters (IISMCC) hosted by the Academia Sinica’s Institute of Modern History. The tables used for building the graphs are available in the "Tables" Section.
|
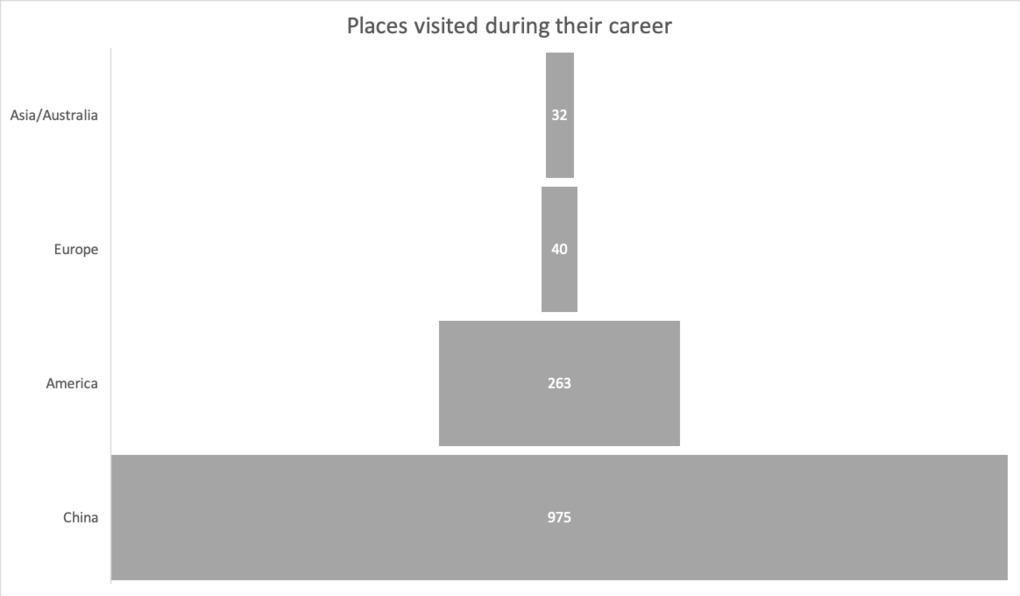 | 398 | Chinese Rotarians: Geographical mobility | The attached graphs aim to examine the geographical mobility of Chinese Rotarians based on the number of different places their visited during their life. Data comes from the series of Who's Who available through the Integrated Information System on Modern and Contemporary Characters (IISMCC) hosted by the Academia Sinica’s Institute of Modern History. The tables used for building the graphs are available in the "Tables" Section. From the graphs, we observe that Chinese Rotarians showed a high degree of geographical mobility during their life, which reflects their multilingual proficiency and their multicultural identity, rooted in their education abroad and for some of them, their overseas background. They traveled a lot not only in foreign countries but also in China proper. Of a total 1310 different places visited by 66 individuals, 75% were located in China (975), 20% (263) in North America (the United States, including Hawaii, and Canada), 40 in Europe, 32 in Asia or Australia (2). Most of them moved from their native place at an early age. Among the most mobile Rotarians, eight worked or lived in over ten different places, and twenty-seven individuals visited from five to ten places.
|