


| ID | Title | Description | |
|---|---|---|---|
 | 258 | Frequency and creativity in Shenbao advertisements (1914) | This graph aims to correlate creativity (measured by the coefficient of variation) (red line) with frequency (blue line) in a given series of advertisements extracted from the Chinese newspaper Shenbao in 1914.The measurements have been made after an extended weekly sample of this newspaper (Jan 7-15, 1914). Though there is a "logical" relation between high frequency and low creativity (Three Castles), advertising series in the Shenbao offered much more complexity in 1914. In effet, this graph actually reveals eleven correlation profiles. |
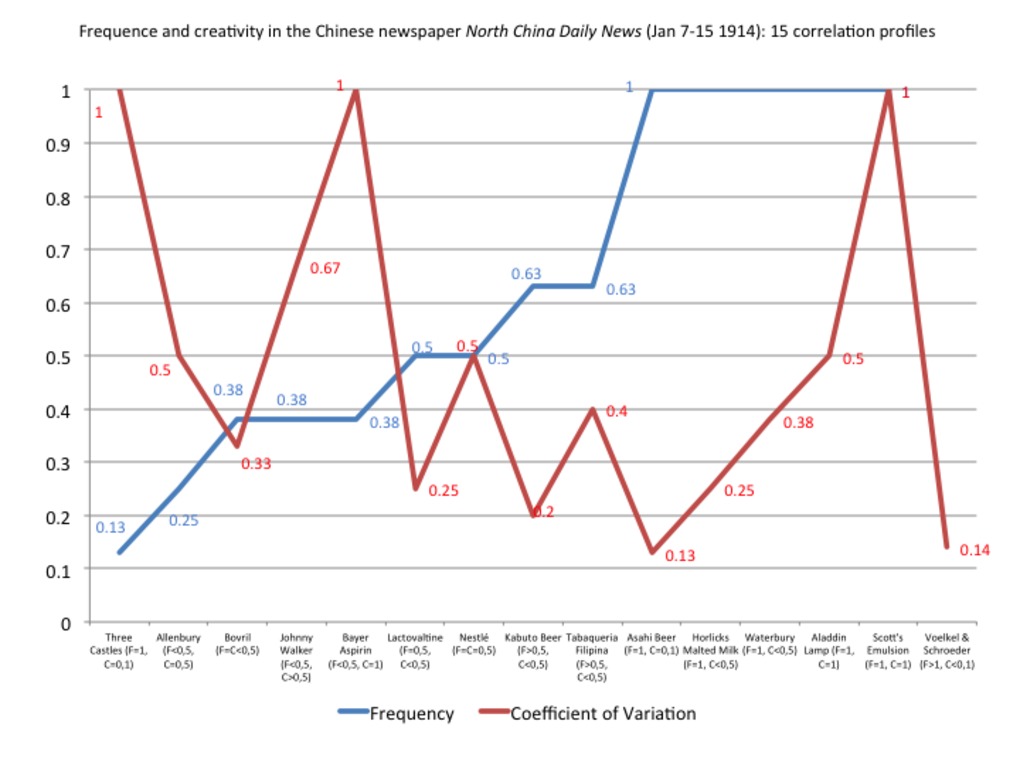 | 259 | Frequency and creativity in North China Daily News advertisements (1914) | This graph aims to correlate creativity (measured by the coefficient of variation) (red line) with frequency (blue line) in a given series of advertisements extracted from the Shanghai-based British newspaper North China Daily News in 1914.The measurements have been made after an extended weekly sample of this newspaper (Jan 7-15, 1914). Though there is a "logical" relation between high frequency and low creativity (Asahi Beer), advertising series in the Shenbao offered much more complexity in 1914. In effet, this graph actually reveals fifteen correlation profiles. |
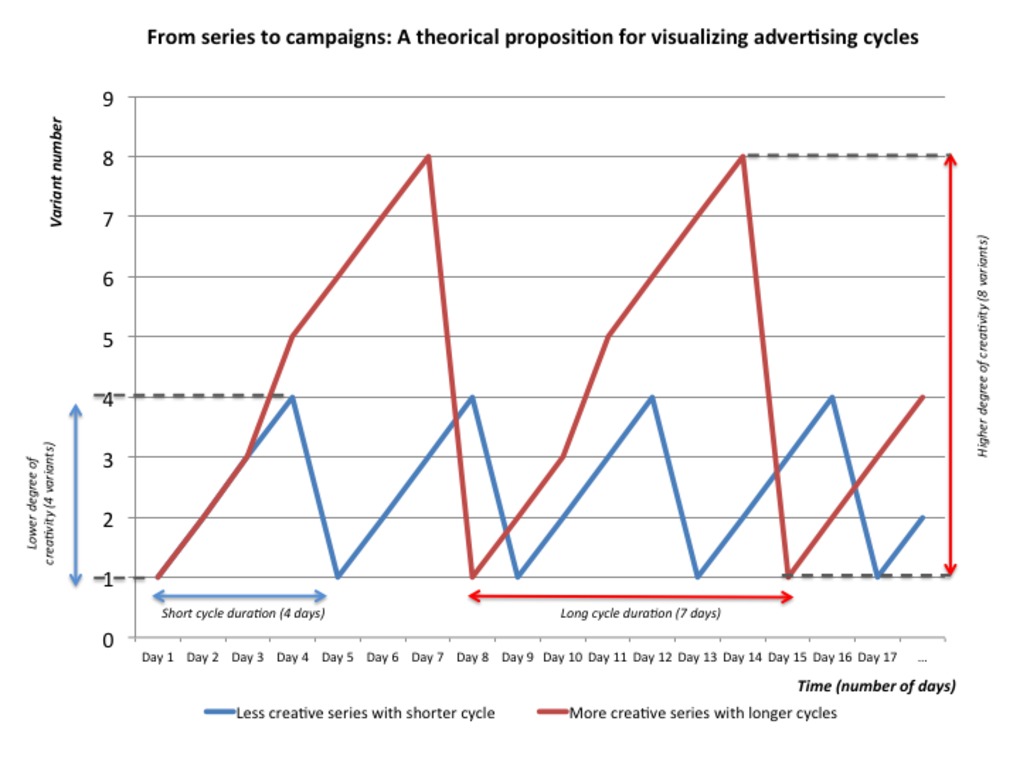 | 260 | From series to campaigns: Modelizing advertising cycles in newspapers | This graph line offers a theoretical model for visualizing advertising cycles in any newspaper - in Shanghai-based newspapers in particular. The "X" axis indicates time (numbers of day/day number), while the "Y" axis measures the number of variants in a given series of advertisements. The length of ondulations (i.e. the distance between two same variants in the series) measures the duration of serial cycles. The amplitude (or height) of ondulations indicates the degree of creativity (measured by the number of variants). The least creative series and shortest cycles are materialized by the blue line, offering the shortest ondulations (4 variants, 4 days). The most creative series and longest cycles may be materialized by the red line: offering the longest and highest ondulations (7 days, 7 variants). The ultimate goal of the model is to trace an entire campaign - a campaign consisting in the collection of all sequential cycles. This is a very simplified model, based on ideal series with daily frequency. Yet all advertisements series are not daily-based. Some may appear two or several times a day, while others may appear only one time a week, or every two, three, four... days. Therefore, this model may be complexified in practice. It needs to be adjusted to each single case study.
|


- RAW DATA
- COOKED DATA
- NARRATIVES
- REFERENCES
- DATABASES
3 documents
return to data set
Contact us
Cécile Armand Institut d'Asie Orientale ENS de Lyon, Site Descartes 15 Parvis René Descartes 69341 Lyon Cedex 07 France Email: cecile.armand@gmail.com
Around the Web
![]()
![]()
![]()