


| ID | Title | Description | |
|---|---|---|---|
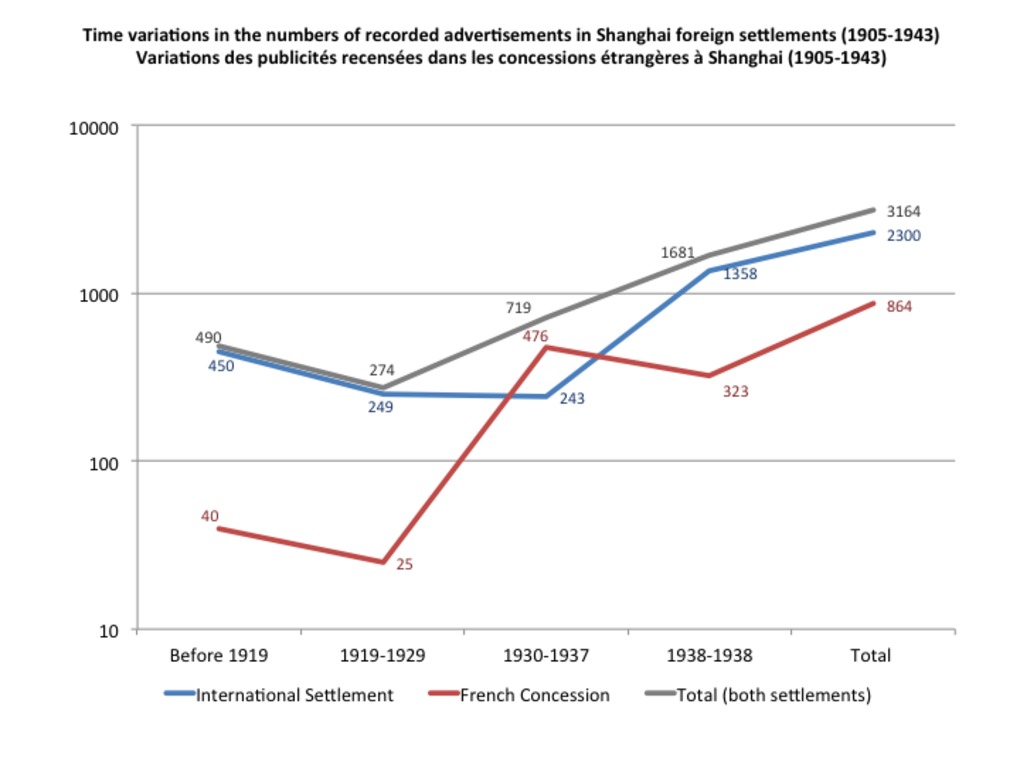 | 225 | Uneven distribution of recorded advertisements in Shanghai foreign settlements (1905-1943) | This set of three lines shows the uneven distribution of recorded advertisements in Shanghai foreign settlements between 1905-1943, in terms of both spatial (unequal documentation between the two settlements) and temporal coverage (variations across time). These curves have been established after the Shanghai municipal archives (hundreds of files in the International Settlement, dozens of files in the French Concession). |
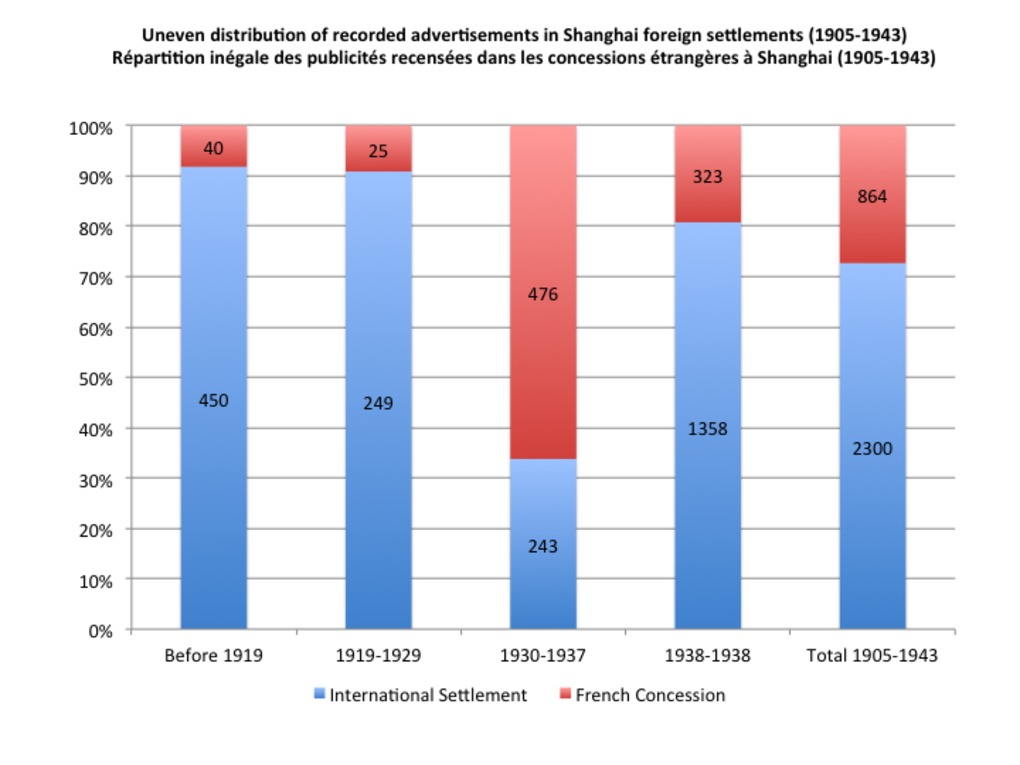 | 224 | Uneven distribution of recorded advertisements in Shanghai foreign settlements (1905-1943) | This set of bar charts shows the uneven distribution of recorded advertisements in Shanghai foreign settlements between 1905-1943, in terms of both spatial (unequal documentation between the two settlements) and temporal coverage (variations across time). These charts have been established after the Shanghai municipal archives (hundreds of files in the International Settlement, dozens of files in the French Concession). |
 | 188 | Une compétition variable selon les secteurs dans les rues de Shanghai (1914-1943) | Cette série de cinq camemberts complète le graphique ci-joint : elle montre le degré variable de concurrence selon les secteurs, à raison d'un camembert par période. Les mesures ont été réalisées à partir des relevés des archives municipales, quantitativement et qualitativement inégaux selon les périodes. On a repris le code couleur et les lettres habituels pour les secteurs. Plus la tranche est large, plus le secteur est concurrentiel : plus le nombre d'acteurs en compétition est élevé. Inversement, plus la tranche est fine, plus le secteur tend au monopole.
|
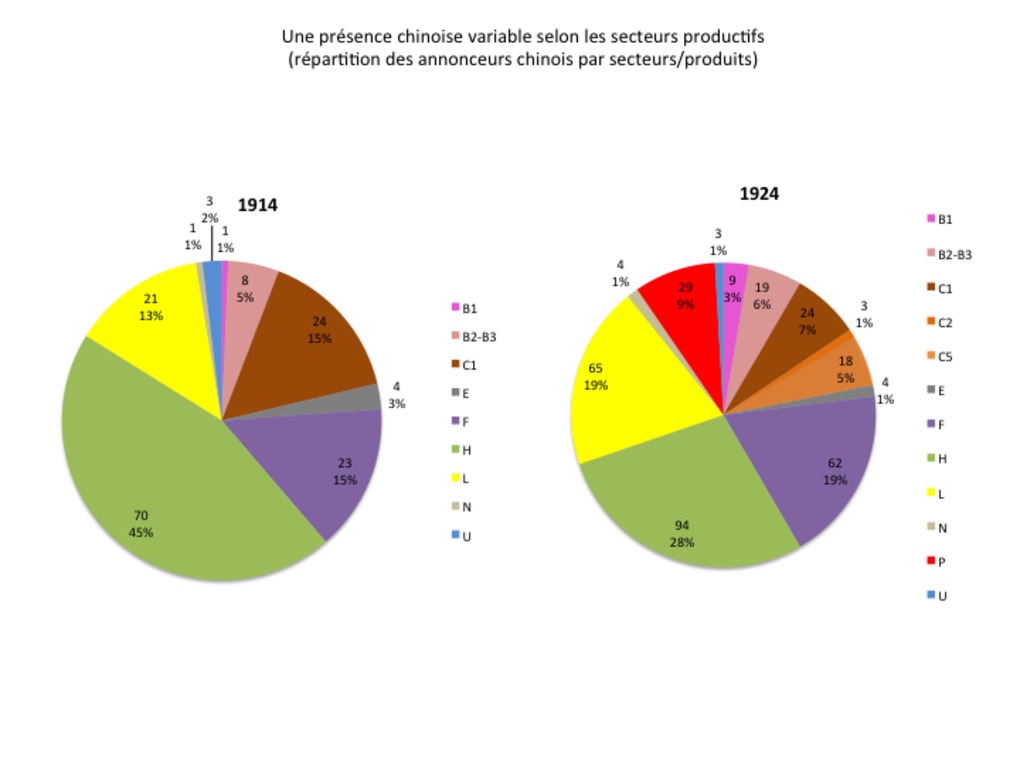 | 170 | Une présence chinoise variable selon les secteurs productifs : répartition des annonceurs chinois par secteurs productifs dans le Shenbao (1914-1949) | Ces cinq camemberts (à raison d'un part échantillon) mesurent la présence inégale des annonceurs chinois selon les secteurs productifs, et l'évolution de cette répartition productive dans le Shenbao entre 1914 et 1949. Les mesures ont été réalisées à partir de nos cinq échantillons habituels du Shenbao (7 janvier 1914, 3 janvier 1924, 5 janvier 1934, 1er février 1941, 1er janvier 1949). On observe que les annonceurs chinois dominent et se maintiennent dans quatre secteurs clés : les médicaments, l'éducation, la finance et les loisirs. Ils régressent dans certains (la finance), conquièrent de nouveaux secteurs (transports et services) tandis que d'autres ne se développent que tardivement et restent secondaires (culture des apparences, industrie). Les années 1930 semblent marquer un tournant pour le système productif chinois. |
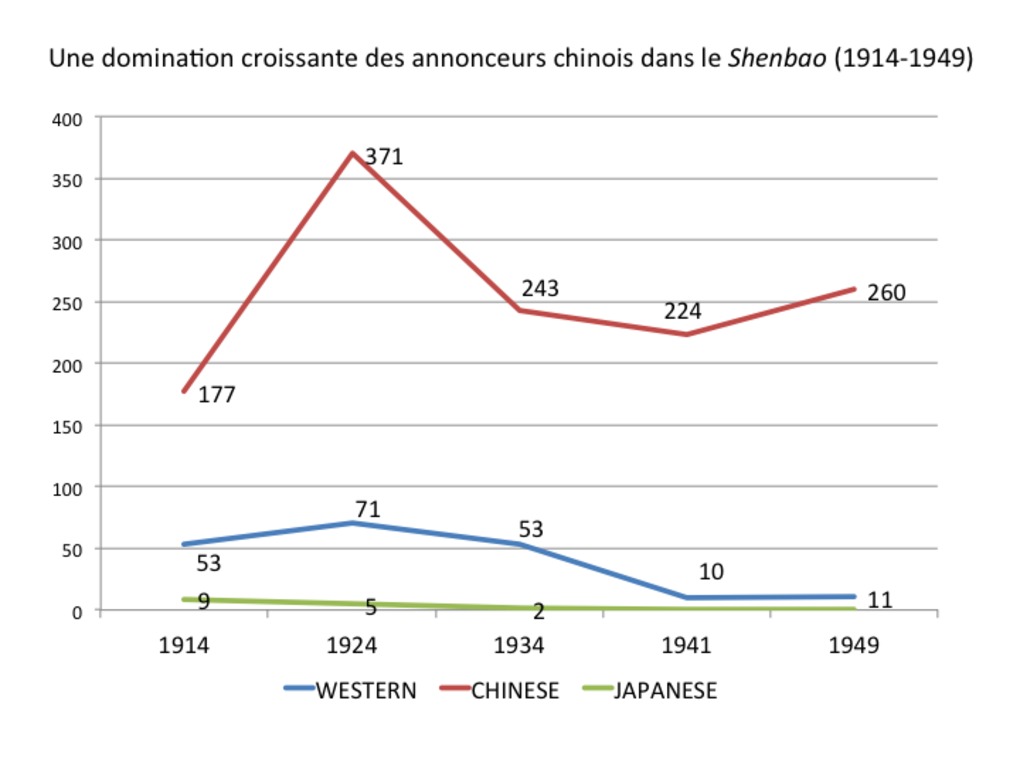 | 169 | Une domination croissante des annonceurs chinois dans le Shenbao (1914-1949) | Ces trois courbes mesurent l'évolution du nombre d'annonceurs chinois (en rouge) et étrangers ("occidentaux" en bleu et japonais en vert) dans le Shenbao entre 1914 et 1949, à partir des cinq échantillons habituels (7 janvier 1914, 3 janvier 1924, 5 janvier 1934, 1er février 1941, 1er janvier 1949). Si les annonceurs chinois dominent déjà largement en 1914, leur supériorité s'affirme et se renforce à partir de 1924, tandis que la présence étrangère décline progressivement, dès 1924-1934 pour les Japonais, et surtout après 1941 pour les Occidentaux. |
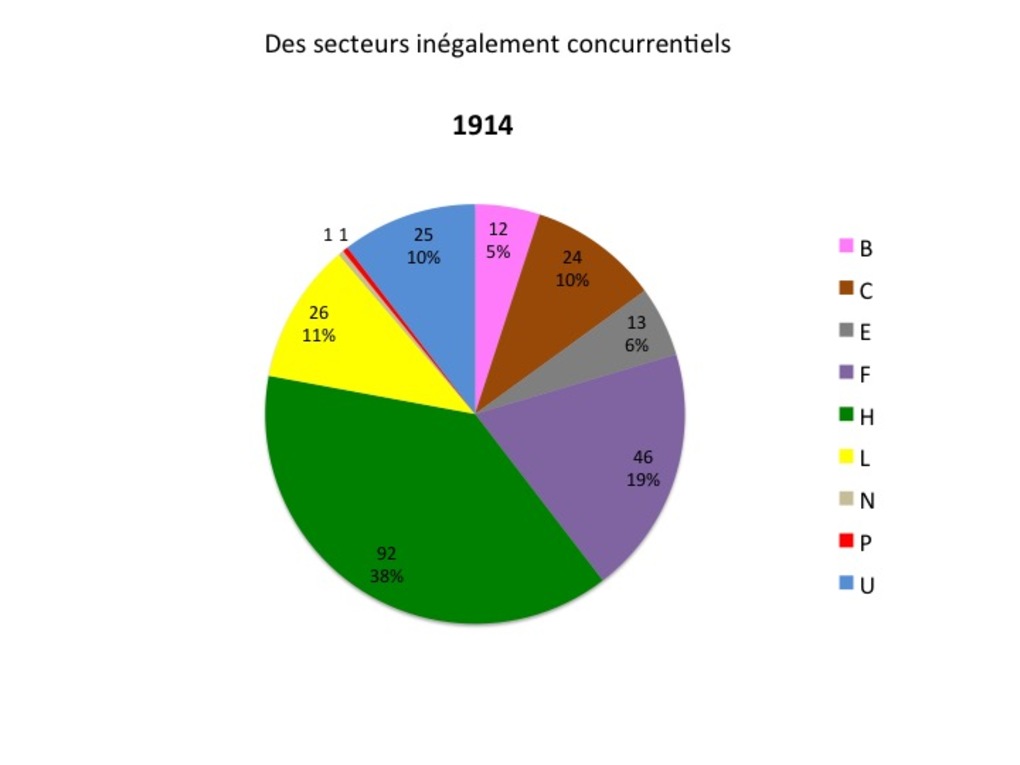 | 154 | Une compétition variable selon les secteurs dans le Shenbao entre 1914 et 1949 | Cette série de cinq camemberts complète le graphique ci-joint : elle montre le degré variable de concurrence selon les secteurs, à raison d'un camembert par échantillon. Les mesures ont été réalisées à partir de nos échantillons habituels : 7 janvier 1914, 3 janvier 1924, 5 janvier 1934, 1er février 1941 et 1er janvier 1949. On a repris le code couleur et les lettres habituels pour les secteurs. Plus la tranche est large, plus le secteur est concurrentiel : plus le nombre d'acteurs en compétition est élevé. Inversement, plus la tranche est fine, plus le secteur tend au monopole.
|
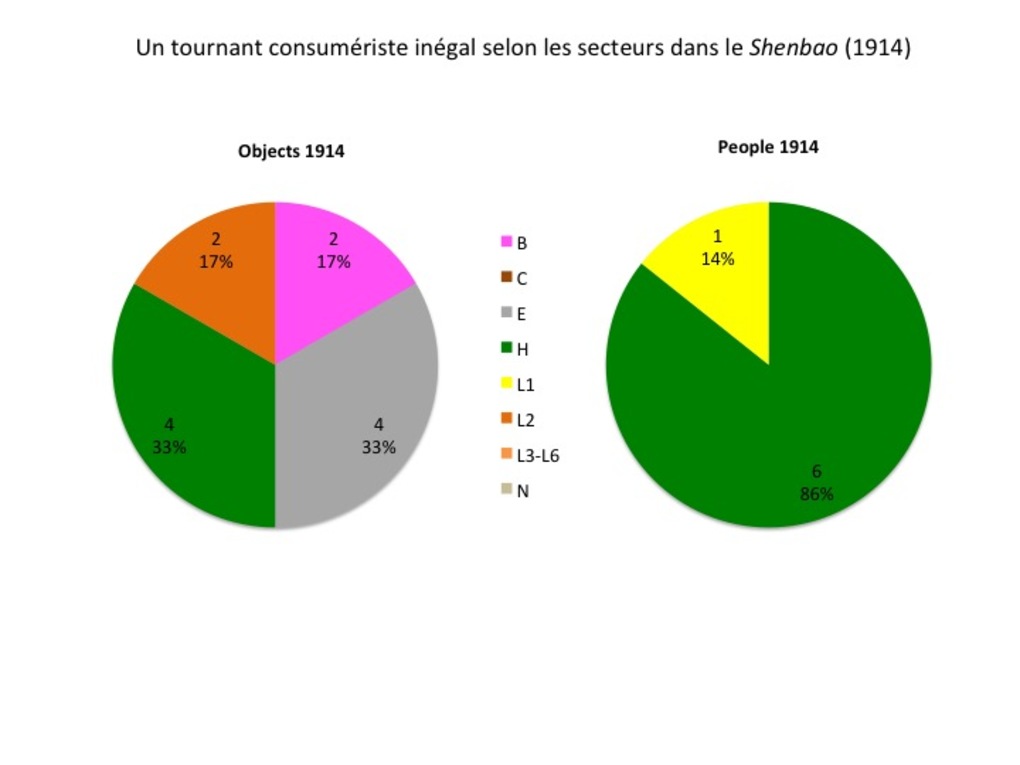 | 117 | Un tournant consumériste inégal selon les secteurs dans le Shenbao (1914-1949) | Etude de la répartition entre secteurs dans les publicités représentant des objets, d'une part, et les publicités humanisées, d'autre part, dans le Shenbao entre 1914 et 1949. Mesures réalisées à partir de nos cinq échantillons de référence du quotidien chinois Shenbao : 1er-30 Janvier 1914 (échantillon volontairement élargi à un mois en raison du faible nombre d'images par numéro), 3 janvier 1924, 5 janvier 1934, 1er février 1941 et 1er janvier 1949. |
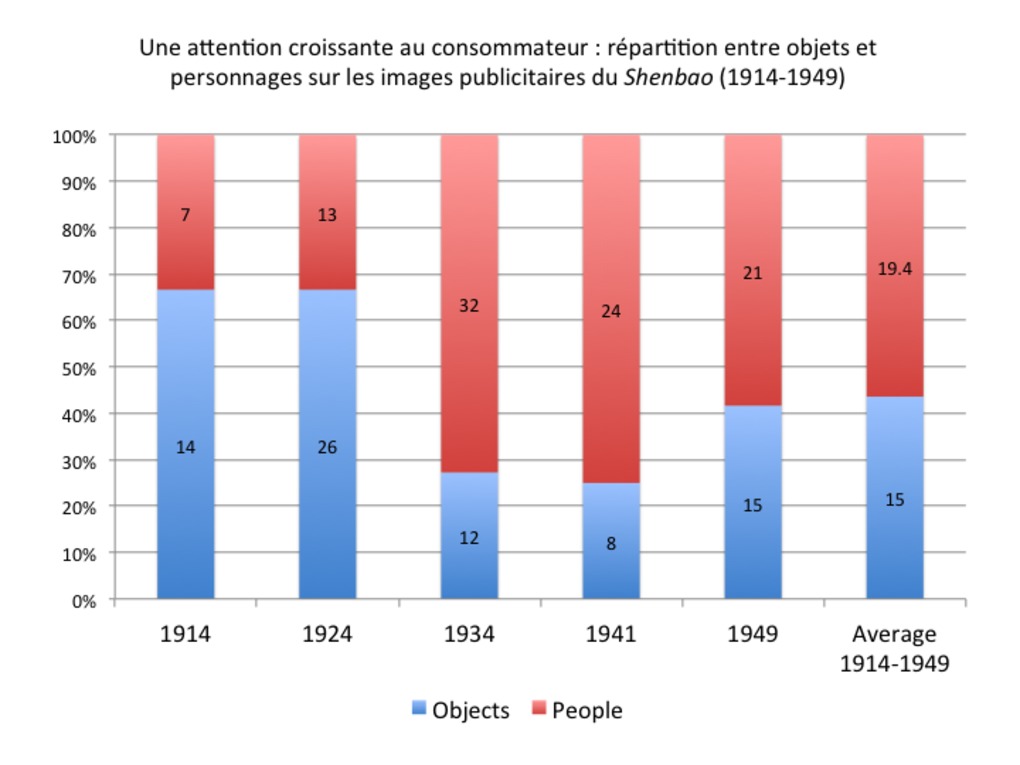 | 116 | Une attention croissante au consommateur : répartition entre objets et personnages sur les images publicitaires du Shenbao (1914-1949) | Etude de la répartition entre objets et personnages sur les images publicitaires du Shenbao (1914-1949). Mesures réalisées à partir de nos cinq échantillons de référence du quotidien chinois Shenbao : 1er-30 Janvier 1914 (échantillon volontairement élargi à un mois en raison du faible nombre d'images par numéro), 3 janvier 1924, 5 janvier 1934, 1er février 1941 et 1er janvier 1949. |


- RAW DATA
- COOKED DATA
- NARRATIVES
- REFERENCES
- DATABASES
8 documents
return to data set
Contact us
Cécile Armand Institut d'Asie Orientale ENS de Lyon, Site Descartes 15 Parvis René Descartes 69341 Lyon Cedex 07 France Email: cecile.armand@gmail.com
Around the Web
![]()
![]()
![]()