


| ID | Title | Description | |
|---|---|---|---|
 | 108 | Number of medicines brands in the Shenbao (1914-1949) | Ces deux courbes visualisent l'évolution de l'offre en cigarette dans le Shenbao entre 1914 et 1949 : la courbe la plus foncée indique le nombre de marques, la plus claire le nombre de compagnies. On observe immédiatement que l'offre croît progressivement entre 1914 et 1934, qu'elle est maximale 1934 et décroît ensuite régulièrement en 1941-1949. L'écart entre les deux courbes en 1934 signifie qu'un nombre réduit de compagnie est en mesure d'offrir un nombre accrue de marque. Il signale une concentration de la production entre une minorité de compagnies. Lorsque l'écart se resserre (en 1914 et 1949 par exemple), chaque compagnie offre individuellement un nombre limité de marques. |
 | 140 | Nature of products advertised in five Chinese dailies (in square inches): Average figures for issues covering 20 days in December 1923 | Ces histogrammes montrent la répartition de l'espace publicitaire entre les différents types de produits dans cinq journaux chinois, dont le Shenbao à Shanghai, sur une période de 20 jours en décembre 1923. Cette étude a été réalisée par les chercheurs de Qinghua en 1923. Ces histogrammes permettent de situer le Shenbao par rapport à d'autres journaux chinois contemporains. Dans la perspective "évolutionniste" des publicitaires et hommes de presse de l'époque, le Shenbao occupe une situation intermédiaire entre les journaux "archaïques" dominés par les "patent medicines" et les journaux "modernes" plus proches des modèles étrangers, où la finance, la culture et les divertissements l'emportent largement sur les médicaments. |
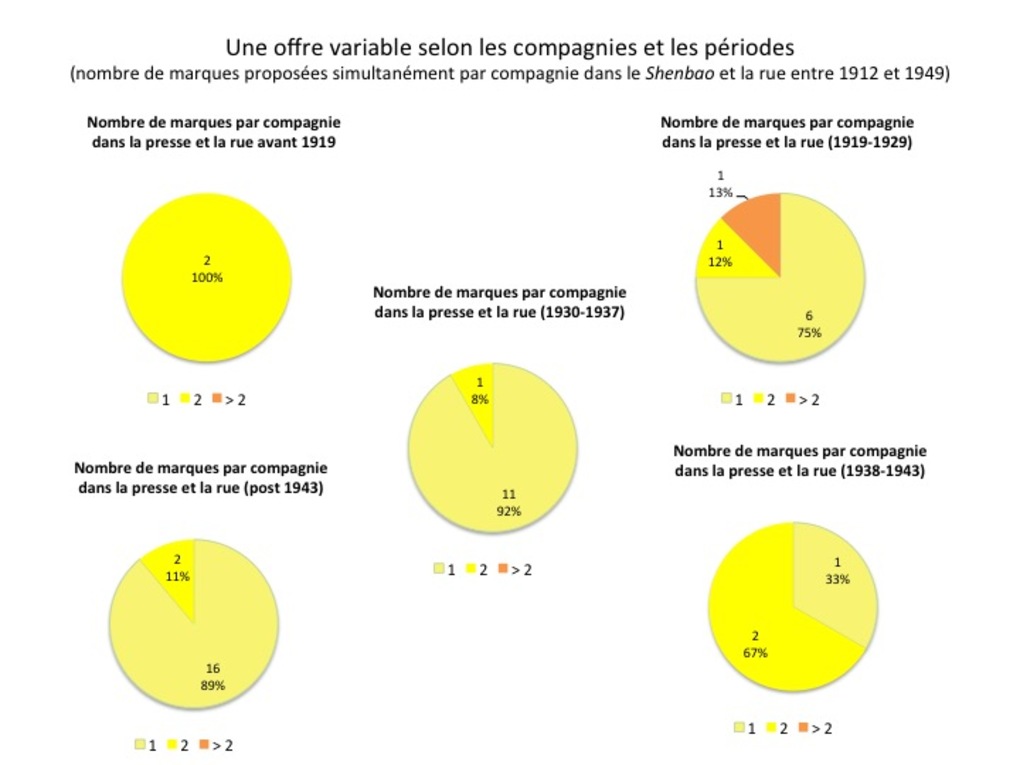 | 183 | Nombre de marques de cigarettes proposées simultanément par chaque compagnie dans le Shenbao et les rues de Shanghai entre 1912 et 1949 | Ces cinq camemberts (à raison d'un par période) visualisent l'évolution du nombre moyen de marques proposées simultanément par chaque compagnie. |
 | 184 | Nombre total de marques de cigarette par compagnie sur la totalité de leur existence dans le Shenbao et dans les rues de Shanghai (1912-1949) | Ce camembert visualise le nombre maximal de marques offertes par chaque compagnie au cours de son existence. |
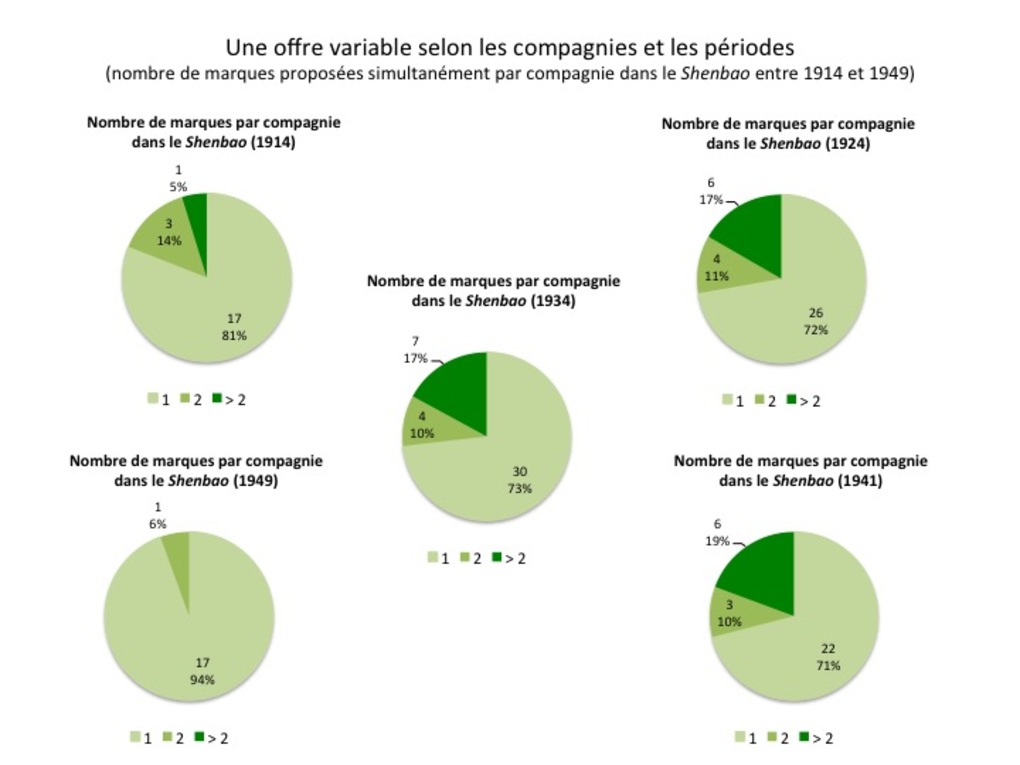 | 186 | Nombre de marques de médicaments proposées simultanément par chaque compagnie dans le Shenbao (1914-1949) | Ces cinq camemberts (à raison d'un par période) visualisent l'évolution du nombre moyen de marques proposées simultanément par chaque compagnie pharmaceutique. |
 | 236 | Number of daily newspapers in Shanghai and China (1929) | This pie charts shows the distribution of daily newspapers published in China between Shanghai and other places in China. Shanghai represents only 4% of daily publications. Yet these figures did not take into account the qualitative importance of the publication (in terms of readership, spatial coverage, longevity or advertising value). Source: Bacon, 1929 (755) |
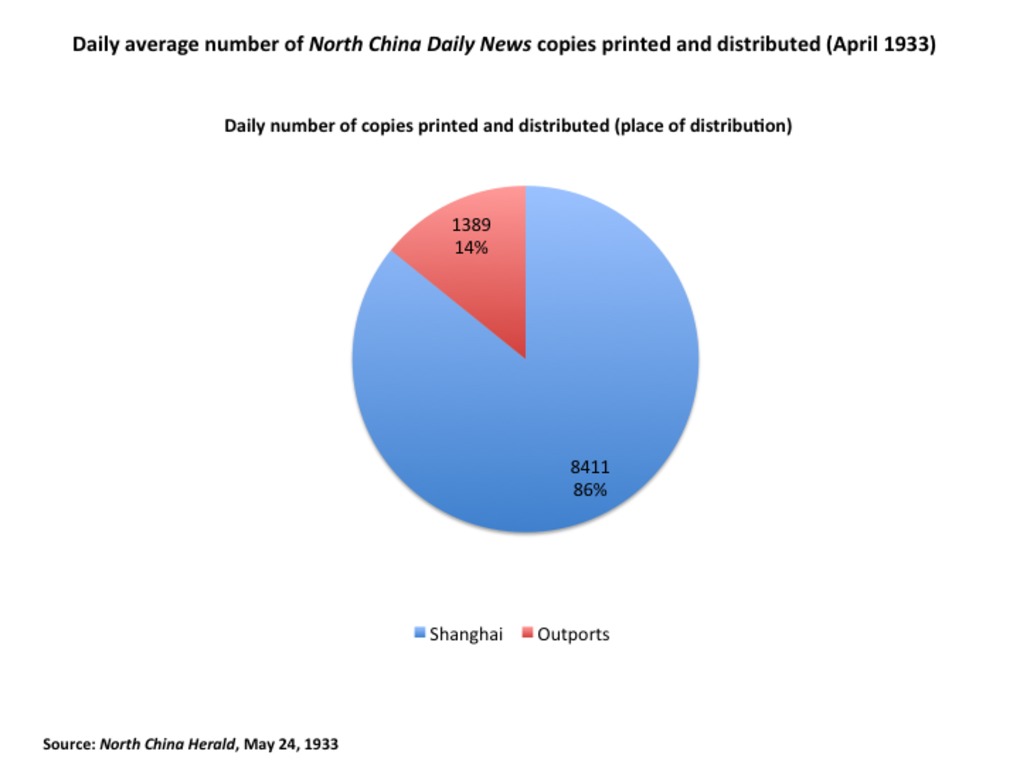 | 303 | North China Daily News circulation: Average daily number of copies printed and distributed (1933) | Source: "A circulation census. Increase in Chinese readers: Distribution Statistics." North China Herald and Supreme Court Gazette. May 24, 1933. |
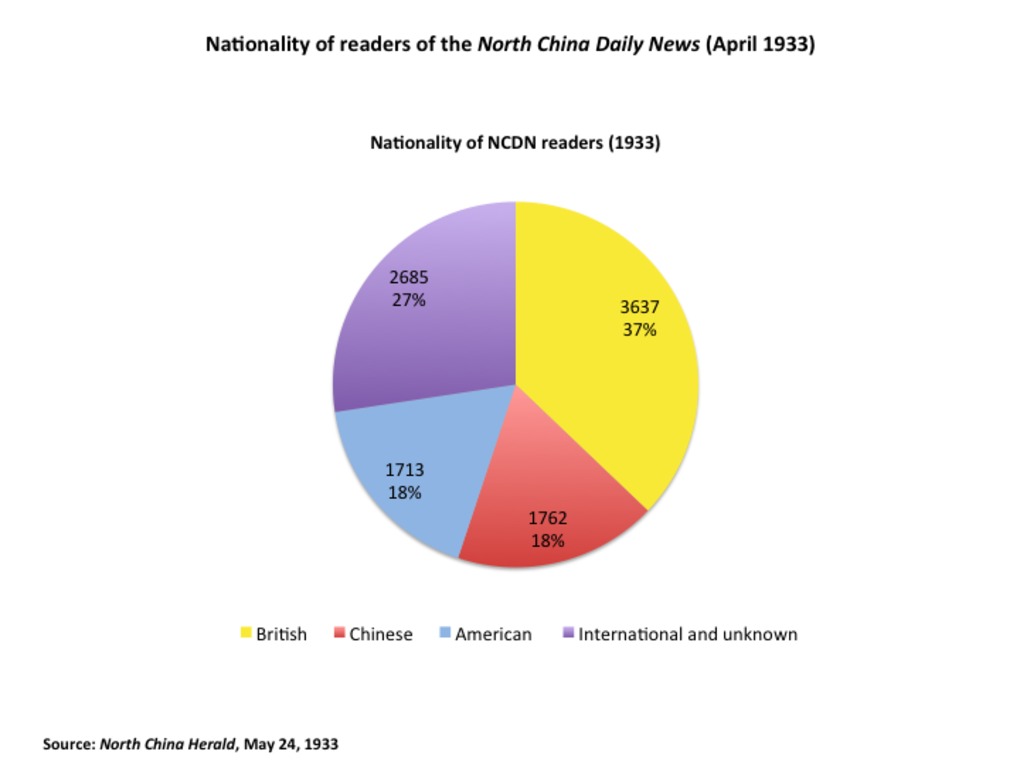 | 304 | North China Daily News circulation: Readers' nationality (1933) | Source: "A circulation census. Increase in Chinese readers: Distribution Statistics." North China Herald and Supreme Court Gazette. May 24, 1933. |
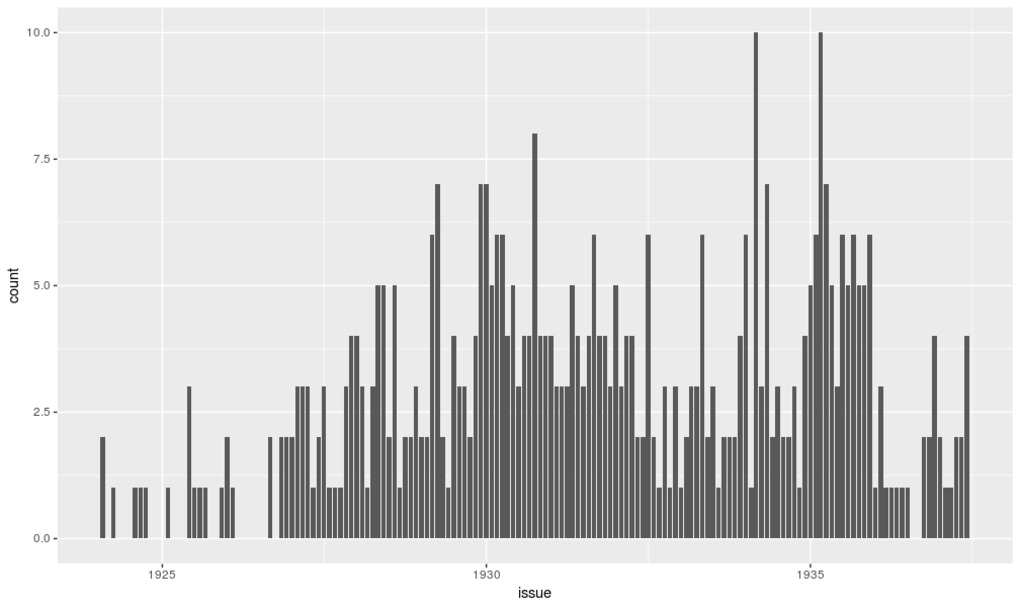 | 342 | Number of articles published in the Chinese Economic Journal, per issue | Based on the following dataset, the attached graphs visualize the number of articles published in the Chinese Economic Monthly/Journal between 1924 and 1936. Relying on R package "ggplot2", we propose two main types of visualization - graph lines and bar charts - to explore variations in the number of articles and topics per issue. The code used for classifying topics is described in the notice attached to the original dataset. |
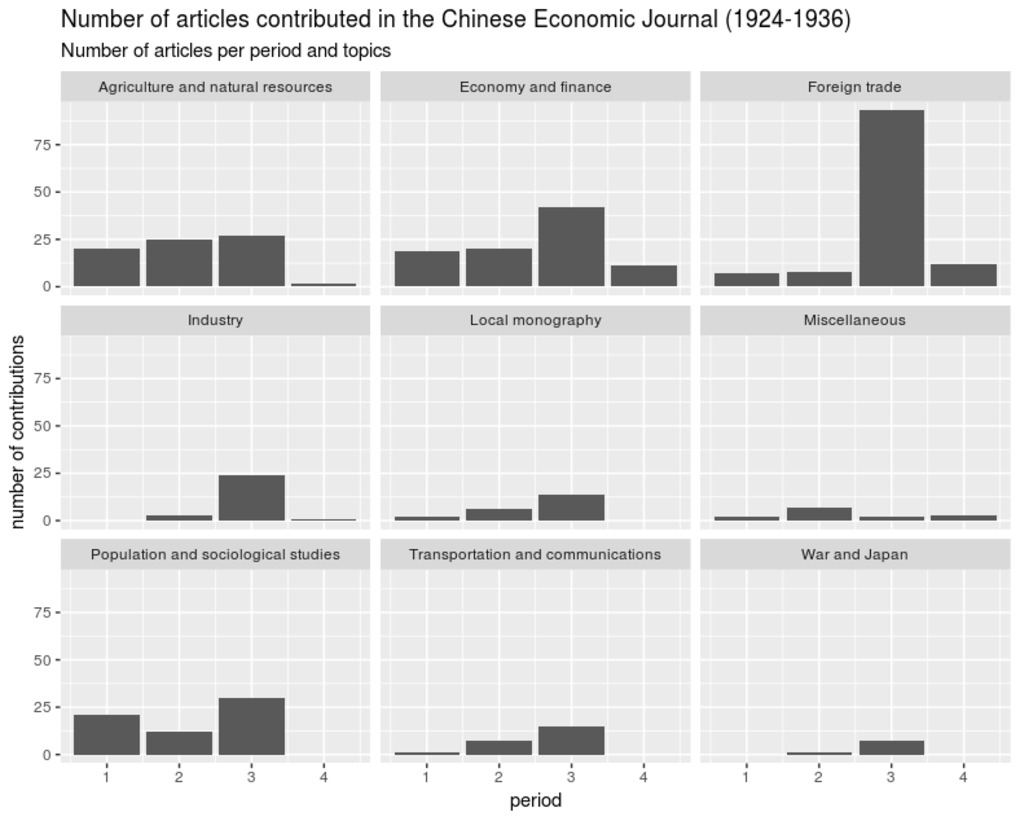 | 343 | Number of articles published in the Chinese Economic Journal, per period | Based on the following dataset, the attached graphs visualize the number of articles published in the Chinese Economic Monthly/Journal between 1924 and 1936. Relying on R package "ggplot2", we used faceted, colored and stacked bar charts to explore variations in the number of articles and topics per period. The codes used for classifying topics and for periodizing the history of the journal are described in the notice attached to the original dataset. |
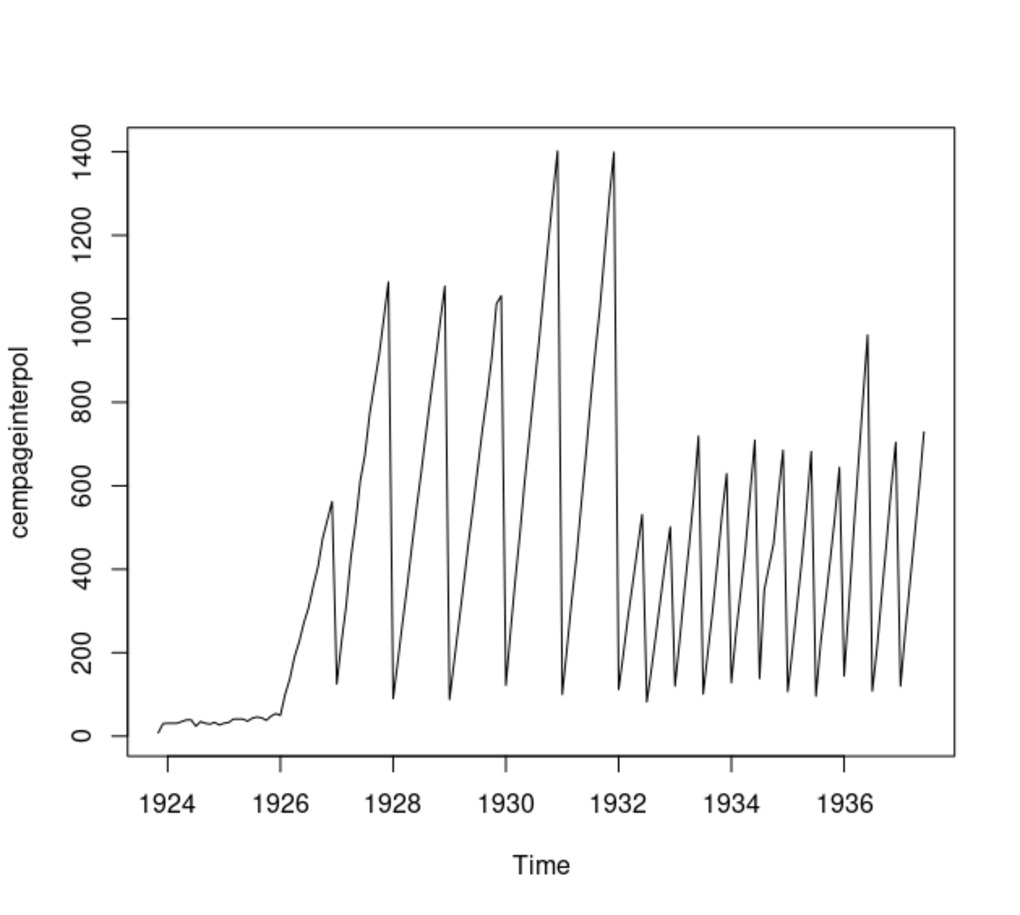 | 384 | Number of pages in the Chinese Economic Journal: A Time Series Analysis | Based on the following dataset, the attached time series trace the evolution in the volume (number of pages per issue) of the Chinese Economic Journal over the period November 1923-June 1937 (inclusive).
|


- RAW DATA
- COOKED DATA
- NARRATIVES
- REFERENCES
- DATABASES
11 documents
return to data set
Contact us
Cécile Armand Institut d'Asie Orientale ENS de Lyon, Site Descartes 15 Parvis René Descartes 69341 Lyon Cedex 07 France Email: cecile.armand@gmail.com
Around the Web
![]()
![]()
![]()