


| ID | Title | Description | |
|---|---|---|---|
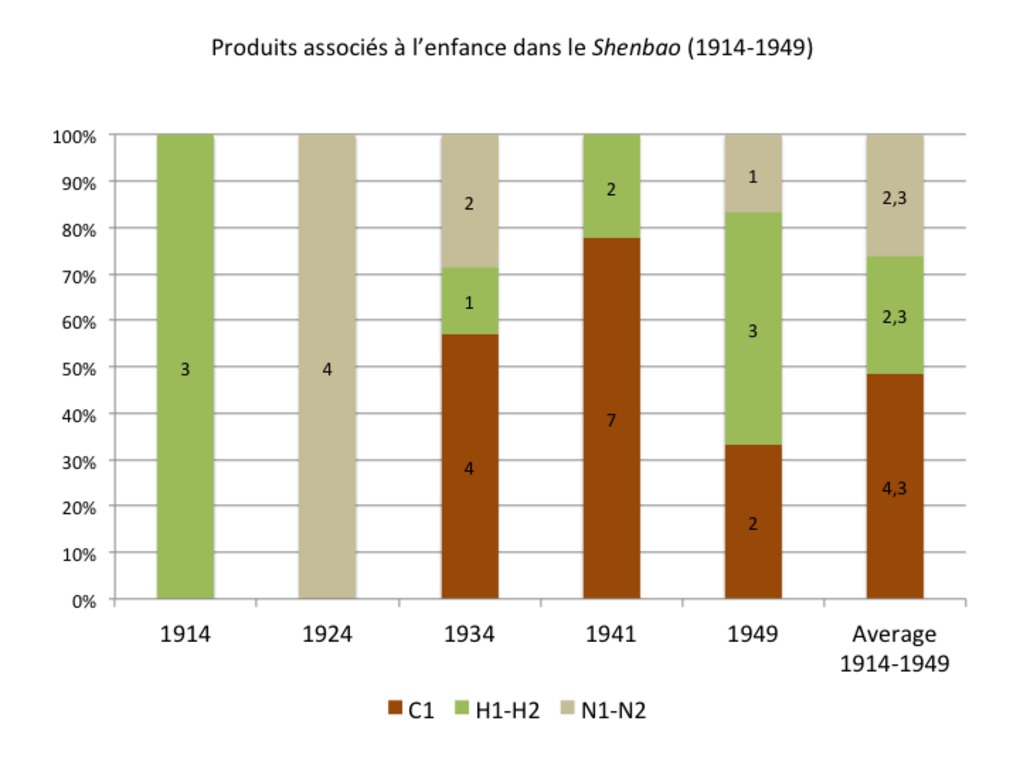 | 124 | Produits associés à l’enfance dans le Shenbao (1914-1949) | Produits associés à l'enfance dans le Shenbao (1914-1949). Mesures réalisées à partir de nos cinq échantillons de référence du quotidien chinois Shenbao : 1er-30 Janvier 1914 (échantillon volontairement élargi à un mois en raison du faible nombre d'images par numéro), 3 janvier 1924, 5 janvier 1934, 1er février 1941 et 1er janvier 1949. |
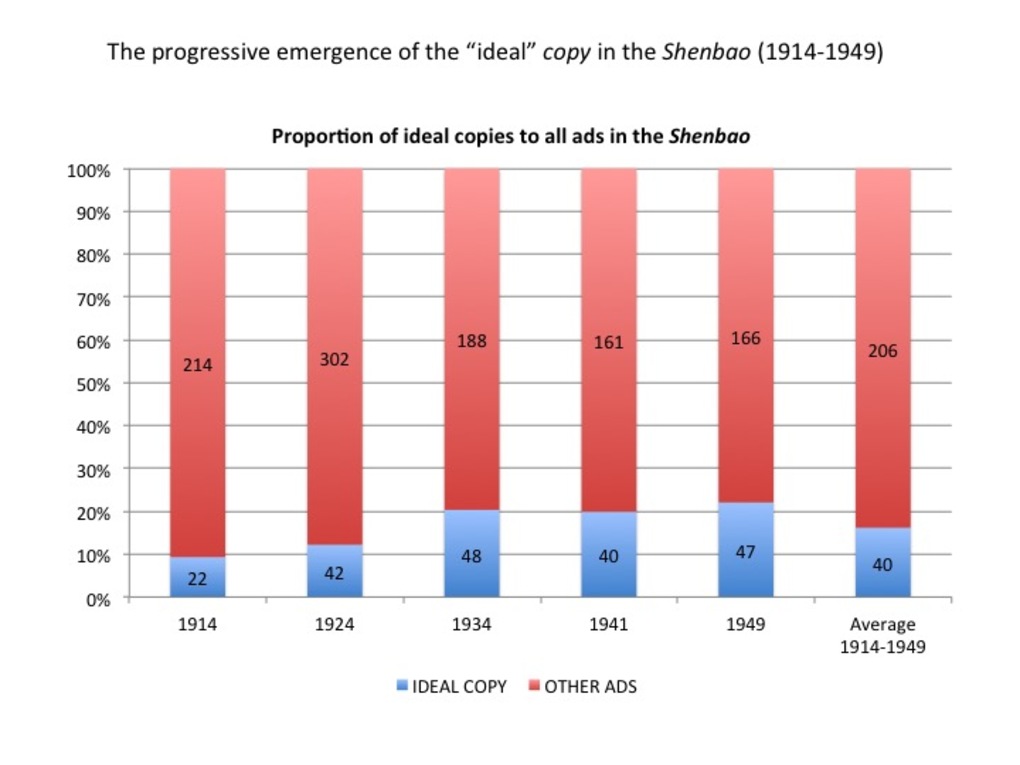 | 195 | Proportion of "ideal copies" to other advertisements in the Shenbao (1914-1949) | Le premier groupe d'histogrammes retrace l'émergence progressive de la "copy" idéale* dans le quotidien Shenbao etre 1914 et 1949 : leur part dans la population publicitaire totale double entre 1914 et 1949, passant de 10% en 1914-1024 à 20% à partir de 1934-1949 (cf. diapo 1). Toutefois, la "copy" modèle reste un idéal, atteint par une minorité de publicités sur la longue durée (15% en moyenne, 20% maximum). Ces chiffres sont légèrement supérieurs lorsqu'on les rapporte aux publicités pour produits "marqués" uniquement, en excluant les publicités scolaires, financières et autres services (cf. diapo 2) : on passe alors de 20% en 1914-1924 à près de 50% en 1934-1949, avec une moyenne de 30% sur la longue durée 1914-1949. Les marques sont donc les plus enclines à suivre le modèle. Toutefois, cette progression n'est pas linéaire : la part de publicités "idéales" régressent en 1949. Faut-il y voir une réduction des moyens investis dans les images en période de crise, ou bien un changement de modèle ? Les mesures ont été réalisées à partir de nos échantillons habituels du Shenbao : 7 janvier 1914, 3 janvier 1924, 5 janvier 1934, 1er février 1941, 1er janvier 1949. *Par "copy" idéale, il faut entendre toute publicité composée d'au moins deux des élement textuels et un des éléments visuels définis dans les manuels publicitaires (cf. chapitre 5 et échelle graduée de la visualité/écarts à la norme dans la section "Drawings"). Rough translation The first set of histograms traces the gradual emergence of the "ideal copy" * in the newspaper Shenbao between 1914 and 1949 : their proportion to the total advertising population doubled between 1914 and 1949 (from 10% in 1914-1924 to 20% in 1934-1949 (slide 1). However, the model copy is an ideal attained by a minority of advertisements only. (average 15%, maximum 20%). These figures are slightly higher when compared with advertisements for branded products only (excluding school advertisements, financial and other services) (slide 2): from 20% in 1914-1924 to 50% en 1934-1949 (an average of 30% in 1914-1949). Branded products appear to be the more liable to follow the "ideal copy" model. Yet there is no linear progression: in 1949, the proportion of "model" ads falls from 50% to 30%. It is because of economic restrictions (costs of paper and impression refraining the use of images), or does it herald the emergence of a new model? These measurements were made from the our usual samples of the Shenbao: January 7, 1914; January 3, 1924; January 5, 1934; February 1, 1941; January 1, 1949. * By "ideal copy", I mean any advertising composed of at least two of the textual elements and one of the visual elements identified by contemporary handbooks (see Chapter 5 and my own scale of visuality/deviations from the ideal copy in the "Drawings" section). |
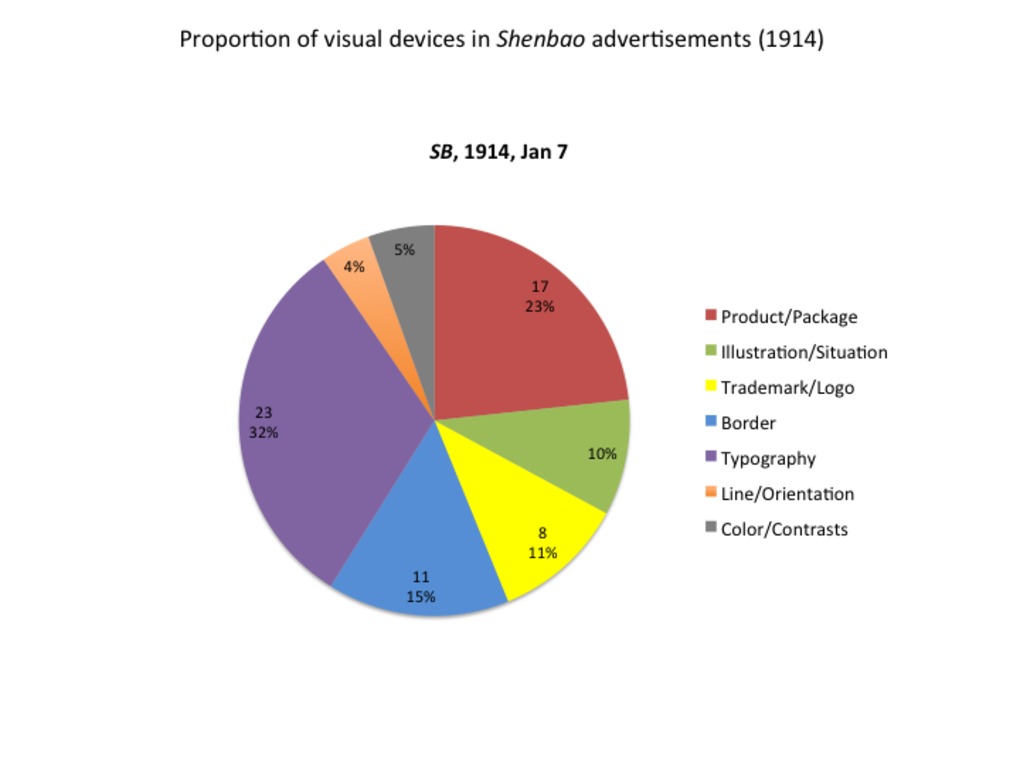 | 204 | Proportion of visual devices in Shenbao advertisements (1914-1949) | La succession des cinq camemberts ci-joints (à raison d'un camembert par échantillon) mesure la part de chaque élément visuel par rapport à l'ensemble des éléments visuels disponibles au copywriter, tels que définis dans les manuels contemporains (Kuai, 1928, Su, 1929, Lu 1940, Wu et Zhu, 1946). Les mesures ont été réalisées à partir de nos échantillons habituels du Shenbao (7 janvier 1914, 3 janvier 1924, 5 janvier 1934, 1er février 1941, 1er janvier 1949). On a ici adopté une définition plus lâche de la copy « idéale », en intégrant les publicités qui présentaient un intérêt du point de vue visuel. Sur ces graphiques, chaque élément visuel est désigné par le code qu'on lui attribué et par une couleur fixe : image du produit/emballage (B1) en rouge ; logo/trademark (B2) en jaune ; situation illustrée (B3) en vert ; bordure (B4) en bleu ; autres dispositifs visuels ou mi visuels (B5) en violet (typographie), orange (lignes, orientation, composition), gris (couleurs et contrastes). Ces cinq camemberts montrent que les images figuratives tendent à stagner voire à décliner (1941) au cours de la période 1914-1949 : si les illustrations (B3) augmentent légèrement de 10% en 1914 à 15% en 1949, les images d’emballage ou de produit (B1) chutent dramatiquement de 23% en 1914 à 9% en 1941, et remontent à 14% en 1949. L’usage des logos (B2) est relativement constant, autour de 10% en moyenne (malgré un creux de 2% en 1934). D’autres dispositifs visuels (bordure, typographie, lignes, contrastes), plus secondaires dans les manuels ou les discours des praticiens, occupent une place croissante dans les publicités du Shenbao, passant de 56% en 1914 à 62% en 1949, avec un pic de 80% en 1924-1934. Certes, les jeux typographiques stagnent voire reculent au cours de la période, passant de 32-34% en 1914-1924 à 19% en 1934 et 10% en 1949. Le travail sur les lignes et le mouvement de l’image et ne touchent que 5% des publicités en moyenne. En revanche, l’usage des bordures (B4) se généralise : leur part double au cours de la période, passant de 15% en 1914 à 30% en 1949. Plus spectaculaires encore, les jeux de contrastes passent de 5% en 1914 à 34% en 1941 (mais retombent à 18% en 1949). Rough translation This set of pie charts measures the proportion of the various visual devices in Shenbao advertisements and their evolution between 1914-1949. Seven "visual devices" have been identified, each one associated to a code (B1, B2, etc) and to a given color: image of the product/package (B1, red), trademark/logo (B2, yellow), illustrated situation/life scene (B3, green), border/frame (B4, blue), and other visual devices (B5): typography/punctuation (purple), line/orientation/composition (orange) and colors/contrasts (grey). The proportion of each device was then measured in the "model" advertisements extracted from our usual five samples of the Shenbao (January 7, 1914; January 3, 1924; January 5, 1934; February 1, 1941; January 1, 1949). The fifth pie charts reveal that paradoxically, the share of figurative images (package or situation) tend to stagnate or even decline across time, at least until 1941 : from 23% in 1914 to 9% in 1941 for images of the package, from 10% in 1914 to 15% (1949) for illustrations. The costs of production of sophisticated images may have forced advertisers to turn towards cheaper visual devices, such as plays on typography (32-34% in 1914-1924, 19% in 1934 and still 10% in 1949), black/white contrasts (from 5% in 1914 to 34% in 1941, still 18% in 1949), borders/frames (from 15% in 1914 to about 30% in 1949, which also reveals an increased competition) and to a lesser extent, lines and composition (average of 5%). The use of trademarks/logos remains quite stable during the whole period (around 10%, after falling to 2% in 1934). |
 | 205 | Proportion of advertisements using various textual devices in the newspaper Shenbao (1914-1949) | Ces histogrammes groupés proposent une première méthode pour mesurer la proportion et l'évolution des éléments textuels dans les publicités du Shenbao entre 1914 et 1949 : ils mesurent le pourcentage de publicités qui comportent l'élément textuel donné, dans chaque échantillon. Les mesures ont été réalisées à partir d'un nombre limité de publicités jugées pertinentes, c’est-à-dire correspondant peu ou prou à la copy « idéale », extraites de nos échantillons habituels : 7 janvier 1914 (27 publicités) ; 3 janvier 1924 (48 publicités) ; 5 janvier 1934 (49 publicités) ; 1er février 1941 (41 publicités) ; 1er janvier 1949 (30 publicités). Sur ces graphiques, chaque élément textuel est désigné par le code qu'on lui attribué plus haut et matérialisé par une couleur fixe : slogan/phrase d'accroche (A2) en rouge ; texte principal (A3) en vert ; nom de marque/produit (A4) en jaune ; nom de la compagnie productrice (A5) en bleu ; adresse ou contact local (A6) en violent ; prix (A7) en orange. Le titre (A1) a été exclu des calculs car toutes les publicités portent un titre. D’après ces histogrammes, on peut distinguer deux ensembles d'éléments textuels :
On obtient des résultats comparables avec les camemberts mesurant la part des éléments textuels par rapport à l'ensemble des dispositifs textuels à disposition du copywriter. |
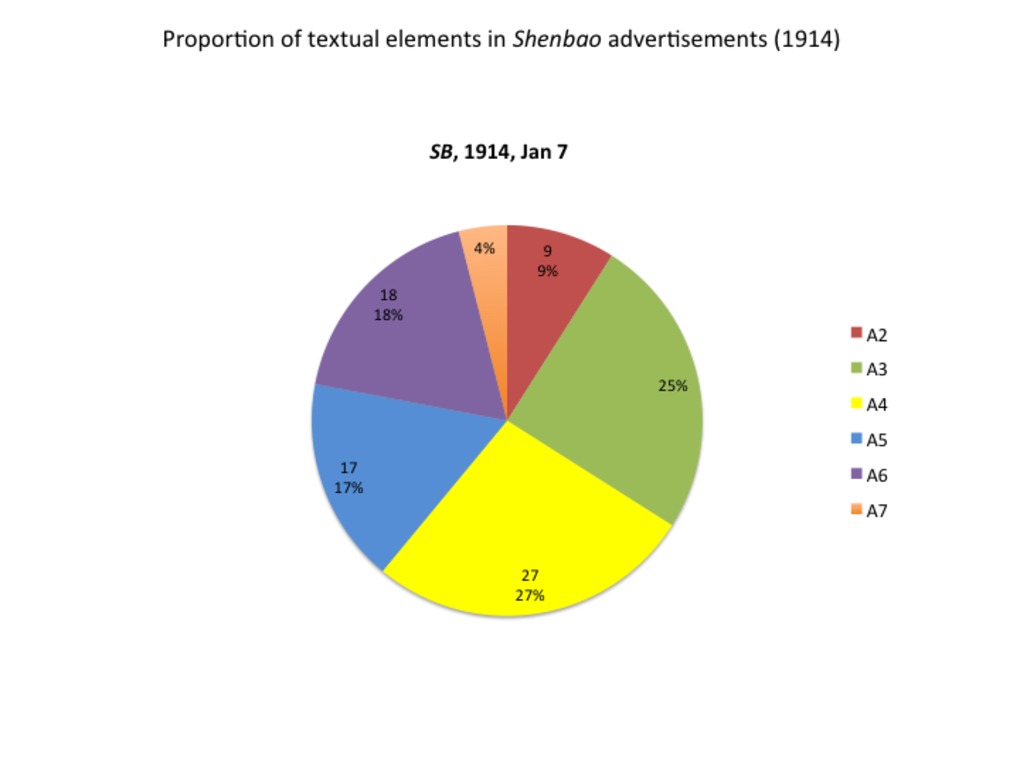 | 206 | Proportion of textual devices in Shenbao advertisements (1914-1949) | Ces cinq camemberts successifs (à raison d'un camembert par échantillon) proposent une deuxième méthode pour mesurer la proportion et l'évolution des éléments textuels dans les publicités du Shenbao entre 1914 et 1949 : ils mesurent la part de chaque élément textuel par rapport à l'ensemble des éléments textuels disponibles au copywriter. Les mesures ont été réalisées à partir d'un nombre limité de publicités jugées pertinentes, c’est-à-dire correspondant peu ou prou à la copy « idéale », extraites de nos échantillons habituels : 7 janvier 1914 (27 publicités) ; 3 janvier 1924 (48 publicités) ; 5 janvier 1934 (49 publicités) ; 1er février 1941 (41 publicités) ; 1er janvier 1949 (30 publicités). Sur ces graphiques, chaque élément textuel est désigné par le code qu'on lui attribué plus haut et matérialisé par une couleur fixe : slogan/phrase d'accroche (A2) en rouge ; texte principal (A3) en vert ; nom de marque/produit (A4) en jaune ; nom de la compagnie productrice (A5) en bleu ; adresse ou contact local (A6) en violent ; prix (A7) en orange. Le titre (A1) a été exclu des calculs car toutes les publicités portent un titre. D'après ces graphiques, trois tranches se dessinent :
On observe enfin deux évolutions notables, qui sont étroitement liées : le recul du texte (A3), qui chute de 25% en 1914 à 15% en 1949, est compensé par le progrès des slogans ou accroches, qui passent de 9% à 20% entre 1914 et 1949. On obtient des résutlats comparables avec les histogrammes associés. |
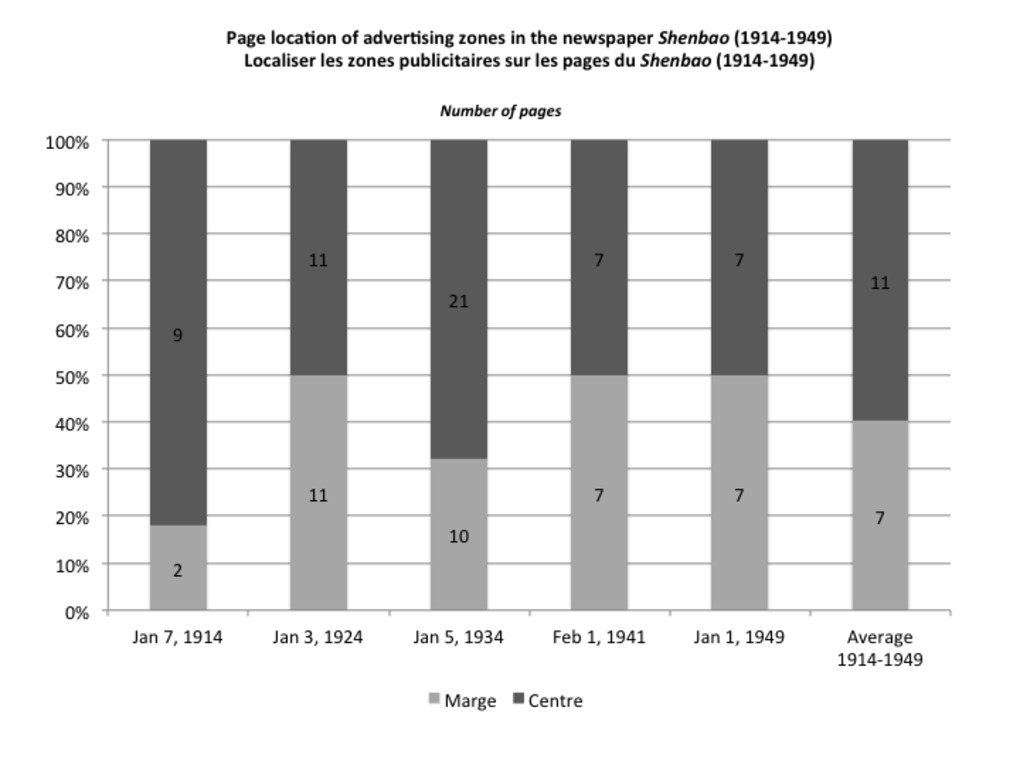 | 213 | Page location of advertising zones in the newspaper Shenbao (1914-1949) | This set of bar charts aim to finely locate advertising zones on each page of the newspaper Shenbao from 1914 to 1949. For that very purpose, two hierarchic types of page location have been identified, according to their actual/visible position on the page, and their presumed capacity to attract the reader's eye. Each one was associated to a given color and number :
N.B. Number "0" and white color stand for restricted zones (no ads). The measurements were made from our five usual samples of the newspaper Shenbao: Jan 7, 1914 ; Jan 3, 1924 ; Jan 5, 1934 ; Feb 1, 1941 ; Jan 1, 1949. |
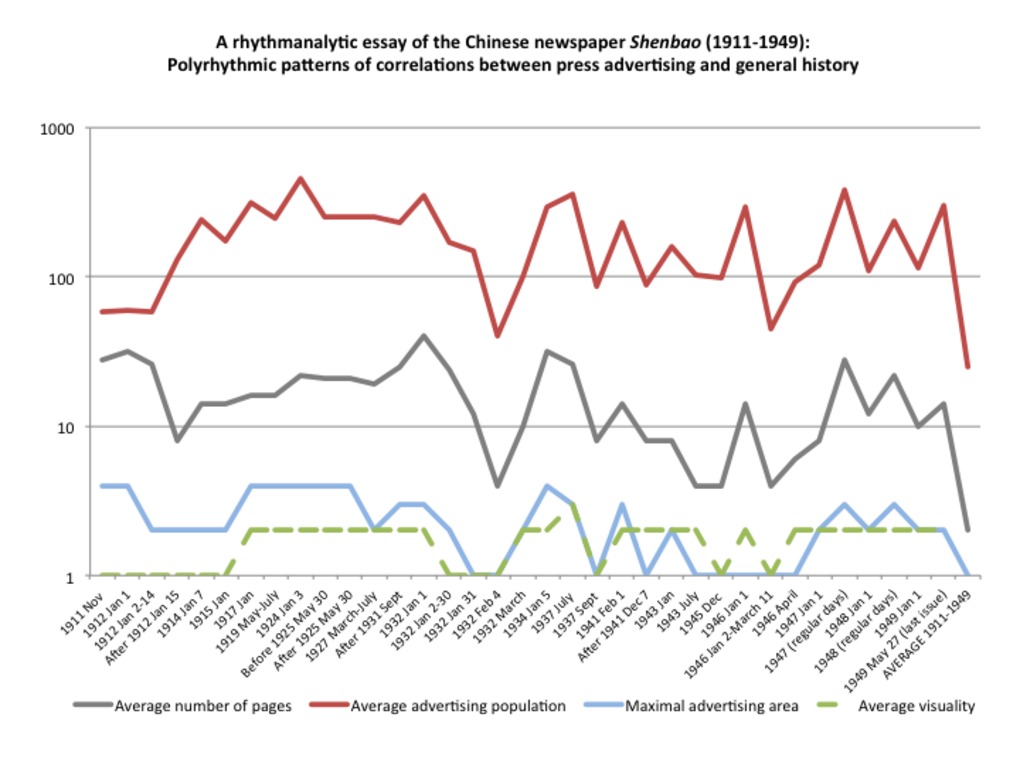 | 279 | Polyrhythmic patterns of correlations between general history and press advertising in the newspapers Shenbao and North China Daily News (1904-1951) | This set of two graphs aims to analyze polyrhythmic patterns of correlations between general history and press advertising. For that very purpose, we have first identified and listed in the related table a series of "conventional" events (i.e. recognized as "major" events in conventional chronologies of Shanghai, China and world history) (See the "Tables" section). For each event, we have then selected a relevant sample of the Chinese newspaper Shenbao and its British counterpart North China Daily (when available) - i.e. an edition published more or less shortly after the selected event. In order to measure the potential effect of each event on newspaper advertising, we have eventually established four material criteria:
Finally, the figures have been visualized on the following graph lines. The first graph traces the lifeline of the Chinese newspaper Shenbao (1911-1949), while the second graph follows the trajectory of the British newspaper North China Daily News (1904-1951). Four main observations emerged from these graphs: 1. The number of pages and ads appeared more directly affected than areas and visuality. 2. The nature, degree, moment and duration of event impact may vary according to specific event. Events impacts are often unpredictable, if not unexpected:
NB It is questionable whether or not contemporary events (for instance, 1925, 1927) can be credited for those changes in newspaper advertising (for instance, the spectacular ten-year expansion between 1925-1935). What these graphs reveal are nothing more than correlations. Yet correlations are not evidence. As any visualization, these tables/graphs may only unveil invisible patterns, open new research questions, and possibly suggest alternative paths of interpretation. By juxtaposing the Shenbao and North China Daily News (NCDN) graphs, two further observations may be made: 3. The chaotic lifeline of the Shenbao suggests that the Chinese newspaper might be more sensitive to historical conjoncture than the British newspaper. In effect, the NCDN enjoyed a remarkable stability until the Second World War (more precisely after the US entered the war in Dec 1941). Then the NCDN so deeply suffered from the war and the restitution of foreign settlements that it never recovered, even though he survived the Chinese newspaper (which ended on May 27, 1949) until March 31, 1951. 4. Despite its higher sensitivity to historical events, the Shenbao eventually managed to overcome recurrent troubles, recovering more or less rapidly after each crisis. That capacity to recover after each crisis may explain the oscillating appearance of the graph line. NB The more cahotic line of the Shenbao may also reflects a distorsion in the method of sampling. As many editions of the North China Daily News are missing, it has not be possible to examine as many samples as we did for the Chinese newspaper Shenbao. |
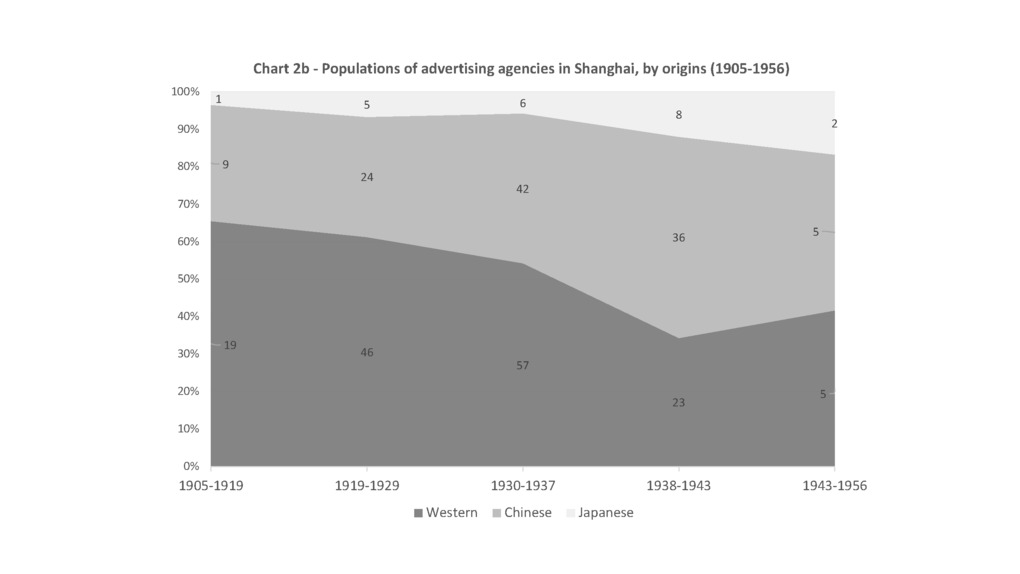 | 317 | Population of advertising agencies in Shanghai by their respective origins | Graph showing the number of advertising agencies in Shanghai, according their respective origins (Western, Chinese, Japanese). The chart particularly reveals the gradual catch-up process by Chinese agencies since the 1930s decade. Source: Banker’s Directory (1935), Hong List (1941), SMA. |
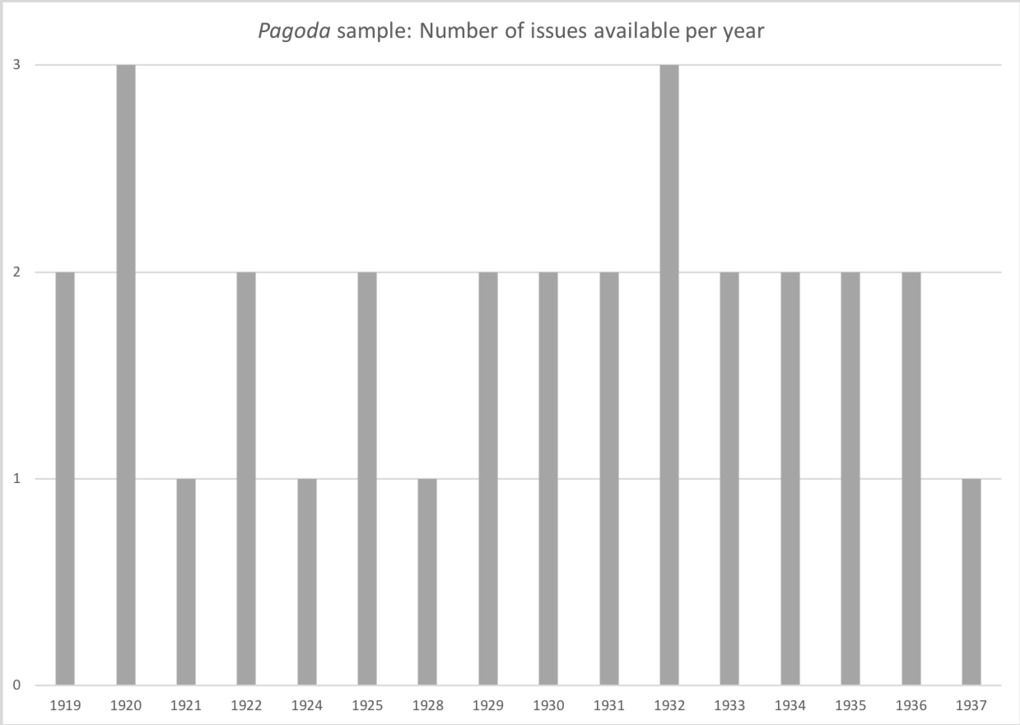 | 401 | Pagoda corpus | The two graphs provides basic information on the corpus of Pagoda we were able to reconstruct from the archives of Rotary International. Pagoda was the official organ of the Rotary Club of Shanghai. Published every week, it represents a rich source we have on the life of the club, providing information on regular meetings (topic and attendance), meetings of the board of directors and special committees, anedoctes on members, information on other clubs in China, and miscellaneous stories. The tabulated data we used for conducting our analyses is available in the "Tables" section. The first graph shows the number of issues available for each year, while the second one shows the number of pages in each issue. Although the existing collection of Pagoda remains incomplete, the thirty-one issues at our disposal are quite regularly distributed over time, with an average of two issues per year between 1919 and 1937, except for the years 1920 and 1932 (two bountiful years with three issues) and four years of scarcity with only one issue available (1921, 1924, 1928, 1937). The number of pages ranges from one in 1919 to fourteen in 1930 and 1934, with an average of ten to twelve. |


- RAW DATA
- COOKED DATA
- NARRATIVES
- REFERENCES
- DATABASES
9 documents
return to data set
Contact us
Cécile Armand Institut d'Asie Orientale ENS de Lyon, Site Descartes 15 Parvis René Descartes 69341 Lyon Cedex 07 France Email: cecile.armand@gmail.com
Around the Web
![]()
![]()
![]()