


 12345
12345 

filter by Title A B C D E F G H I J K L M N O P Q R S T U V W X Y Z [all]
| ID | Title | Description | |
|---|---|---|---|
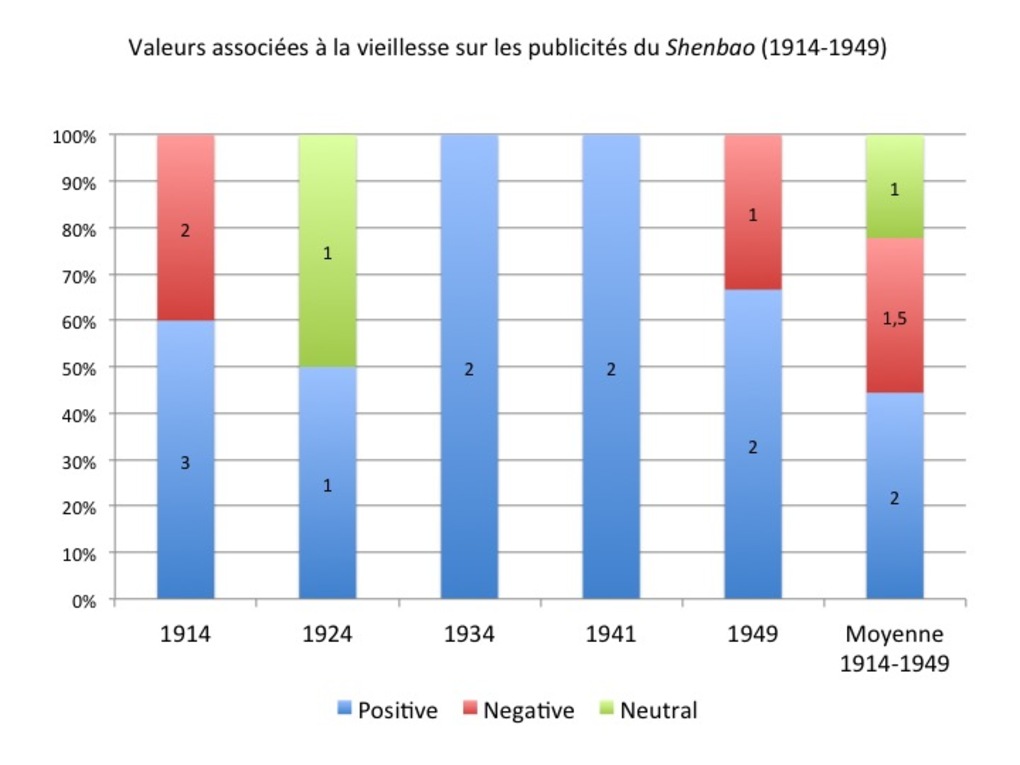 | 127 | Valeurs associées à la vieillesse sur les publicités du Shenbao (1914-1949) | Valeurs associées aux représentations de la vieillesse sur les publicités du Shenbao (1914-1949) : positive (longévité, sagesse, santé, famille, transmission générationnelle), négative (maladie, mort) ou neutre. Mesures réalisées à partir de nos cinq échantillons de référence du quotidien chinois Shenbao : 1er-30 Janvier 1914 (échantillon volontairement élargi à un mois en raison du faible nombre d'images par numéro), 3 janvier 1924, 5 janvier 1934, 1er février 1941 et 1er janvier 1949. |
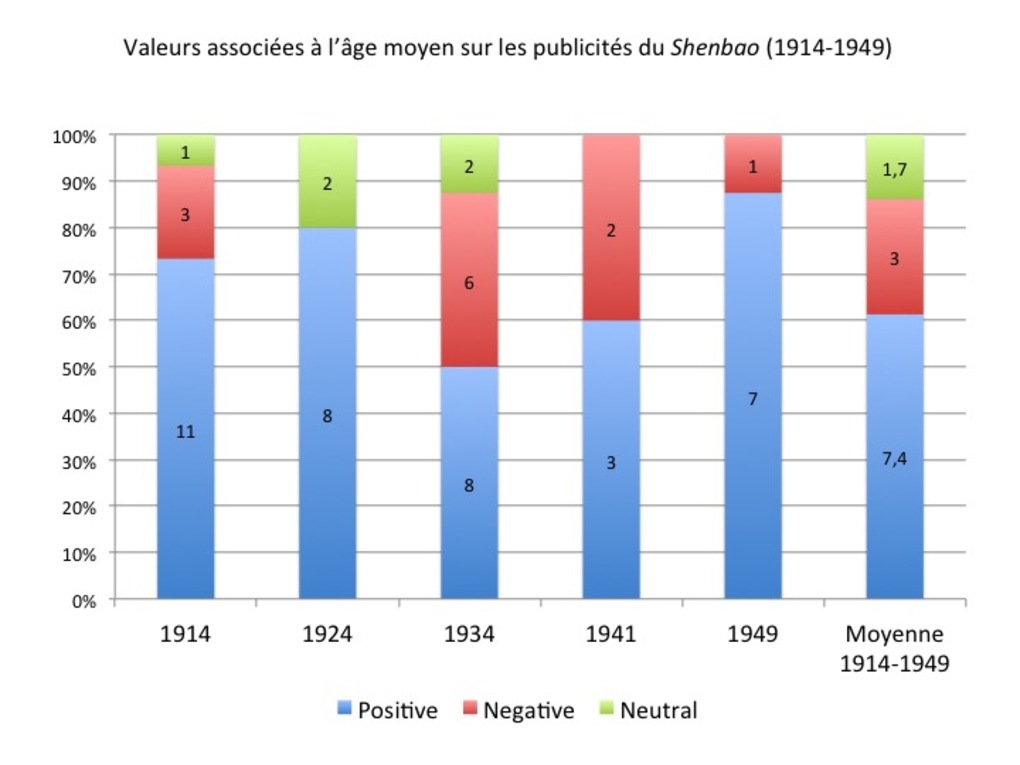 | 128 | Valeurs associées à l'âge adulte sur les publicités du Shenbao (1914-1949) | Valeurs associées aux représentations de l'âge adulte sur les publicités du Shenbao (1914-1949) : positive (jeunesse, force, santé, réussite professionnelle, plaisir), négative (maladie, échec professionnel, déchéance sociale, vieillesse, mort) ou neutre. Mesures réalisées à partir de nos cinq échantillons de référence du quotidien chinois Shenbao : 1er-30 Janvier 1914 (échantillon volontairement élargi à un mois en raison du faible nombre d'images par numéro), 3 janvier 1924, 5 janvier 1934, 1er février 1941 et 1er janvier 1949. |
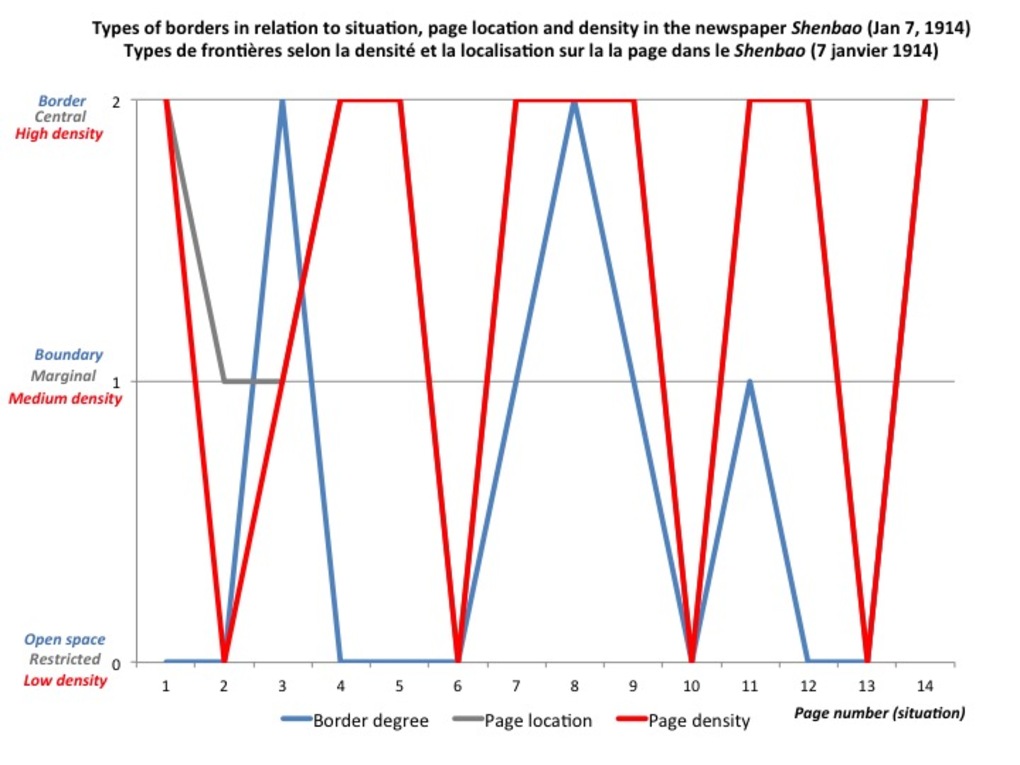 | 217 | Types of advertisement borders correlated to situation, page location and density in the newspaper Shenbao (1914-1949) | This triple line graph aims to correlate types of borders to their situation (page number), page location and to the density of advertisements on each page in our usual samples of the newspaper Shenbao (Jan 7, 1914 ; Jan 3, 1924 ; Jan 5, 1934 ; Feb 1, 1941 ; Jan 1, 1949). The blue line stands for border types, the red line for page density and the grey line for page location. The "X" axis indicates page numbers. The "Y" axis measures either the type of border (0 for open space, 1 for boundary, 2 for border), the density of advertisements on each page (from 0 : < 5 ads/page; 1: between 5 and 10 ads; 2 : > 10 ads/page) or the page location (0 for maginal, 1 for central).
|
 | 238 | Time variations in the recorded advertising population in Shanghai foreign settlements (1905-1943) | This timeline-style bar chart reveals the uneven distribution of recorded advertisements in Shanghai foreign settlements between 1905-1943, in terms of temporal coverage (variations across time). This graph has been established after the Shanghai municipal archives. The last years (1938-1943) are the most well-documented (65% of the recorded population during the entire period), due a huge inventory of the advertising hoardings existing in the International settlement in may 1943 commanded by the Shanghai Municipal. The 1930s are quite well-documented, thanks to the semi-annual lists of neon lights provided to the French Municipal Council by the compagnie Claude Neon Light, Fed. Inc. The 1920s are the least documented years, based on scattered applications for permits. Considering that the advertising business and measuring instruments were are their early stage, the first période (before 1919) is relatively quite well documented. Data for this early period mainly came from the first major census commanded by the Shanghai Municipal Council in 1914, with a view to tax advertising hoardings existing in the International Settlement, based on their surface. |
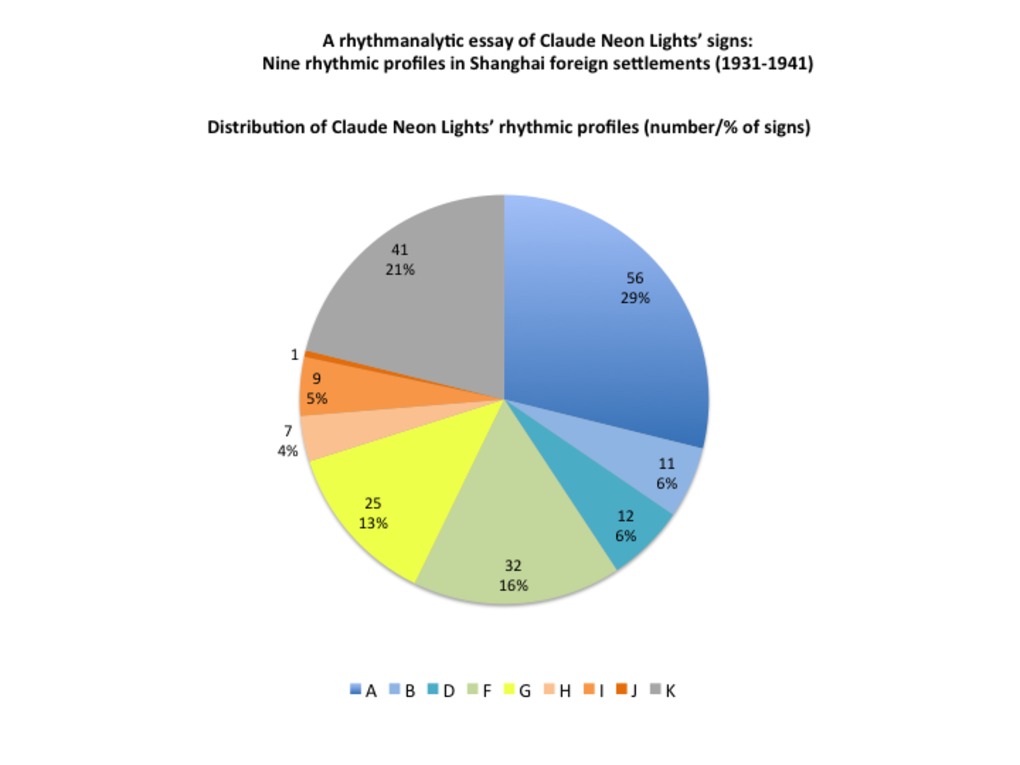 | 275 | A rhythmanalytic essay of Claude Neon Lights’ signs: Nine rhythmic profiles in Shanghai foreign settlements (1931-1941) | This table and the related pie aims to further refine the rhythmanalysis based on signs or advertisers' duraction by combining signs duration and the number of advertisers they respectfully hosted. Such combination has resulted in establishing nine rythmic profiles, noted by a letter from A to K (unknown). The typology is explained in the table, and the share occupied by each rhythmic profile is measured on the pie chart.
The pie chart shows that signs that enjoyed the shortest lifetime with a single advertiser lead the way (almost 30%), followed by longer signs with a single advertiser as well. Signs hosting two or more advertisers represent only a small minority, and the longer, the fewer (13% for shorter signs, and less than 10% for the longest signs). The measurements are based on the regular lists of signs that Claude Neon Lights sent to the French Municipal Council between December, 20 1935 and December, 31 1937, plus a few scattered signs recorded in other files in the Shanghai Municipal Archives (French concession and International Settlement in 1931 and 1941). Source: SMA (FC), U38-4-1114; SMA (SMC), U1-14-3261 (0246). |
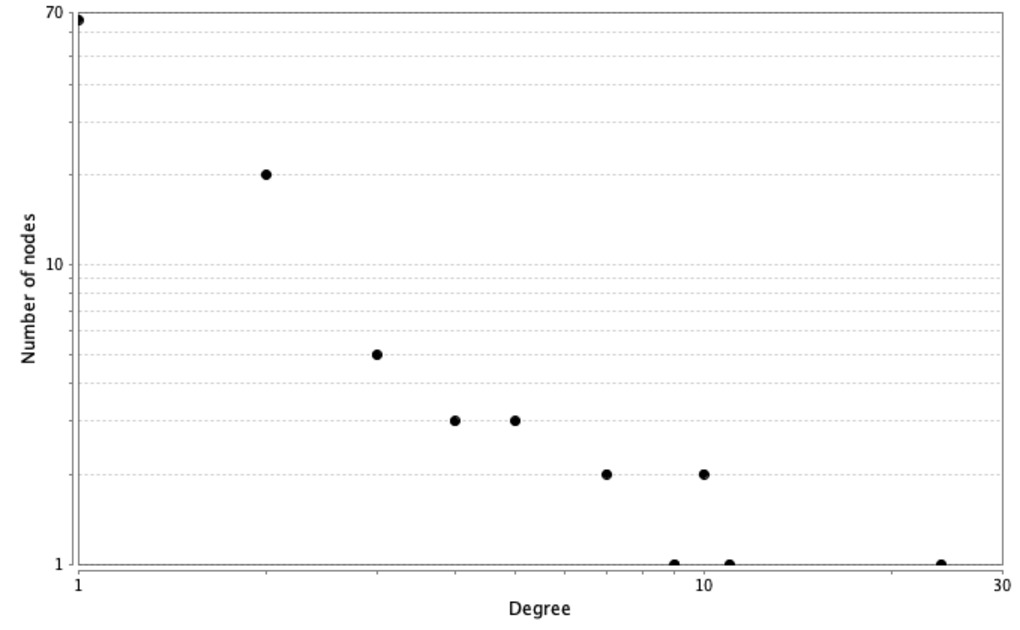 | 335 | Degree distribution in two-mode networks of meeting attendance at the Shanghai Rotary Club | This sets of three graphs compare degree distribution in the three two-mode networks of meeting attendance at the Shanghai Rotary Club under President Petit's (1919-20), Fitch's (1930-1) and Harkson's (1938-9) terms. The original datasets and the resulting graphs are available in the "Tables" and "Trees" section, respectively. NB We used Cytoscape Network Analyzer application to make these graphs. |
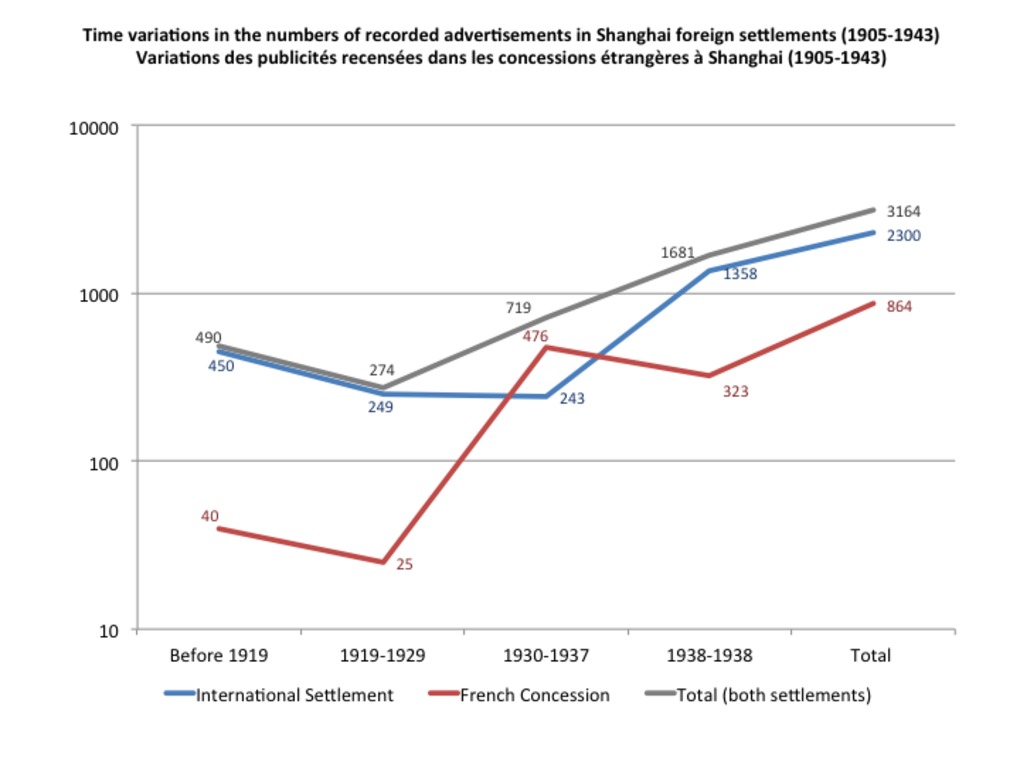 | 225 | Uneven distribution of recorded advertisements in Shanghai foreign settlements (1905-1943) | This set of three lines shows the uneven distribution of recorded advertisements in Shanghai foreign settlements between 1905-1943, in terms of both spatial (unequal documentation between the two settlements) and temporal coverage (variations across time). These curves have been established after the Shanghai municipal archives (hundreds of files in the International Settlement, dozens of files in the French Concession). |
 | 239 | Advertising population in the newspaper North China Daily News (1914-1949) | This set of three curves traces the evolutions of advertising population and density in the Shanghai-based British newspaper North China Daily News between 1914 and 1949. The green curve stands for the total number of advertisements (in each sample issue), the grey line indicates the total number of pages in each sample issue, the purple line indicates the average density of ads (number of ads/number of pages) in each sample issue). For consistency reasons, the measurements were made after the same five samples as for the Chinese newspaper Shenbao (January 7, 1914; January 3, 1924; January 5, 1934; February 1, 1941; January 1, 1949). *** Le jeu des trois courbes ci-joint retrace les tendances démographiques globales dans le quotidien britannique North China Daily News entre 1914 et 1949 : l’évolution la population totale par numéro (courbe verte), évolution du nombre de pages (en gris), ainsi que l’évolution de la densité moyenne (c’est-à-dire le rapport entre nombre de publicités totale et nombre de pages, en violet). Par souci de cohérence, les mesures ont été réalisées à partir des mêmes cinq échantillons que pour le Shenbao (7 janvier 1914, 3 janvier 1924, 5 janvier 1934, 1er février 1941, 1er janvier 1949) |
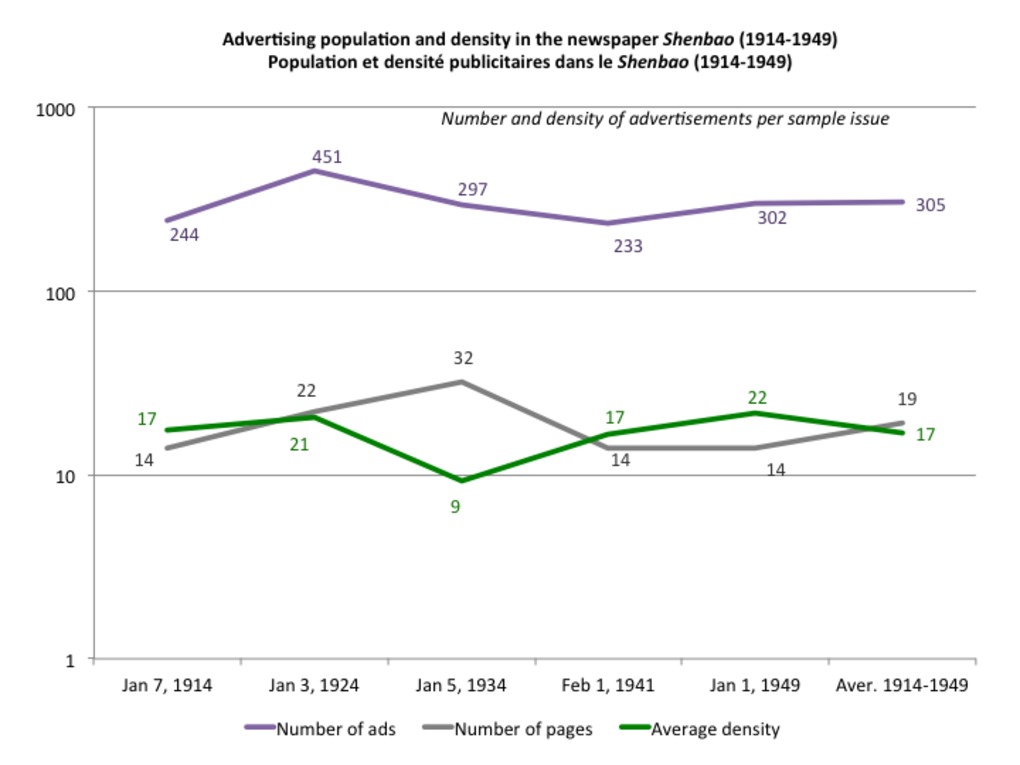 | 223 | Advertising population in the Chinese newspaper Shenbao (1914-1949) | This set of three curves traces the evolutions of advertising population and density in the Chinese newspaper Shenbao between 1914 and 1949. The green curve stands for the total number of advertisements (in each sample issue), the grey line indicates the total number of pages in each sample issue, the purple line indicates the average density of ads (number of ads/number of pages) in each sample issue). The measurements were made after our usual five samples of the Shenbao (January 7, 1914; January 3, 1924; January 5, 1934; February 1, 1941; January 1, 1949). *** Le jeu des trois courbes ci-joint retrace les tendances démographiques globales dans le quotidien chinois Shenbao entre 1914 et 1949 : l’évolution la population totale par numéro (courbe verte), évolution du nombre de pages (en gris), ainsi que l’évolution de la densité moyenne (c’est-à-dire le rapport entre nombre de publicités totale et nombre de pages, en violet). Les mesures ont été réalisées à partir de nos cinq échantillons habituels (7 janvier 1914, 3 janvier 1924, 5 janvier 1934, 1er février 1941, 1er janvier 1949) |
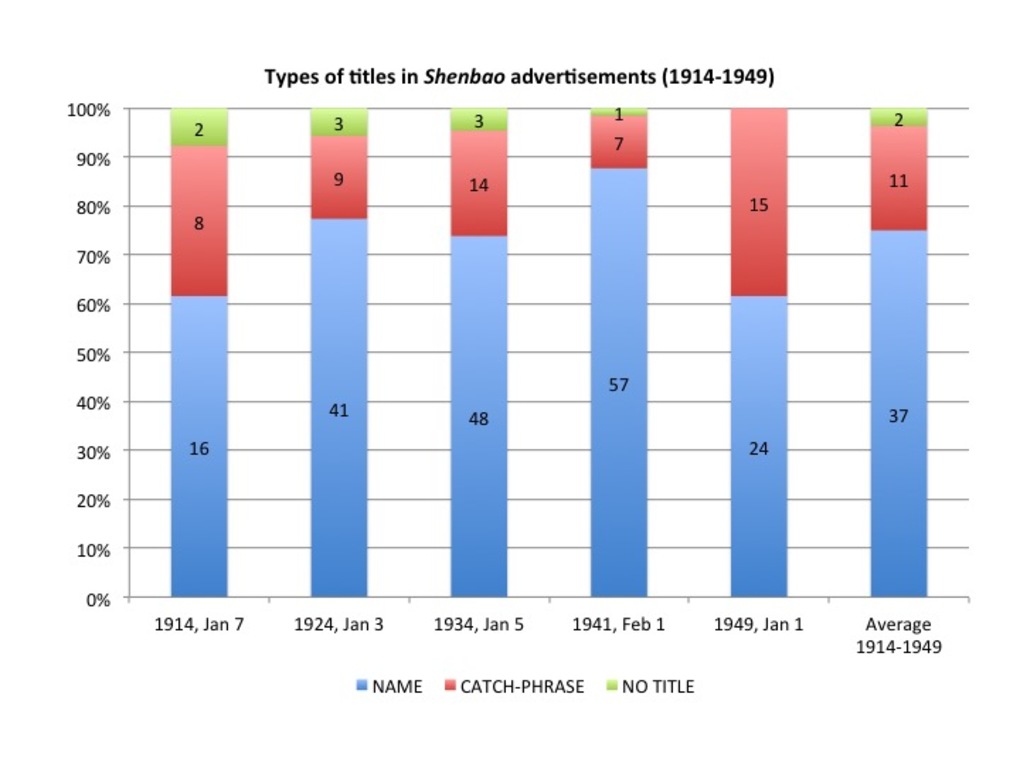 | 197 | Types of titles in Shenbao advertisements (1914-1949) | This set of six bar charts measures the relative importance of the various types of advertisement titles in our usual samples of the Shenbao (January 7, 1914; January 3, 1924; January 5, 1934; February 1, 1941; January 1, 1949). The figures show that the "name" type (name of either the company or the product/brand) predomines during the whole period (between 60% in 1914/1949 to 90% in 1941, average: 75%). This preference for title-names (mingcheng) was also noticed by contemporary handbooks (Su, 1929: 43). |
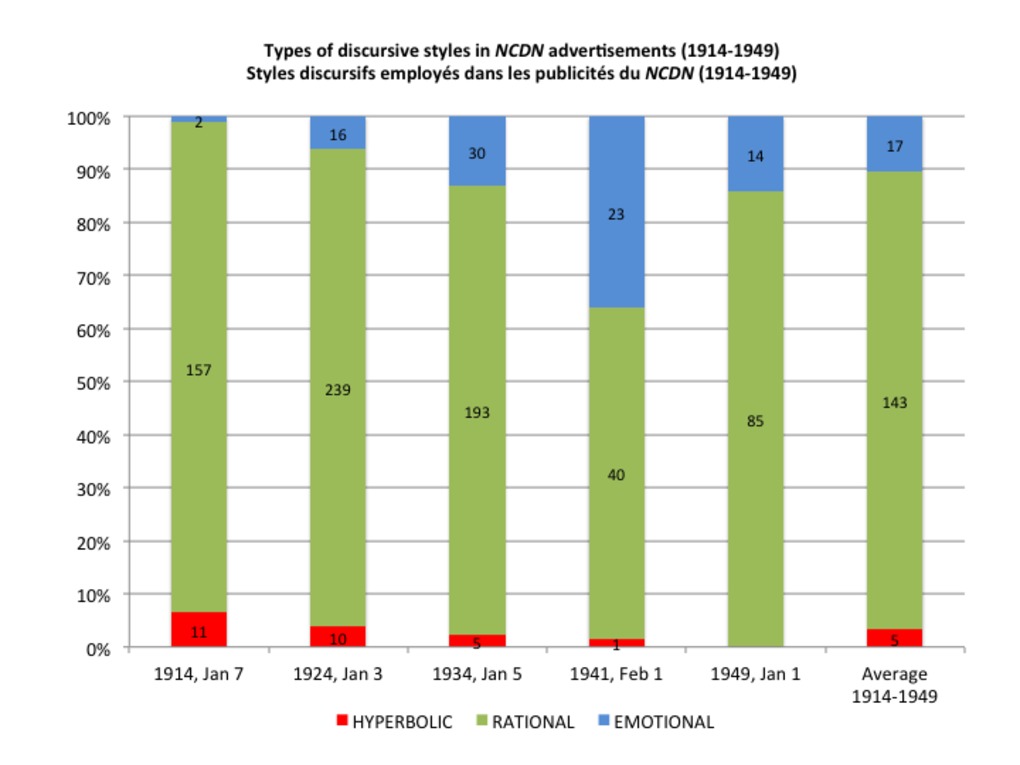 | 249 | Types of discursive styles in the British newspaper North China Daily News advertisements (1914-1949) | This set of six bar charts measure the relative importance of the three main types of discursive styles (or "ages") used in the advertisements published in the Shanghai-based British newspaper North China Daily News. For consistency reasons, the measurements have been made in the samples as used for the Chinese newspaper Shenbao: January 7, 1914; January 3, 1924; January 5, 1934; February 1, 1941; January 1, 1949. In order to facilitate comparisons, we have also used the same typology and color color as for the Shenbao. |
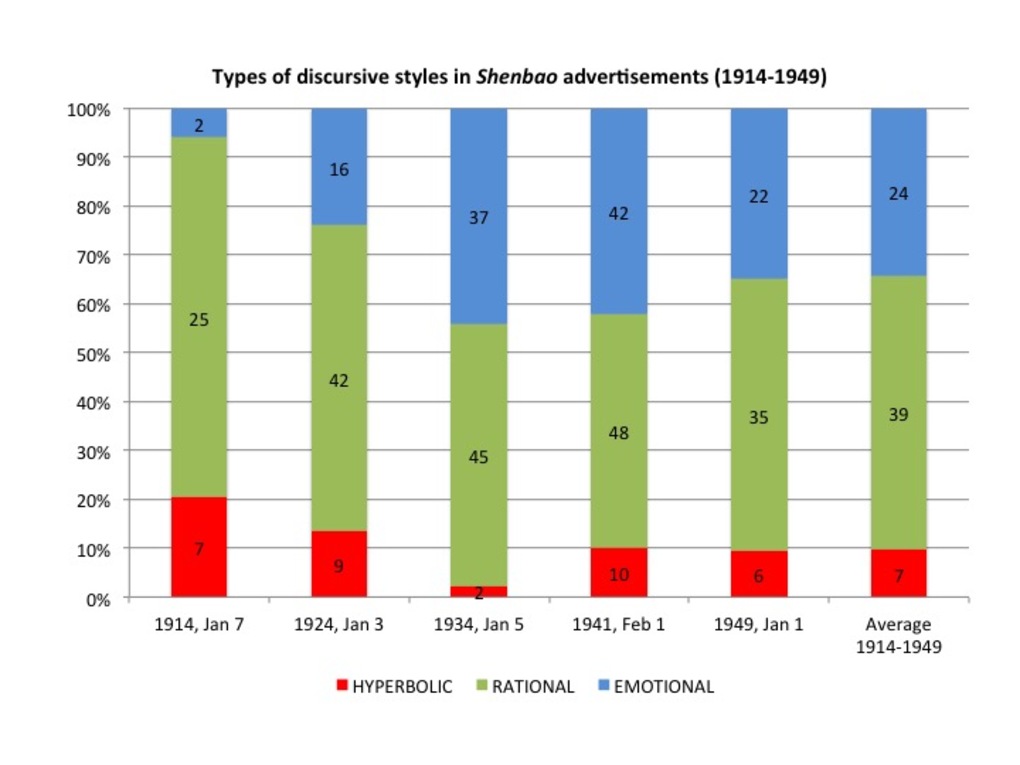 | 198 | Types of discursive styles in the Chinese newspaper Shenbao advertisements (1914-1949) | This set of six bar charts measure the relative importance of the three main types of discursive styles (or "ages") in our usual samples of the Shenbao: January 7, 1914; January 3, 1924; January 5, 1934; February 1, 1941; January 1, 1949. The figures show that the "rational" style prevailed during the whole period (average: 60%). Yet it tends to decline between 1914 (75%) and 1934-1949 (50%), gradually competed by the emotional/suggestive style (from 5% in 1914 to 45% in 1934, average 25%). The hyperbolic (exaggeration) remained marginal (less than 10%): pertaining to the age of "quack advertising", it was above all represented at the beginning of the period (20% in 1914). However, the three styles continued to cohabit on the pages of the same newspaper issue, and even on the same advertisement. The hyperbolic style was never eradicated by the rational or emotional styles asosicated with "modern" advertising, nor did the emotional tone replace reason-why copies. |
 | 203 | Measuring the “visual turn” in Shenbao advertising (1914-1949) | This set of pie charts is an attempt to evaluate the so-called "visual turn" which obsesses quite a number of scholars dealing with advertising today. Though such a "visual turn" was in a way advocated by professionals at the time, it should not be over estimated, and above all, it should not be used to support anachronistic assumptions. To evaluate the actual importance of the "visual turn" in Shenbao advertisements from 1914 to 1949, it is first necessary to define precisely what we mean by "visual". Thus seven "visual devices" have been identified, each one associated to a given color: image of the product/package (red), illustrated situation/life scene (green), trademark/logo (yellow), border/frame (blue), typography/punctuation, line/orientation/composition (orange) and colors/contrasts (grey). The proportion of each device was then measured in the "model" advertisements extracted from our usual five samples of the Shenbao (January 7, 1914; January 3, 1924; January 5, 1934; February 1, 1941; January 1, 1949). The fifth pie charts reveal that paradoxically, the share of figurative images (package or situation) tend to stagnate or even decline across time, at least until 1941 : from 23% in 1914 to 9% in 1941 for images of the package, from 10% in 1914 to 15% (1949) for illustrations. The costs of production of sophisticated images may have forced advertisers to turn towards cheaper visual devices, such as plays on typography (32-34% in 1914-1924, 19% in 1934 and still 10% in 1949), black/white contrasts (from 5% in 1914 to 34% in 1941, still 18% in 1949), borders/frames (from 15% in 1914 to about 30% in 1949, which also reveals an increased competition) and to a lesser extent, lines and composition (average of 5%). The use of trademarks/logos remains quite stable during the whole period (around 10%, after falling to 2% in 1934). |
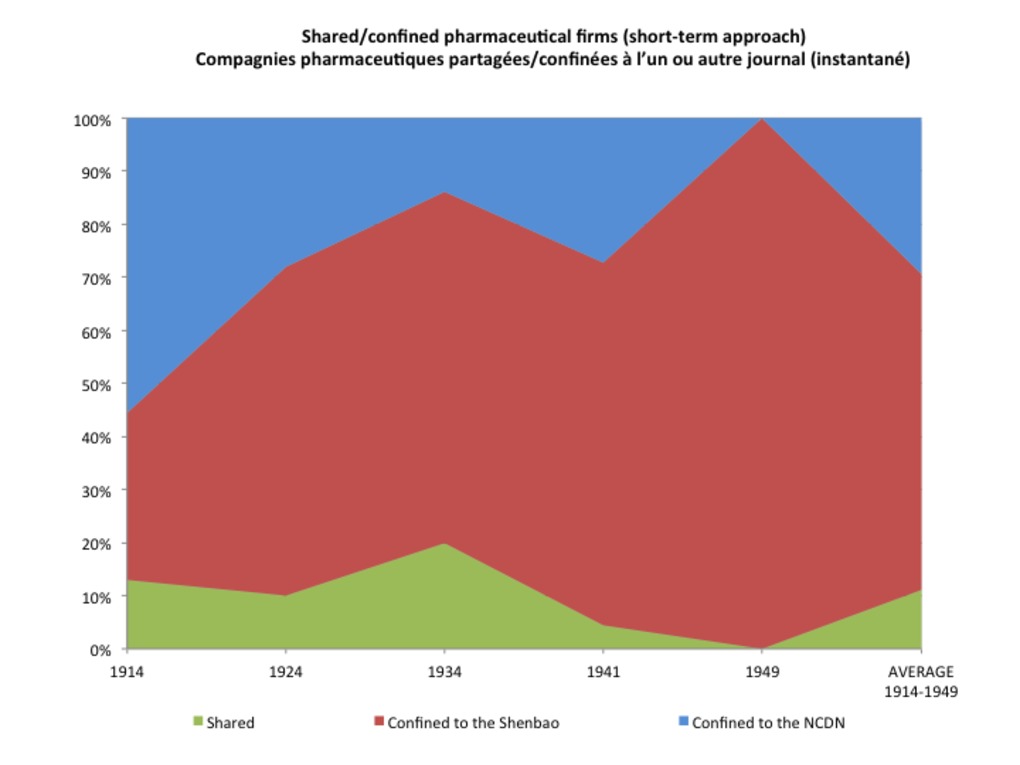 | 253 | Circulations of pharmaceutical brands and firms between the Chinese and British newspapers Shenbao and North China Daily News (1914-1949) | This set of four graphs aims to measure the proportion of pharmaceutical brands and firms, either shared or confined to the Chinese newspaper Shenbao and the Biritish North China Daily News, between 1914-1949. Shared brands or firms are materialized in green, the brands/firms confined to the Shenbao in red, and those confined to the North China Daily News in blue. In order to compensate the restriction of our sampling method, and to take possible time gaps into account, we have measured both short-term/simultaneous circulations (that is, shared brands/firms advertised in a restricted sample, at a given point in time) (first set of graphs) and long-term circulations (shared brands/firms in an enlarged sample, covering the entire period 1914-1949) (second set of graph lines). The measurements were made after extended (weekly) samples of both newspapers (Jan 7-14 1914, Jan 1-8 1924, Jan 1-10 1934, Feb 1-8 1941, Jan 1-8 1949). The related brandstrees have proved powerful tools to fill in this table (see the "Trees" section). This table was then use to build the related graphs (see the "Graphs" section) measuring the number of brands/firms either shared between the Shenbao and North China Daily News, or confined to one or the other newspaper. It was also used to draw the related intertwined circles (see the "Drawings" section). |
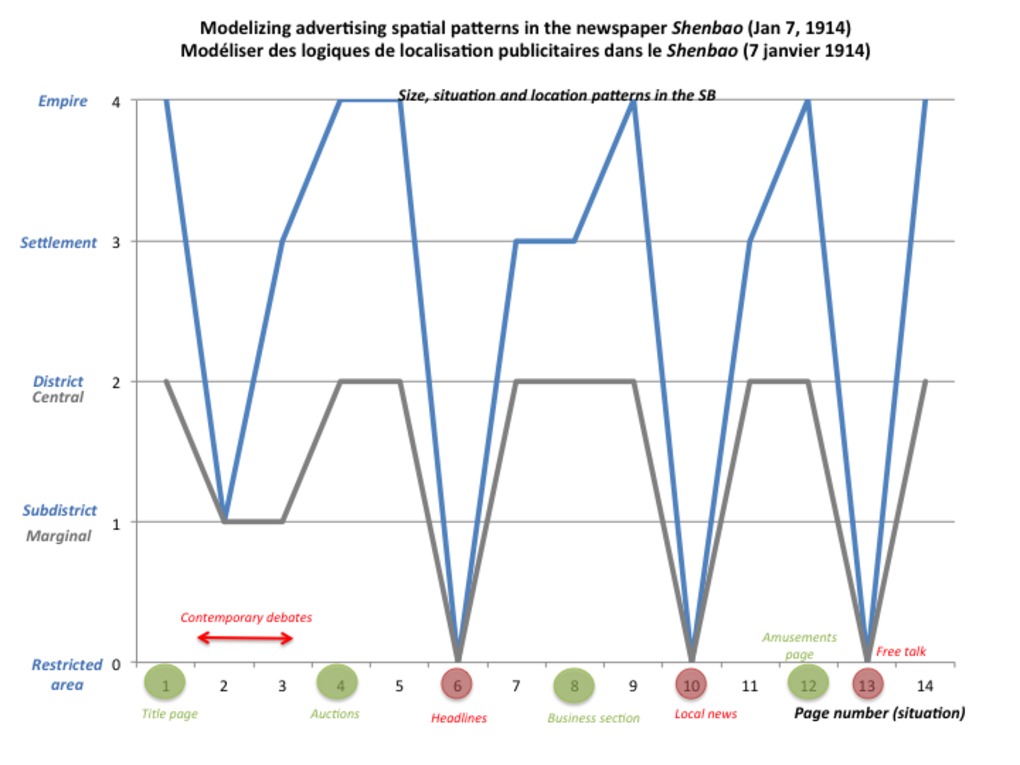 | 215 | Modelizing advertising spatial patterns in the newspaper Shenbao: an essay to correlate area, situation and page location in the newspaper Shenbao (1914-1949) | This set of five graphs offers a synthetical view of the previous analyses made from our five usual samples of the newspaper Shenbao (Jan 7, 1914 ; Jan 3, 1924 ; Jan 5, 1934 ; Feb 1, 1941 ; Jan 1, 1949). Each graph aims to modelize advertising zones in each sample issue by correlating the three criteria previously measured (area, situation, page location). For that very purpose, we have recycled the number and color code used for previous analyses. The "X" axis indicates page numbers (situation), while the "Y axis" is used to measure areas as well as page location. The ultimate goal of this modelizing essay is to reveal spatio-temporal patterns and to re-conciliate quantitative/qualitatve approaches of advertising spaces in the newspaper Shenbao. By juxtaposing the five graphs, one can trace changes in the newspaper advertising geography between 1914-1949.
|
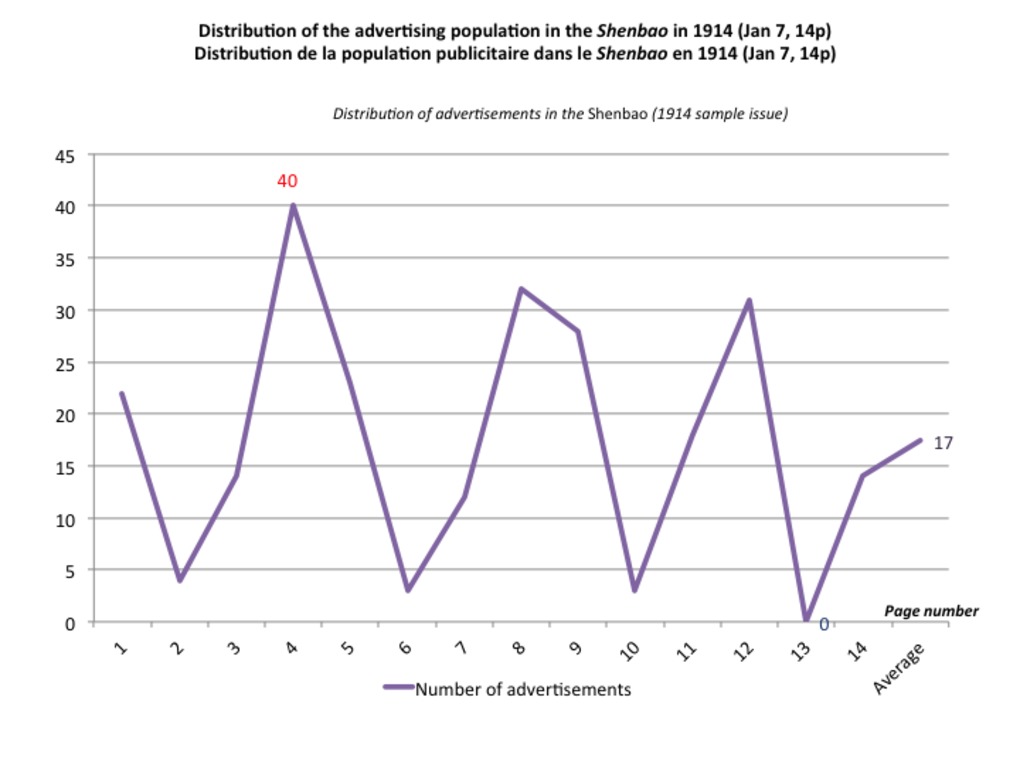 | 222 | Distribution of the advertising population in the newspaper Shenbao (1914-1949) | This set of five curves aims to trace the distribution of the advertising population (number of advertisements per page) in each sample of the newspaper Shenbao. Each curve reveal the variations of population from a page to another. By juxtaposing the five curves, one can trace the changes in this demographic distribution. The measurement have been made our five usual samples of the Shenbao (January 7, 1914; January 3, 1924; January 5, 1934; February 1, 1941; January 1, 1949). The blue color indicates minimal figures; the red color stands for maximal numbers. |
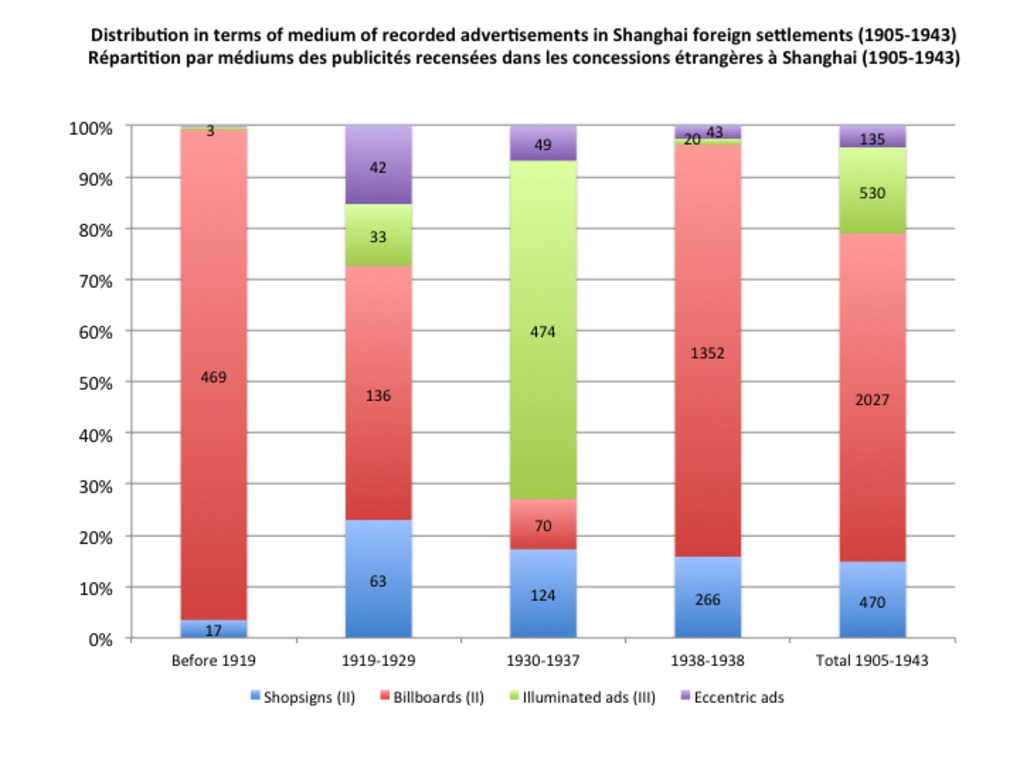 | 226 | Distribution in terms of medium of recorded advertisements in Shanghai foreign settlements (1905-1943) | This set of five bart charts shows the distribution of recorded advertisements in Shanghai settlements between 1905 and 1943, in terms of mediums, based on a simplified version of the typology established in the associated table (shopsigns/signboards, billboards, illuminated and other "eccentric" structures) (see the "Tables" section). |
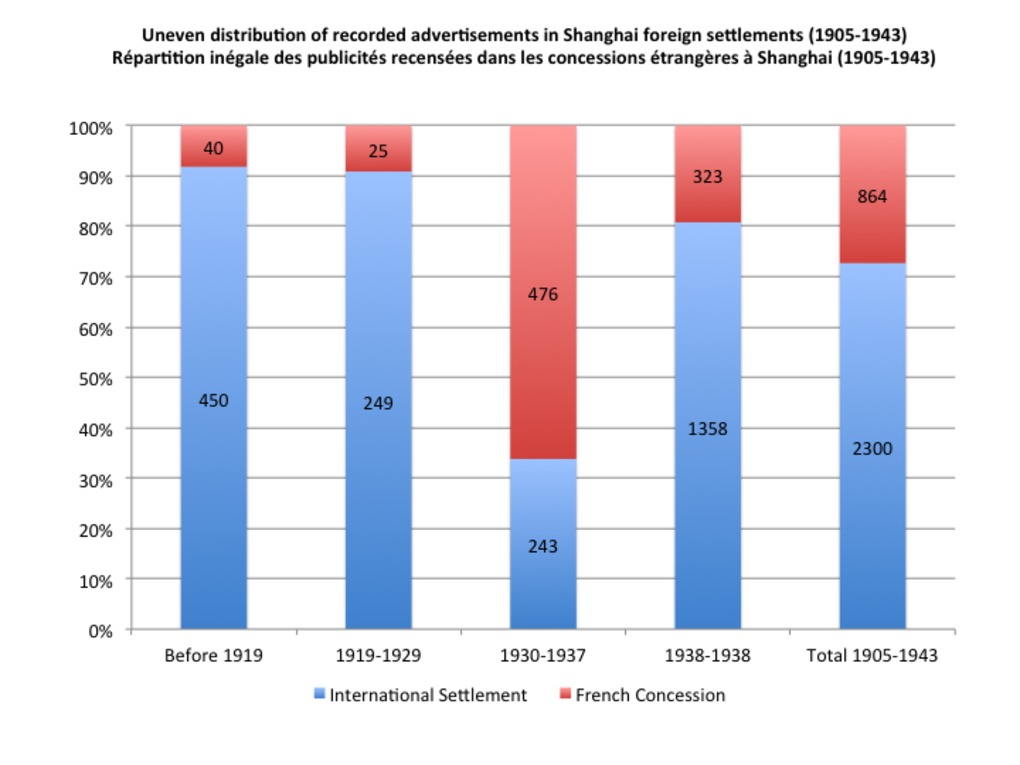 | 224 | Uneven distribution of recorded advertisements in Shanghai foreign settlements (1905-1943) | This set of bar charts shows the uneven distribution of recorded advertisements in Shanghai foreign settlements between 1905-1943, in terms of both spatial (unequal documentation between the two settlements) and temporal coverage (variations across time). These charts have been established after the Shanghai municipal archives (hundreds of files in the International Settlement, dozens of files in the French Concession). |
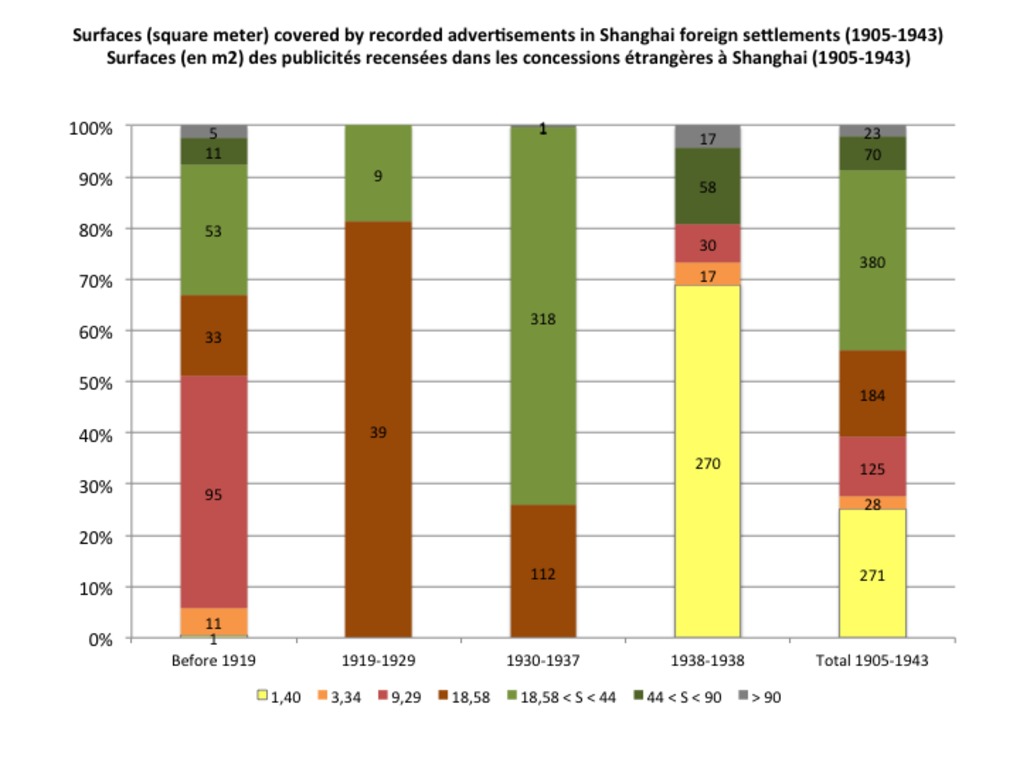 | 228 | Advertising surfaces (standards and size slices) in Shanghai foreign settlements (1905-1943) | This set of bar charts shows the distribution of advertising structures according to their dimensions in Shanghai foreign settlements (1905-1943). The size standards and "slices" have been identified after two main sources: professional handbooks (Crow, 1926, Bacon, 1929) and my own records in the Shanghai municipal archives. |
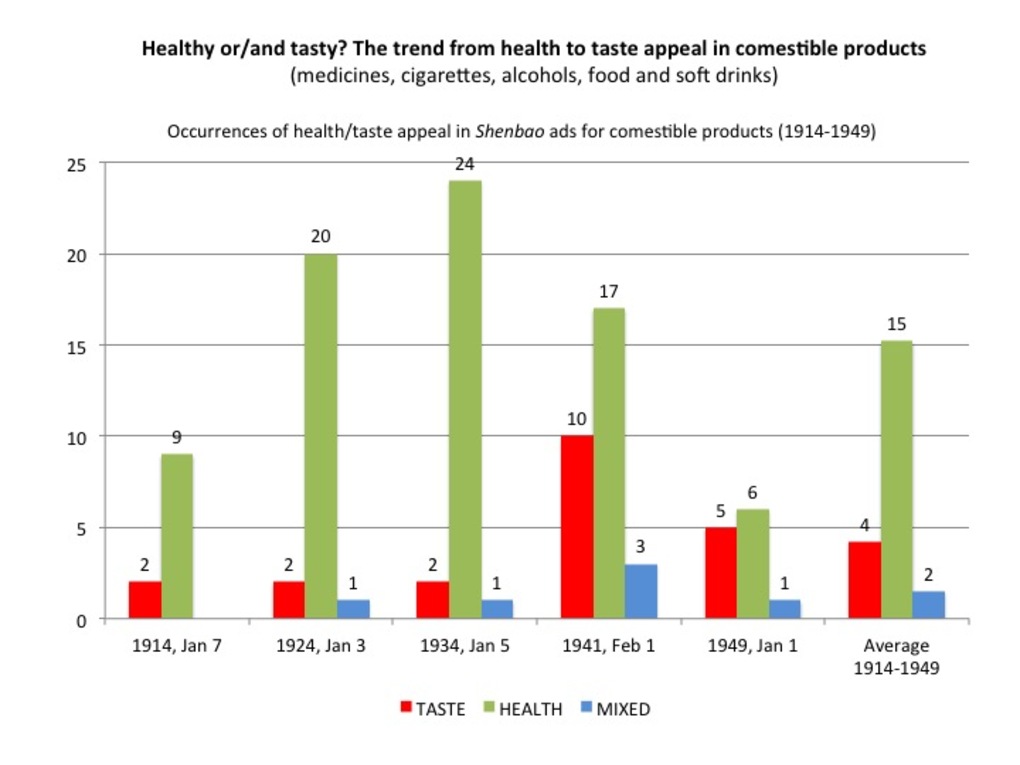 | 200 | Healthy or/and tasty? The trend from health to taste appeal in Shenbao advertisements for comestible products (1914-1949) | This set of bar charts measure the relative importance of two major appeals that were used to advertise comestible products at the time: health and taste/appetite, which either compete or complete each other. By "comestible products", we mean medicines, tobacco, alcholic drinks, food and soft drinks. The measurements were made from our usual five samples of the Shenbao (January 7, 1914; January 3, 1924; January 5, 1934; February 1, 1941; January 1, 1949). In each sample, we have recorded the occurrences of each appeal: health only (green), taste only (red), or a combination of the two appeals in the same advertisement (blue). The figures show that the "health" appeal remains predominant during the entire period (average of 15 occurrences, reaching a peak in 1934 (24 occurrences, while the taste appeal occured only two times). After a period of stagnation (two occurrences per issue in 1914-1924), the taste appeal dramatically raised in 1941 (10 occurrences), but fall again to 5 occurrences in 1949. Starting from 1924, health and taste appeals began to be combined (1 case in 1924-1934, 3 in 1941). The fifth following charts examine more closely to which products each appeal was specifically applied to. Obviously, health was constantly and systematically associated to medicines. Yet, it was also used to advertise alcohol in 1914 and nutritional products in 1924. As soon as 1924, alcoholic drinks were preferentially associated with taste, as it was the case for tobacco since 1914. Therefore, the "taste appeal" participated in the gradual association of alcohol and tobacco with pleasure. |
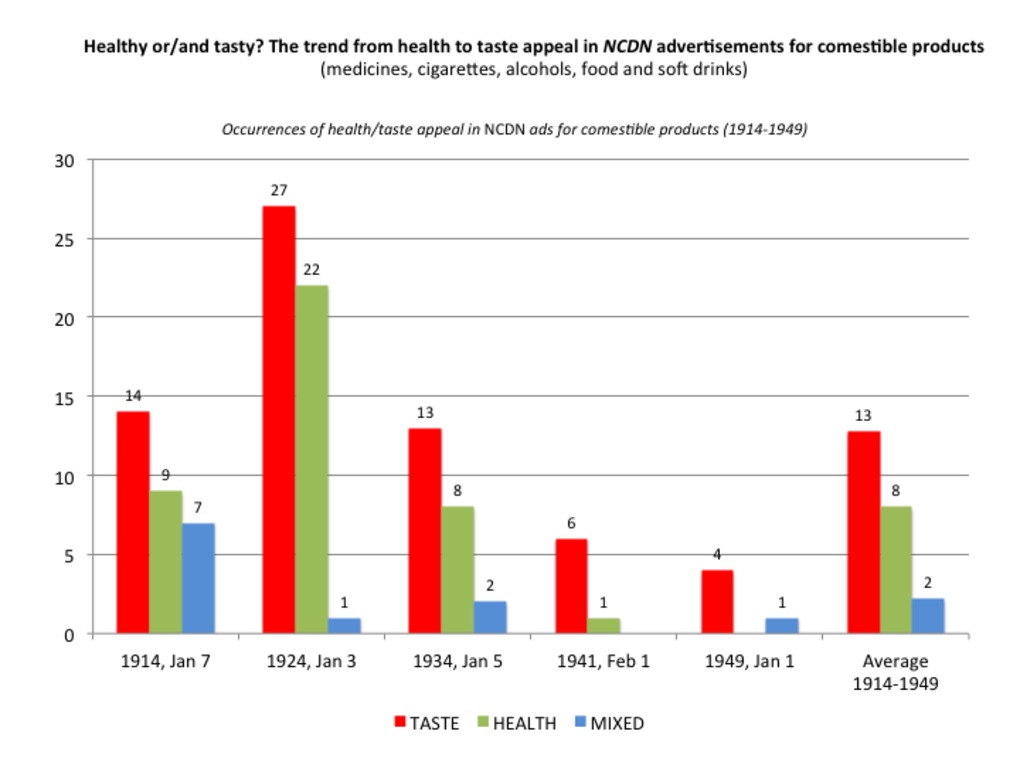 | 250 | Healthy or/and tasty? The trend from health to taste appeal in the North China Daily News advertisements for comestible products (1914-1949) | This set of bar charts measure the relative importance of two major appeals that were used to advertise comestible products at the time: health and taste/appetite, which either compete or complete each other. By "comestible products", we mean medicines, tobacco, alcholic drinks, food and soft drinks. For consistency reasons, the measurements were made from the same five samples as used for the Chinese newspaper Shenbao (January 7, 1914; January 3, 1924; January 5, 1934; February 1, 1941; January 1, 1949). In each sample, we have recorded the occurrences of each appeal: health only (green), taste only (red), or a combination of the two appeals in the same advertisement (blue). |
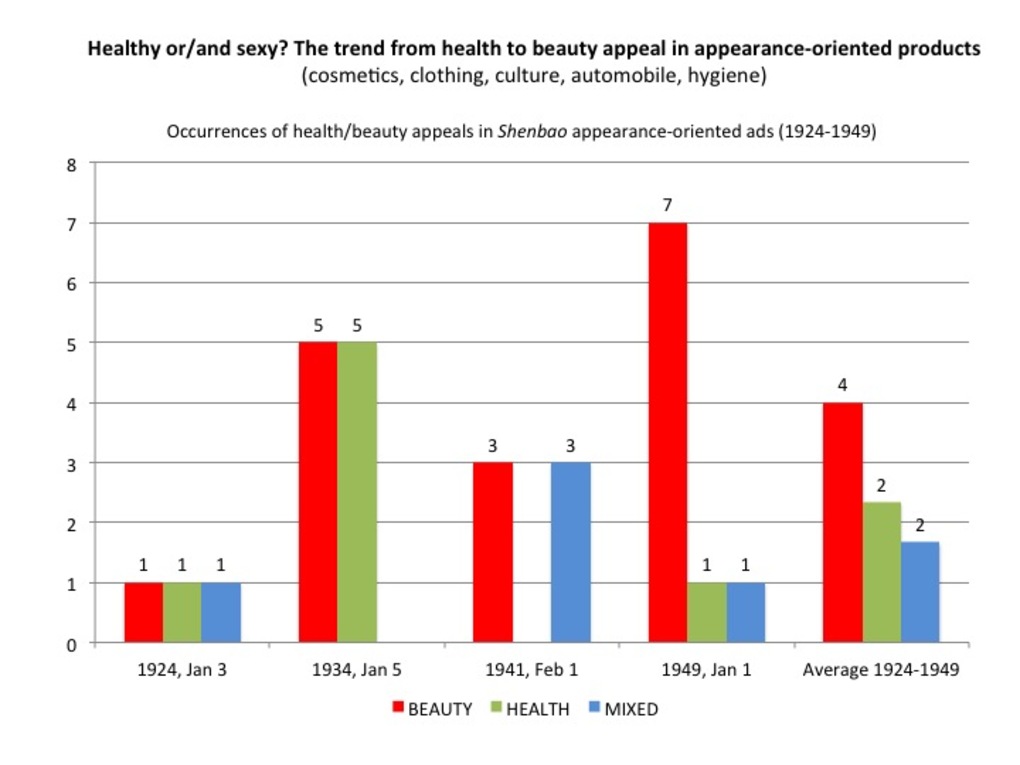 | 201 | Healthy or/and sexy/trendy? The trend from health to beauty/fashion appeal in Shenbao advertisements for appearance-oriented products (1914-1949) | This set of bar charts measure the relative importance of two major appeals that were used to advertise appearance-oriented products at the time: health and beauty/sex appeal, which either compete or complete each other. Behind the phrase "appearance products", we mainly include cosmetics, clothing, culture, automobile and hygienic products. The measurements were made from our usual samples of the Shenbao (January 3, 1924; January 5, 1934; February 1, 1941; January 1, 1949). Jan 7 1914 was deliberately excluded since none of these products were represented in this issue. In each sample, we have recorded the occurrences of each appeal: health only (green), beauty/sex only (red), or a combination of the two appeals in the same advertisement (blue). The figures show that the "beauty" appeal remains predominant during the entire period (average of 4 occurrences, reaching a peak in 1949 (7 occurrences, while the "health" appeal occured only one or two times per issue). After a period of equal stagnation (one occurrences per issue for each appeal in 1924), the beauty and health appeals dramatically emerged in parallel in 1934 (5 occurrences for each one). In 1941, it fell to 3 occurrences, while the purely health appeal temporarily disappeared. Yet this was balanced by the combination of the health/beauty appeal (3 occurrences in 1941). The four following charts examine more closely to which products each appeal was specifically applied to. Before 1941, cosmetics were equally advertised as either "health" or "beauty" products, first mixed in the same advertisements (1924), then as separate appeals (1934). After 1941, cosmetics were exclusively advertised as "beauty" products. This confirms the cosmetics' gradual process of specialization and separation from medical products. Advertisements for hygienic products were more complex: they alternatively used health (1934) and beauty appeal (1934-1941), or a combination of them (1949). Less frequent than hygienic goods or cosmetics, other products prove difficult to trace on the long-term: culture/productivity, clothing and automobile appear to be systematically associated with social distinction. |
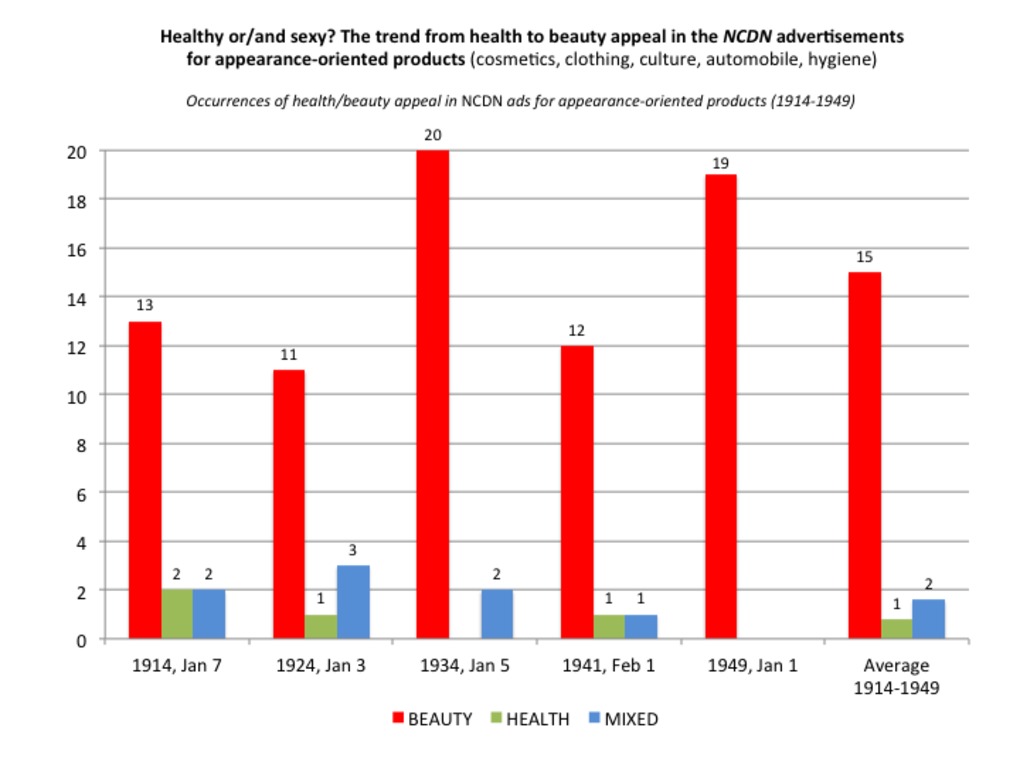 | 251 | Healthy or/and sexy/trendy? The trend from health to beauty/fashion appeal in the North China Daily News advertisements for appearance-oriented products (1914-1949) | This set of bar charts measure the relative importance of two major appeals that were used to advertise appearance-oriented products at the time: health and beauty/sex appeal, which either compete or complete each other. Behind the phrase "appearance products", we mainly include cosmetics, clothing, culture, automobile and hygienic products. For consistency reasons, the measurements were made after the same five samples as used for the Chinese newspaper Shenbao (except for January 7, 1914: January 3, 1924; January 5, 1934; February 1, 1941; January 1, 1949). In each sample, we have recorded the occurrences of each appeal: health only (green), beauty/sex only (red), or a combination of the two appeals in the same advertisement (blue). |
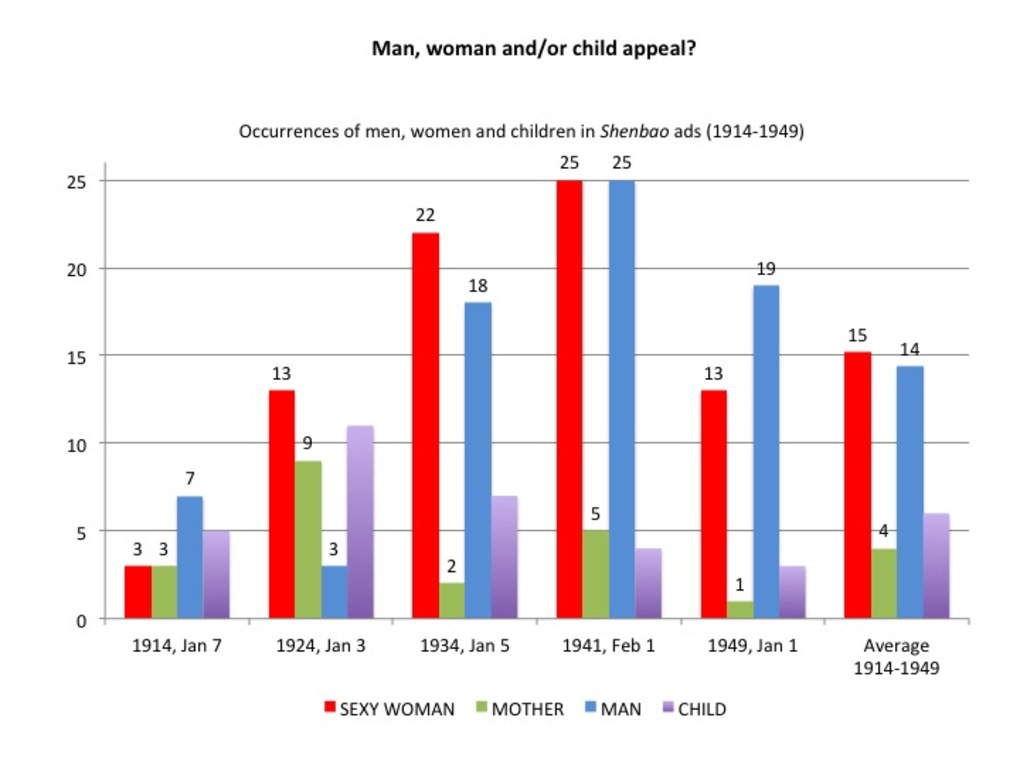 | 202 | Woman, man and child appeals in Shenbao advertisements (1914-1949) | This set of bar charts measure the relative importance of sex and age appeals in Shenbao advertisements from 1914 to 1949. Note that these appeals do not exclude each other: children and mothers are often associated on the same picture, as are elegant men and sexy women. The measurements were made from our usual five samples of the Shenbao (January 7, 1914; January 3, 1924; January 5, 1934; February 1, 1941; January 1, 1949). In each sample, we have recorded the occurrences of each appeal: sexy woman, corresponding to the seducive Modern Girl or independant New Woman (red), the patriotic mother or housewife (green), men (blue) or children (purple). Unexpectedly, the figures reveal that men were almost as prominent as women in advertising: same number as female occurrences in 1914 (7/6), only 3 in 1924, but 18 in 1934 (24 women), 25 in 1941 (30 female appeals), and finally exceeding women in 1941 (19 men, 13 sexy women and only one mother). Women studies and their focus on either "Modern Girl", "New Woman" or "Perfect Mother/Housewife" in a nationalistic context may have led us to under-estimate the male presence in Shanghai advertising. Women/gender studies may equally have hidden the importance of children and age appeal in advertising, especially in the 1924. Children gradually emerged between 1914 and 1924 in advertising (doubling the number of occurences, from 5 to 12), but entered a phase of stagnation and decline after 1934 (less than 5 occurrences). The progress of the child appeal approximately paralleled that of the "mother" appeal, to whom they were usually associated. The fifth following charts examine more closely to which products each appeal was specifically applied to. Sexy women were first preferentially associated with appearance culture, tobacco, and entertainement, but finally generalized to every type of product after 1934. The mother appeal "naturally" applied to medicines, hygiene, electrical appliances (1924) and nutritional products. Before 1934, the child appeal were primarily associated with medicines and food, and then gradually applied to culture/education and appearance (clothing). Men could be associated to any type of product, but preferentially to health product (medicines, hygiene), alcohol and tobacco, finance, automobile and entertainment, and even food in 1934. |
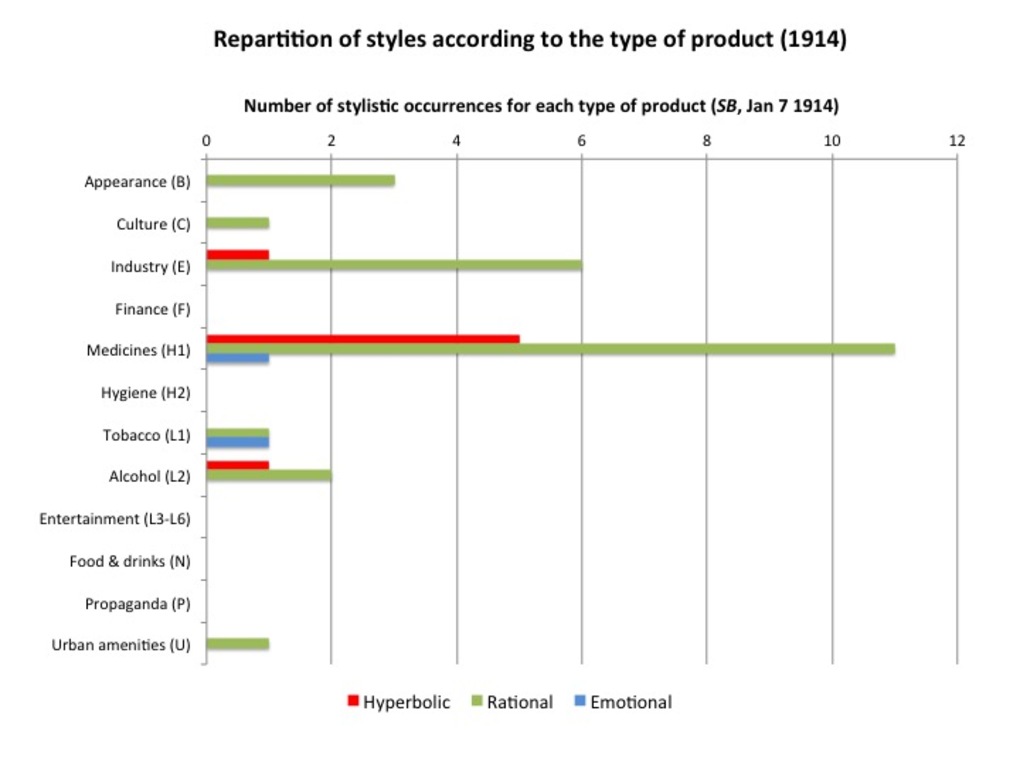 | 199 | Repartition of styles according to the type of product in Shenbao advertisements (1914-1949) | This set of bar charts examines to which types of products the three main styles were specifically applied to. The measurements were made from our usual samples of the Shenbao: January 7, 1914; January 3, 1924; January 5, 1934; February 1, 1941; January 1, 1949. Each chart stands for a given sample (issue/year). The charts reveal that the rational style was used for any type of product during the whole period. Since the beginning of the period, the hyperbolic style more specifically applied to medicines, industry, alcohol, and to a lesser extent, cigarettes. It was then adopted by appearance culture, entertainments and nutrition in the 1930-1940s. Confined to medicines and tobacco, the emotional/suggestive discourse became widespread after 1924-1934. Only the industrial and financial sectors escaped from the emotional wave. |
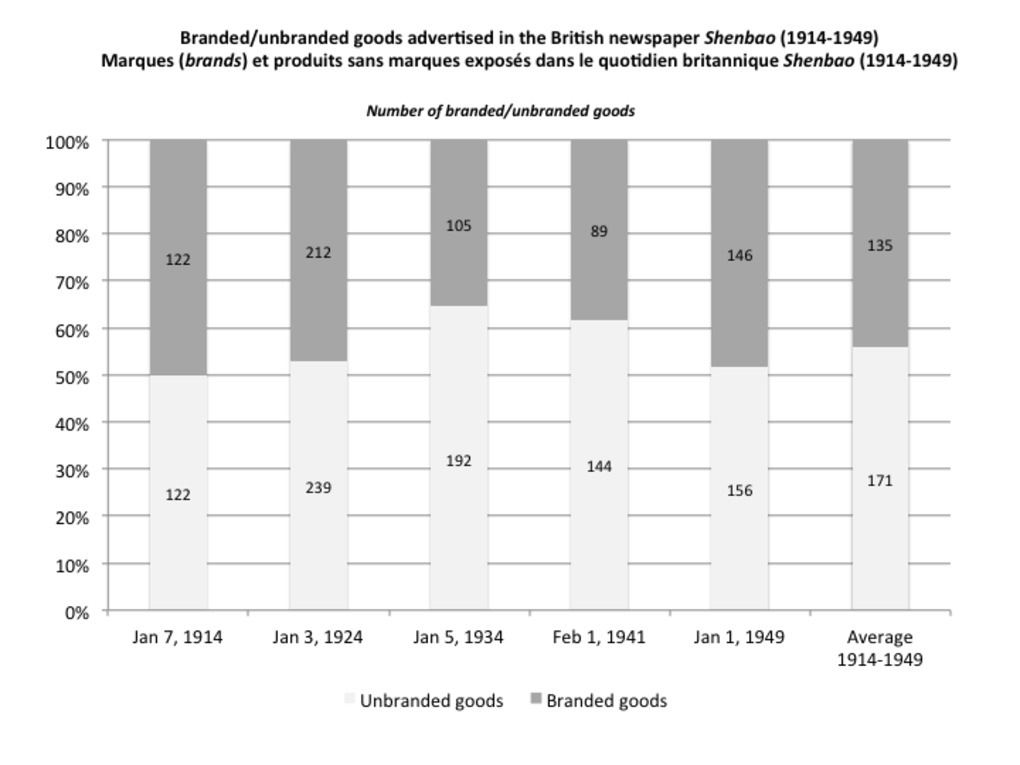 | 255 | Branded/unbranded goods in the Chinese newspaper Shenbao (1914-1949) | This set of bar charts aims to trace the emergence of branding and measure the proportion of branded (grey)/unbranded goods (white) advertised in the Shanghai-based Chinese newspaper Shenbao between 1914 and 1949. The measurements were made after our five usual samples (Jan 7, 1914; Jan 3, 1924; Jan 5, 1934; Feb 1, 1941; Jan 1, 1949). |
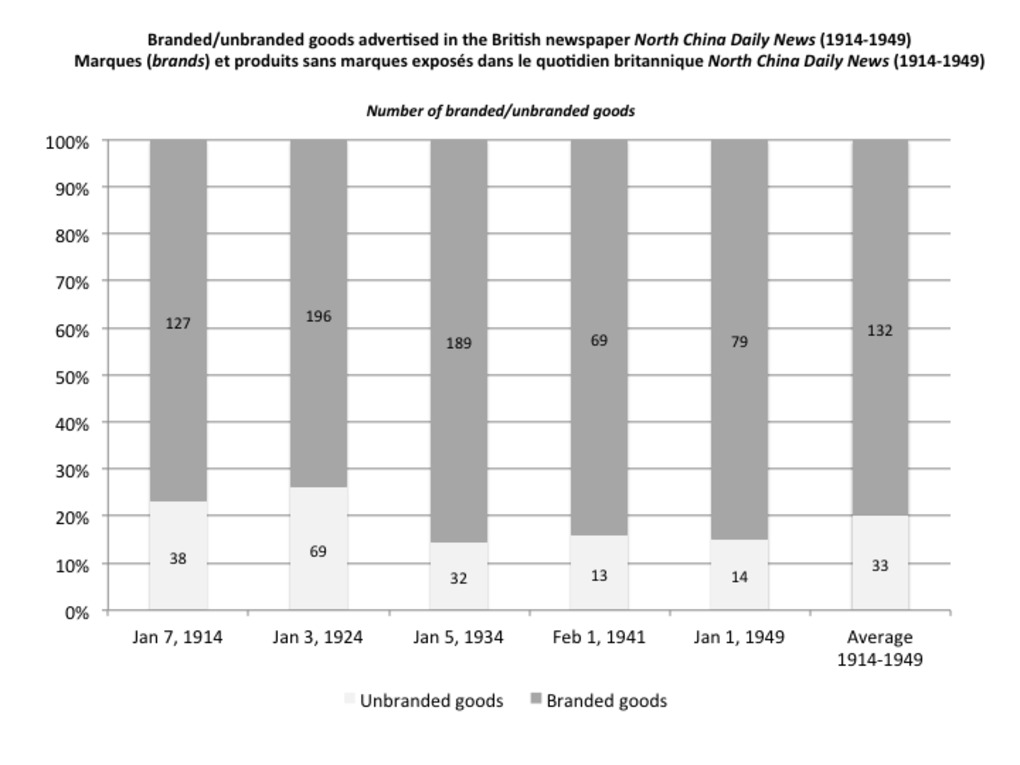 | 246 | Branded/unbranded goods in the British newspaper North China Daily News (1914-1949) | This set of bar charts aims to trace the emergence of branding and measure the proportion of branded (grey)/unbranded goods (white) advertised in the Shanghai-based British newspaper North China Daily News between 1914 and 1949. For consistency reasons, the measurements were made after the same five samples as those used for the Chinese newspaper Shenbao (Jan 7, 1914; Jan 3, 1924; Jan 5, 1934; Feb 1, 1941; Jan 1, 1949). |
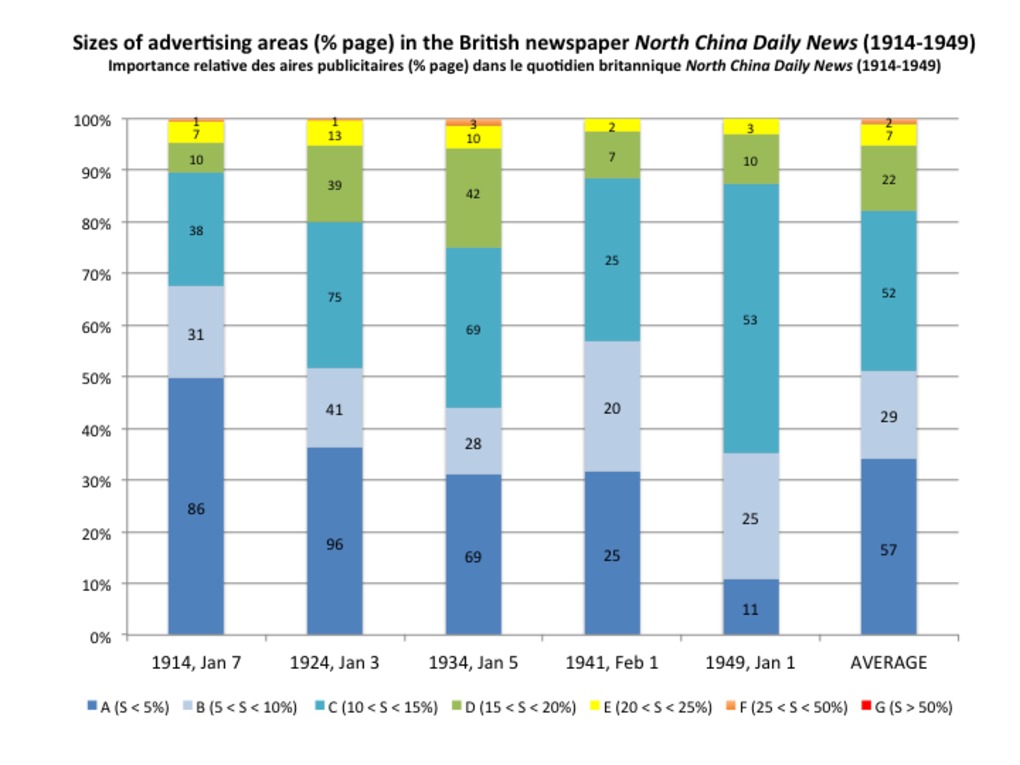 | 240 | Advertising-populated regions in the British newspaper North China Daily News (1914-1949) | This set of bar charts aims to measure the surfaces covered by advertisements in the Shanghai-based British newspaper North China Daily News, according to the following gradual scale of areas*:
*For visibility and convenience reasons, each type has been associated with a letter and a color ("S" standing for "surface"). For consistency reasons, measurements have been made after the same five samples as for the Chinese newspaper Shenbao (Jan 9, 1914; Jan 3, 1924; Jan 5, 1934; Feb 1, 1941; Jan 1, 1949). *** Les histogrammes ci-joint mesurent en termes numériques (nombre d’aires relevant de chaque catégorie) : l’importance relative des aires publicitaires dans le Shenbao, selon l'échelle graduée établie par ailleurs :
Par commoditité et par souci de lisibiité, une lettre et un code couleur a été associé à chaque catégorie. Plus la couleur est « froide » (bleu), plus les aires sont petites (types A, B, C : moins de 15% de la page). Inversement, plus les couleurs sont « chaudes » (du jaune au rouge), plus les surfaces sont étendues (type F et G : plus de 25% de la page). Le vert signale finalement les surface intermédiaires (D et E : entre 15 et 25%). La contance de ce code permet de suivre l’évolution des surfaces au fil des âges et de comparer les deux quotidiens. Par souci de cohérence, les mesures qui suivent ont été réalisées à partir des mêmes échantillons que pour le Shenbao (7 janvier 1914, 3 janvier 1924, 5 janvier 1934, 1er février 1941, 1er janvier 1949). |
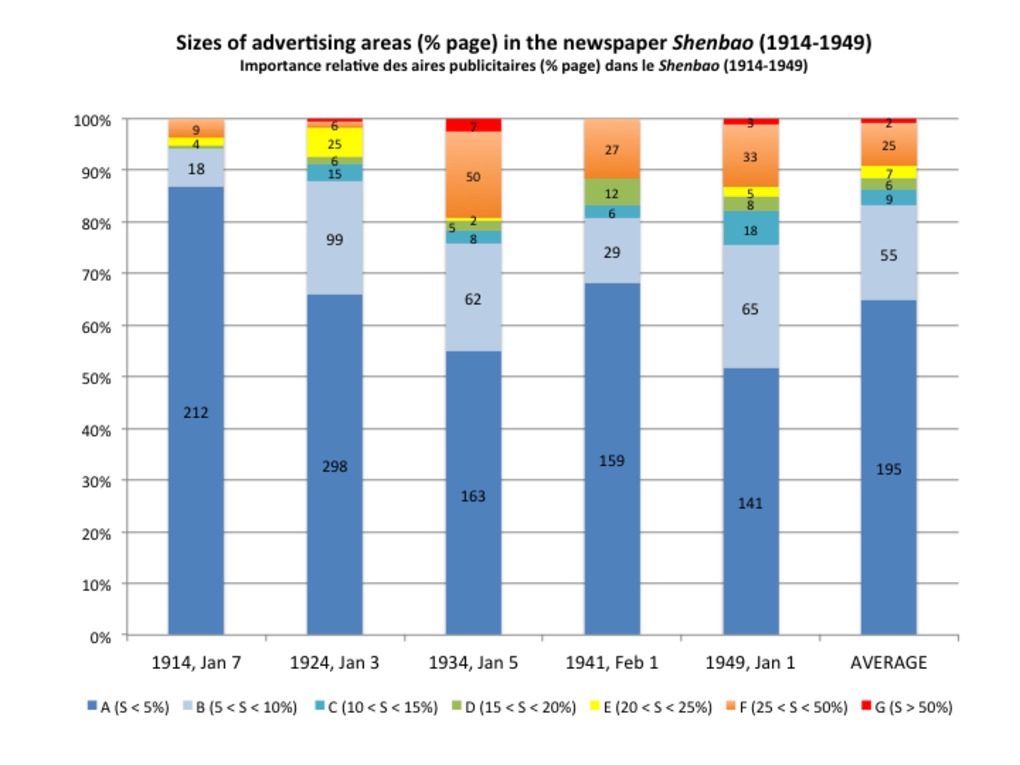 | 220 | Advertising-populated regions in the Chinese newspaper Shenbao (1914-1949) | This set of bar charts aims to measure the surfaces covered by advertisements in the newspaper Shenbao, according to the following gradual scale of areas*:
*For visibility and convenience reasons, each type has been associated with a letter and a color ("S" standing for "surface"): The measurements have been made after our five usual sample issues of the newspaper Shenbao (Jan 9, 1914; Jan 3, 1924; Jan 5, 1934; Feb 1, 1941; Jan 1, 1949). *** Les histogrammes ci-joint mesurent en termes numériques (nombre d’aires relevant de chaque catégorie) : l’importance relative des aires publicitaires dans le Shenbao, selon l'échelle graduée établie par ailleurs :
Par commoditité et par souci de lisibiité, une lettre et un code couleur a été associé à chaque catégorie. Plus la couleur est « froide » (bleu), plus les aires sont petites (types A, B, C : moins de 15% de la page). Inversement, plus les couleurs sont « chaudes » (du jaune au rouge), plus les surfaces sont étendues (type F et G : plus de 25% de la page). Le vert signale finalement les surface intermédiaires (D et E : entre 15 et 25%). La contance de ce code permet de suivre l’évolution des surfaces au fil des âges et de comparer le Shenbao à d'autres quotidiens. Par souci de cohérence, les mesures ont été réalisées à partir de nos cinq échantillons habituels du Shenbao (7 janvier 1914, 3 janvier 1924, 5 janvier 1934, 1er février 1941, 1er janvier 1949). |
 | 243 | Measuring the relative importance of gradual types of borders in the British newspaper North China Daily News (1914-1949) | This set of bar charts aims to measure the relative importance of the three main types of borders identified in the newspaper North China Daily News between 1914-1949, each one associated to a given number and color:
This gradual typology was freely inspired by E. Casey in his reply to P. Ethington's project of "Placing history". Source: Casey, Edward, ‘Boundary, Place, and Event in the Spatiality of History’, Rethinking History, 11 (2007), 507–12. We have only counted the dominant type of border on each page. For an illustrated or more embodied version of this typology, see: http://madspace.org/cooked/Drawings?ID=124. For consistency reasons, the measurements were made in the same five samples as used for the newspaper Shenbao (Jan 7, 1914 ; Jan 3, 1924 ; Jan 5, 1934 ; Feb 1, 1941 ; Jan 1, 1949). |
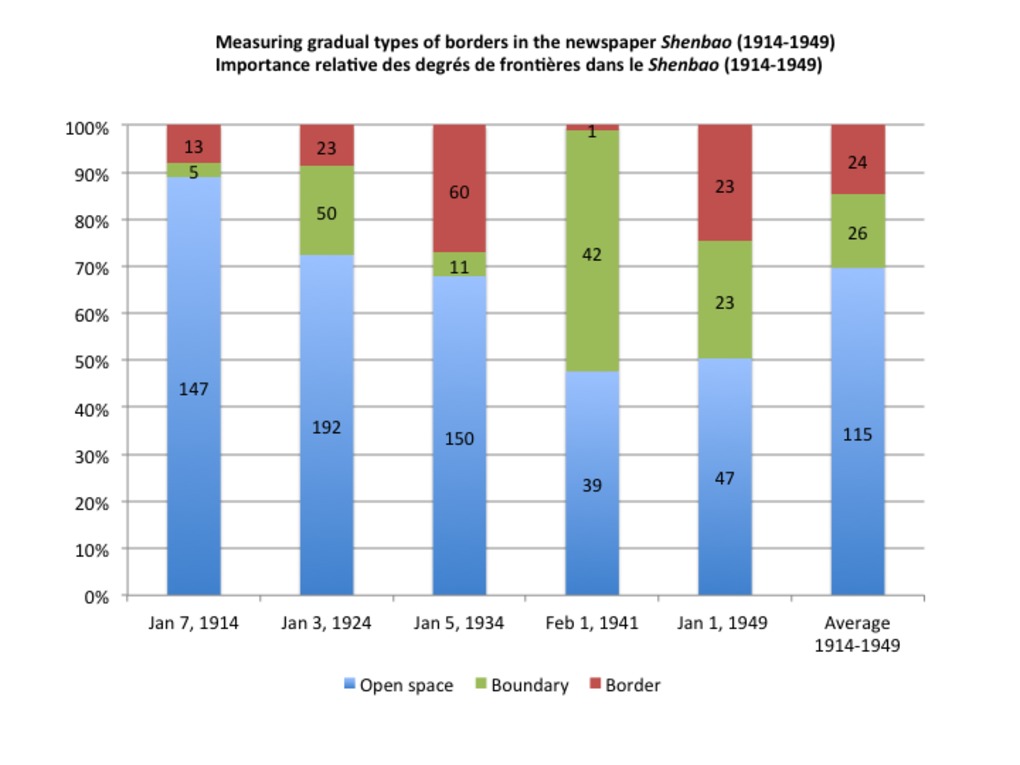
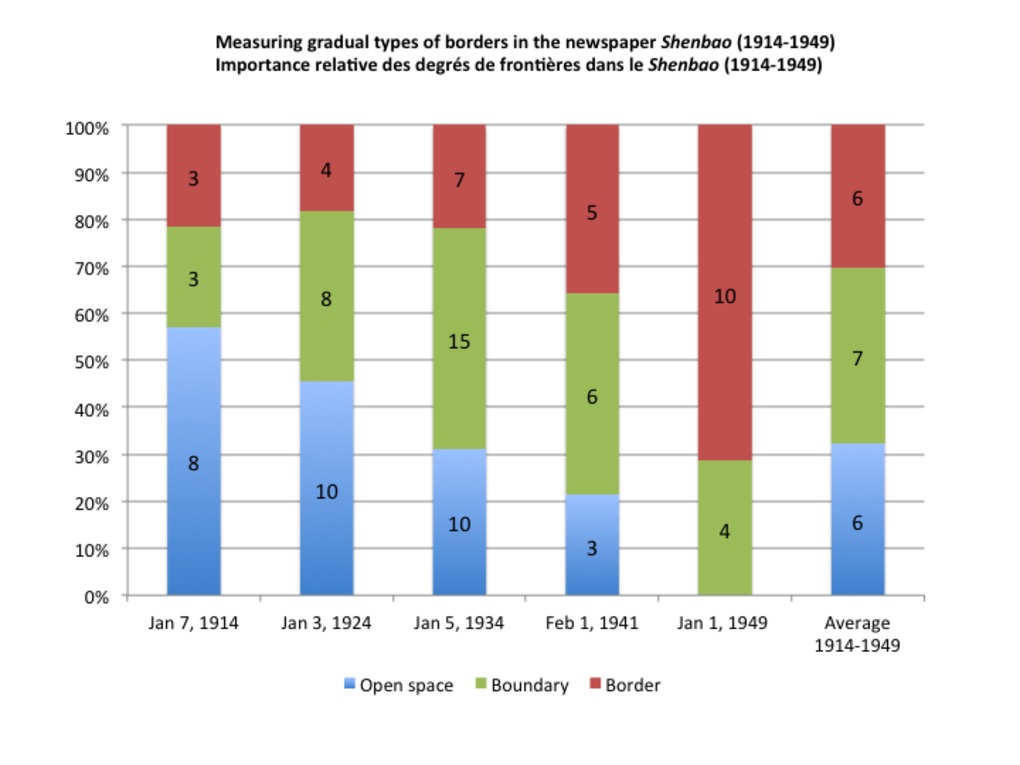 | 216 | Measuring the relative importance of gradual types of borders in the newspaper Shenbao (1914-1949) | This set of bar charts aims to measure the relative importance of the three main types of borders identified in the newspaper Shenbao between 1914-1949, each one associated to a given number and color:
This gradual typology was freely inspired by E. Casey in his reply to P. Ethington's project of "Placing history". Source: Casey, Edward, ‘Boundary, Place, and Event in the Spatiality of History’, Rethinking History, 11 (2007), 507–12. We have only counted the dominant type of border on each page. For an illustrated or more embodied version of this typology, see: http://madspace.org/cooked/Drawings?ID=119. The measurements were made in our five usual samples of the newspaper Shenbao (Jan 7, 1914 ; Jan 3, 1924 ; Jan 5, 1934 ; Feb 1, 1941 ; Jan 1, 1949). |
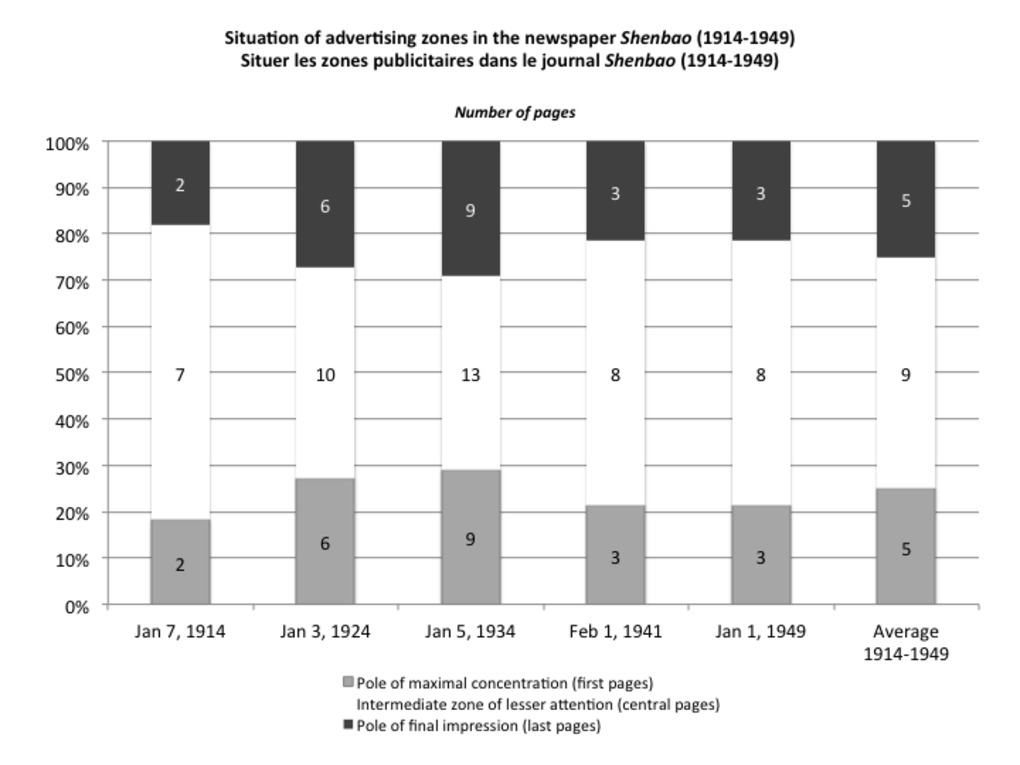 | 212 | Situation of advertising zones in the newspaper Shenbao (1914-1949) | This set of bar charts aim to locate advertising zones in each sample issue of the newspaper Shenbao from 1914 to 1949. For that very purpose, three gradual types of situation have been identified, according to their actual position in the newspaper issue (page numbers), from an editorial point of view; and to their presumed effect on the reader attention, from a psychological point of view, based on Chinese handbooks (Wu, Zhu, 1946) which were inspired by contemporary American studies in psychology. Each situation was associated to a given color and number :
The measurements were made from our five usual samples of the newspaper Shenbao: Jan 7, 1914 ; Jan 3, 1924 ; Jan 5, 1934 ; Feb 1, 1941 ; Jan 1, 1949. |
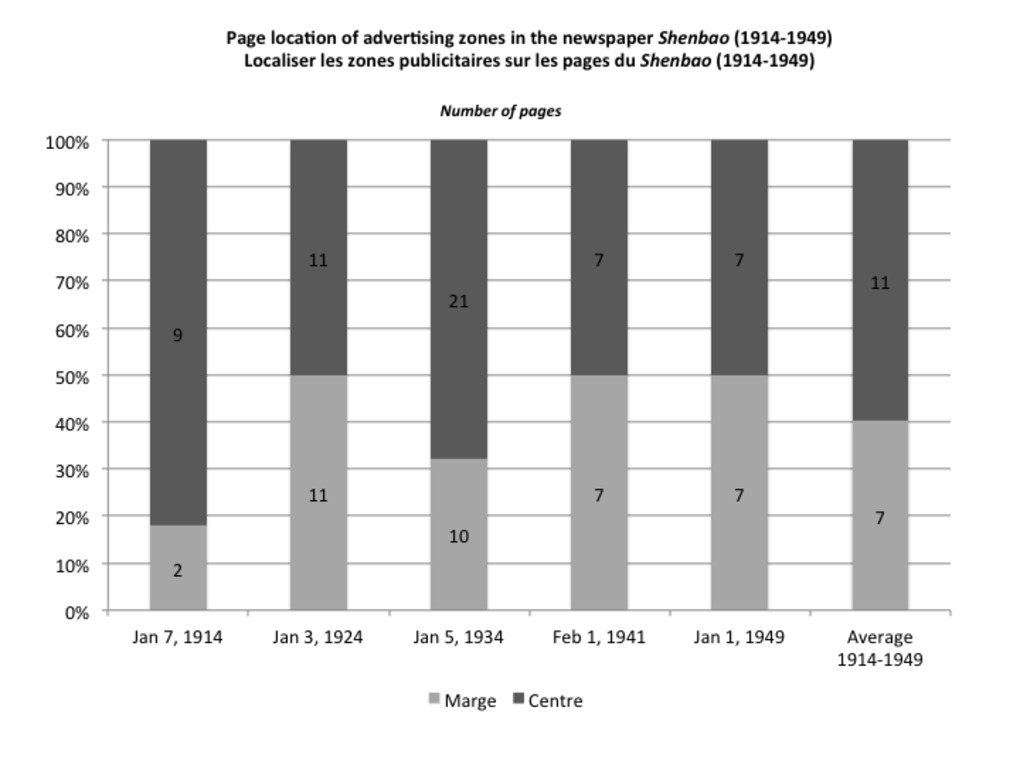 | 213 | Page location of advertising zones in the newspaper Shenbao (1914-1949) | This set of bar charts aim to finely locate advertising zones on each page of the newspaper Shenbao from 1914 to 1949. For that very purpose, two hierarchic types of page location have been identified, according to their actual/visible position on the page, and their presumed capacity to attract the reader's eye. Each one was associated to a given color and number :
N.B. Number "0" and white color stand for restricted zones (no ads). The measurements were made from our five usual samples of the newspaper Shenbao: Jan 7, 1914 ; Jan 3, 1924 ; Jan 5, 1934 ; Feb 1, 1941 ; Jan 1, 1949. |
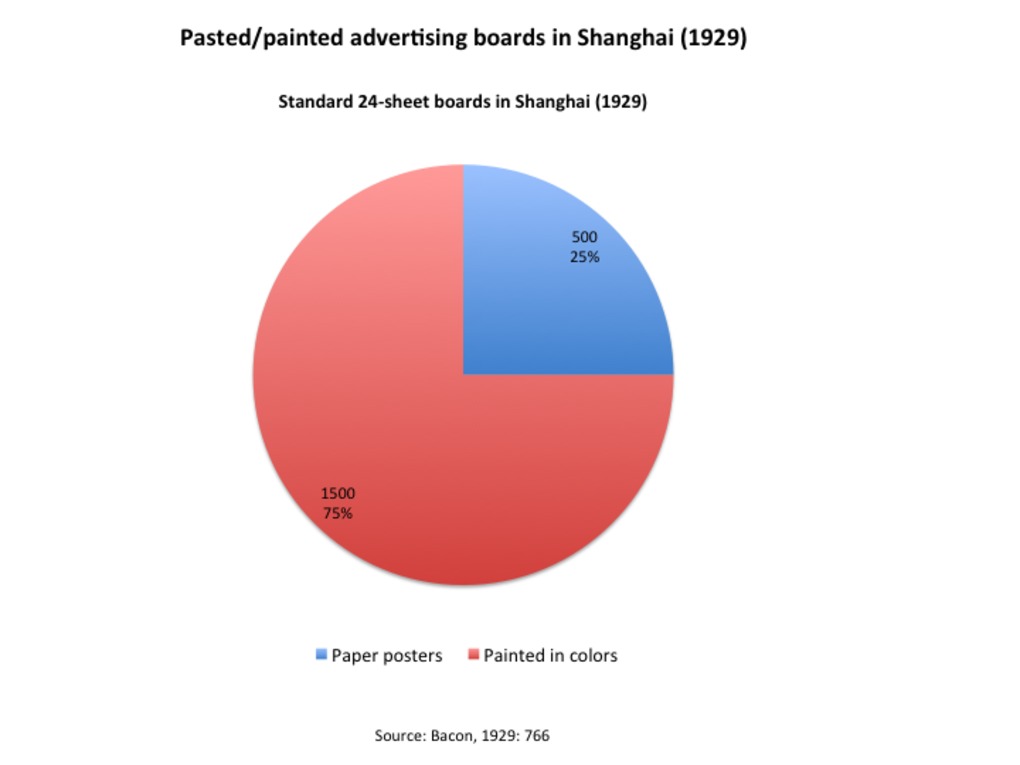 | 305 | 24-sheet boards in Shanghai: Prevailing of color-painted over paper-pasted boards (1929) | This pie charts shows the number and ratio of advertising boards (standard 24-sheet boards) in Shanghai before 1929, according to their materials - either paper/pasted or painted in color. Boards painted in colors clearly prevailed over paper pasted boards at the time. The preference for painted boards may result from their relative material resistance to bad weather and climatic conditions. Source: Bacon, 1929: 766. |
 | 232 | Annual advertising expenses in Shanghai and China newspapers (1929) | This pie charts shows the distribution of the money spent in advertising newspapers in Shanghai and other cities in China before 1929 (expressed in million of mexican dollars/year). Source: Bacon, 1929 (754-755) |
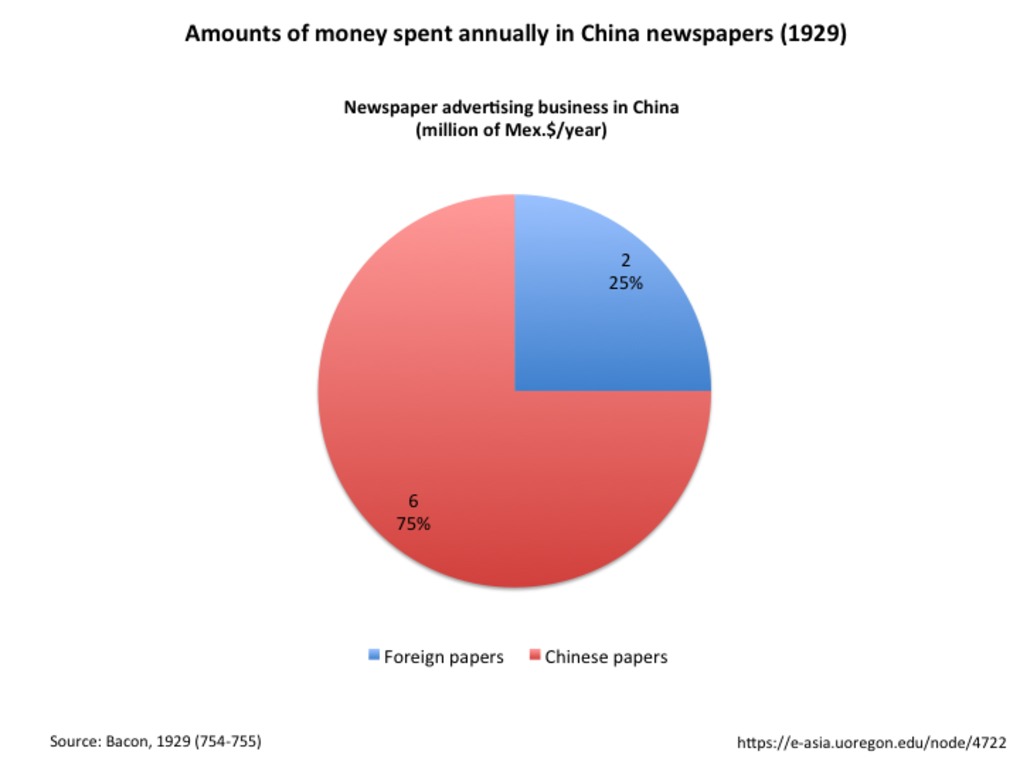 | 231 | Annual advertising expenses in China newspapers: distribution betwen Chinese and foreign newspaper (1929) | This pie charts shows the distribution of the money spent in advertising newspapers between Chinese and foreign newspaper in China before 1929 (expressed in million of mexican dollars/year). Source: Bacon, 1929 (754-755) |
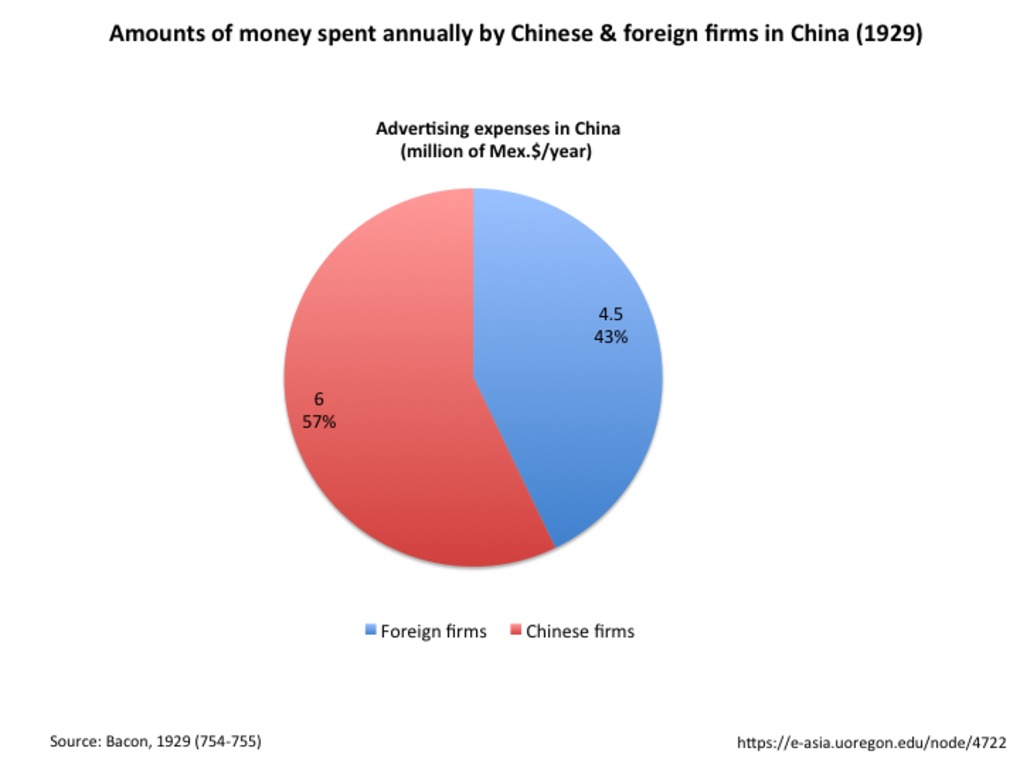 | 233 | Annual advertising expenses by Chinese and foreign firms in China (1929) | This pie charts shows the distribution of the money spent in advertising by Chinese and foreign firms in China before 1929 (expressed in million of mexican dollars/year). Source: Bacon, 1929 (754-755) |
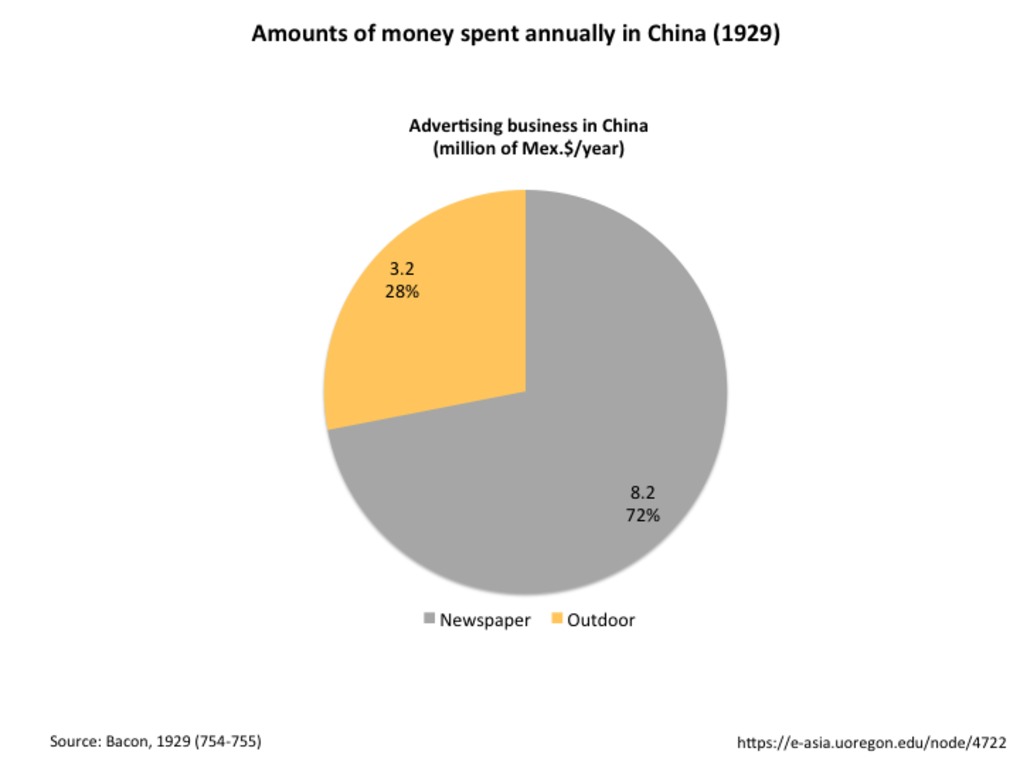 | 230 | Annual advertising expenses in China: distribution betwen newspaper and outdoor advertising (1929) | This pie charts shows the distribution of the money spent in advertising between newspaper and outdoor advertising in China before 1929 (expressed in million of mexican dollars/year). Source: Bacon, 1929 (754-755) |
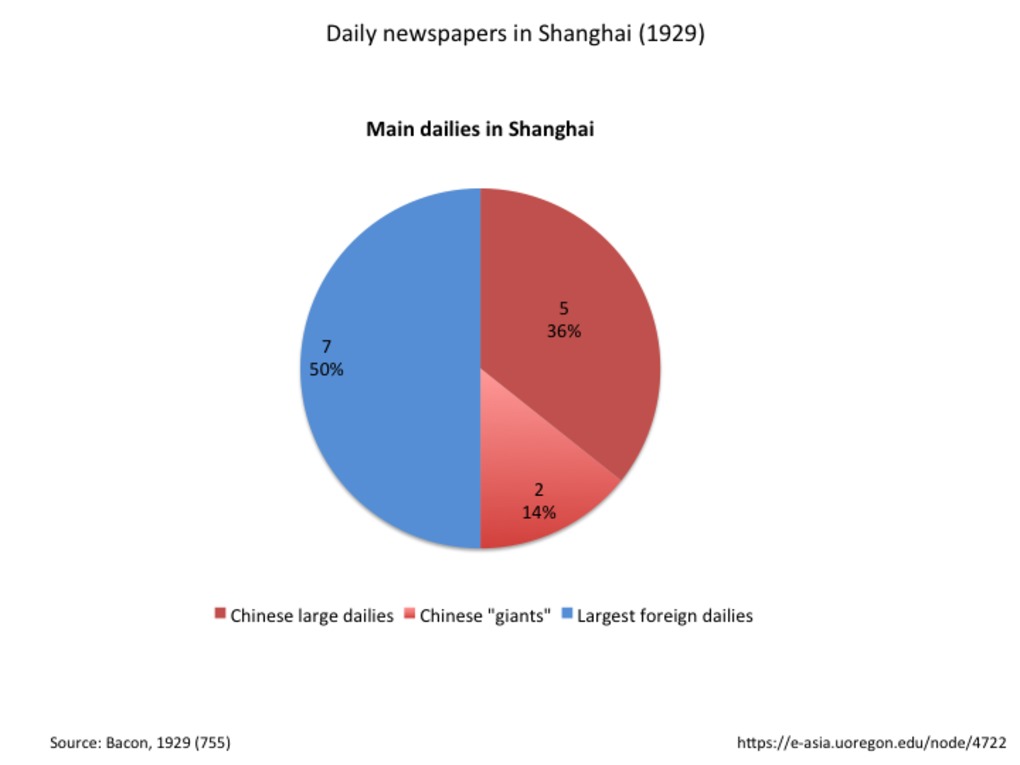 | 237 | Importance of daily newspapers published in Shanghai (1929) | This pie charts shows the distribution of the main daily newspapers published in Shanghai according to their size and importance. Three main types have been identified: Chinese giants (14%), Chinese large dailies (36%) and large foreign dailies (50%). Source: Bacon, 1929 (755) |
 | 236 | Number of daily newspapers in Shanghai and China (1929) | This pie charts shows the distribution of daily newspapers published in China between Shanghai and other places in China. Shanghai represents only 4% of daily publications. Yet these figures did not take into account the qualitative importance of the publication (in terms of readership, spatial coverage, longevity or advertising value). Source: Bacon, 1929 (755) |
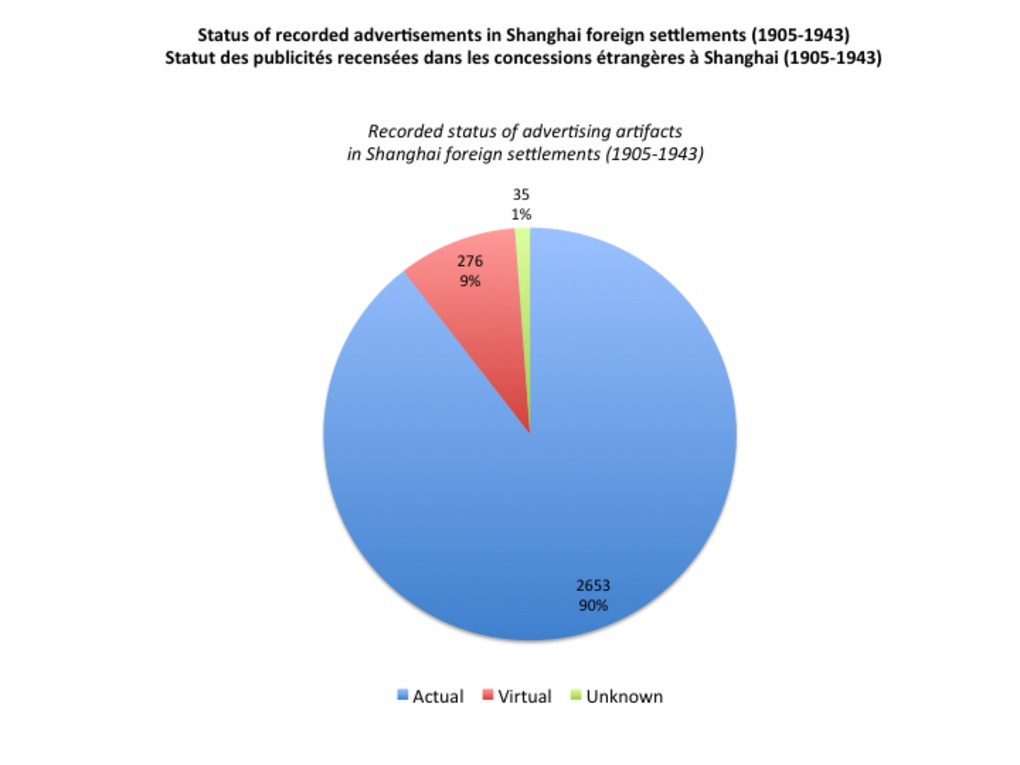 | 227 | Actual and virtual spaces of advertising in Shanghai (1905-1943) | This pie chart shows the global distribution between virtual (imaginary) (in blue) and actual (red) spaces of advertising in Shanghai foreign settlements (1905-1943). Uncertain status is materialized by the green color. This chart has been established after the Shanghai municipal archives. |
 | 234 | Advertising press media in China: distribution between daily and non daily publications (1929) | This pie chart shows the distribution of press advertising media between daily newspapers and non daily publications (periodicals, magazines) in China before 1929. Source: Bacon, 1929 (755). Daily papers are obviously overwhelming the press business in China before the 1930s (89%). |
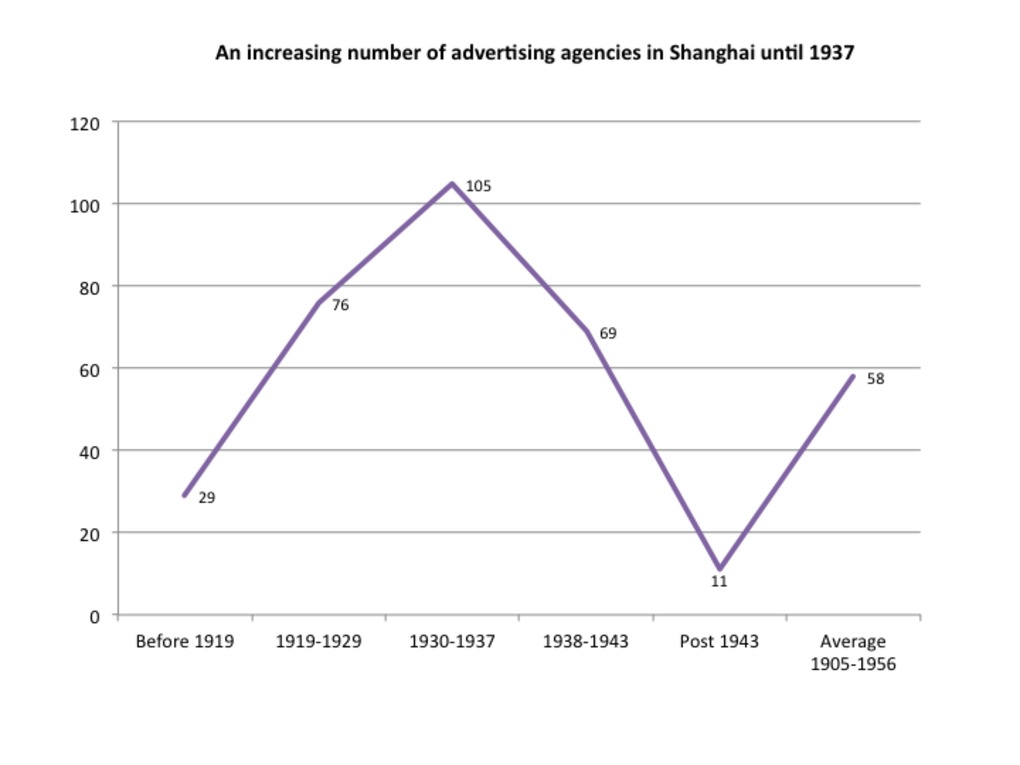 | 269 | Growth of advertising agencies in Shanghai (1905-1956) | This graph line aims to show the gradual development of advertising agencies in Shanghai. Their number more than doubled in the 1920s, then reached a climax in the 1930, and started to decline during the war 1937-1945. Yet the role of advertising agencies as central actors in the advertising profession was well established. The decline is mainly due to the departure of foreigners during the war, especially after the United States entered the war in Dec 1941, and after the restitution of foreign settlements in 1943. In 1956, the number of agencies was drastically reduced from about 60 to only 4, through a process of merging summoned by the governement at a national scale. The figures are based on the Shanghai Municipal Archives and other secondary sources (Bankers' Directory, 1933; Hong List, 1941; Morgan, 2003). |
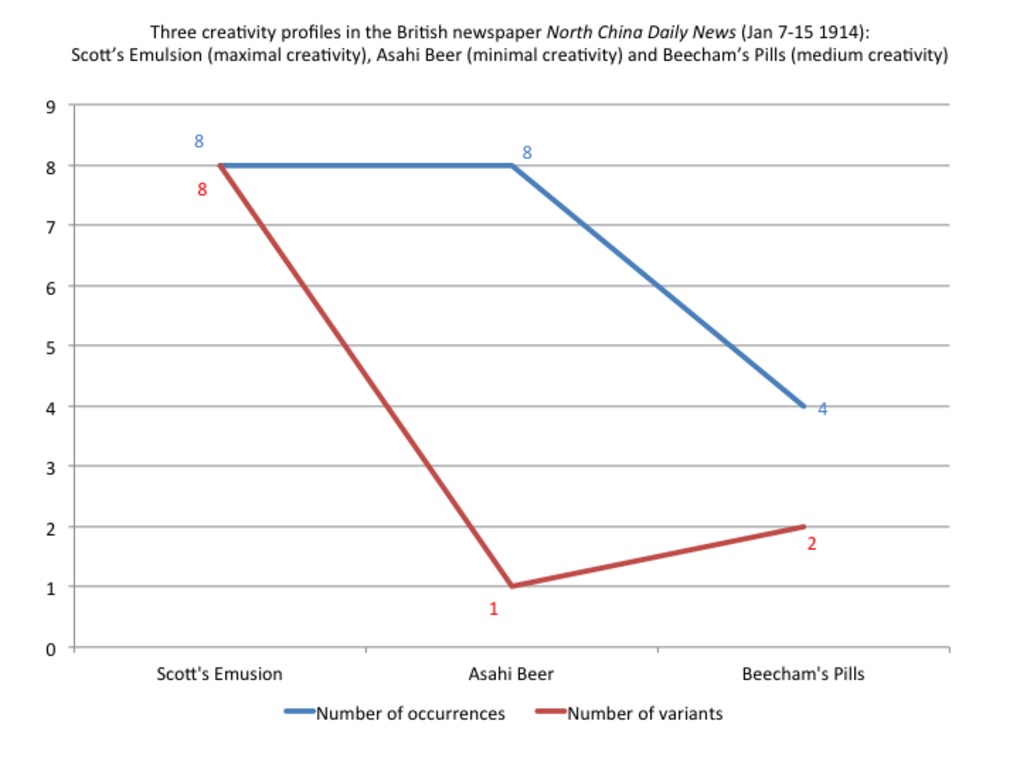 | 257 | Creativity profiles in North China Daily News advertisements (1914) | This graph aims to correlate the number of occurrences (blue line) to the number of variants (red line) in a given series of advertisements extracted from the Shanghai-based British newspaper North China Daily News in 1914. For consistency reasons, the measurements have been made after the same extended weekly sample as that used for the Chinese newspaper Shenbao (Jan 7-15, 1914). This graph reveals three creativity profiles. As in in the Chinese newspaper Shenbao, the medical brand Scott's Emulsion embodied the maximal creativity (8 variants/8 occurences), while the Japanese beer brand Asashi offered the minimal creativity (1 variant/8 occurrences) and Beecham's Pills displayed a medium creativity (1 variant (1 variant/3 occurrences). |
 | 256 | Creativity profiles in Shenbao advertisements (1914) | This graph aims to correlate the number of occurrences (blue line) to the number of variants (red line) in a given series of advertisements extracted from the Chinese newspaper Shenbao in 1914.The measurements have been made after an extended weekly sample of this newspaper (Jan 7-15, 1914). This graph reveals three creativity profiles: the medical brand Scott's Emulsion embodied the maximal creativity (8 variants/8 occurences), while the cigarette brand Three Castles offered the minimal creativity (1 variant/8 occurrences) and Doan Backache & Kidney Pills displayed a medium creativity (1 variant (1 variant/3 occurrences). |
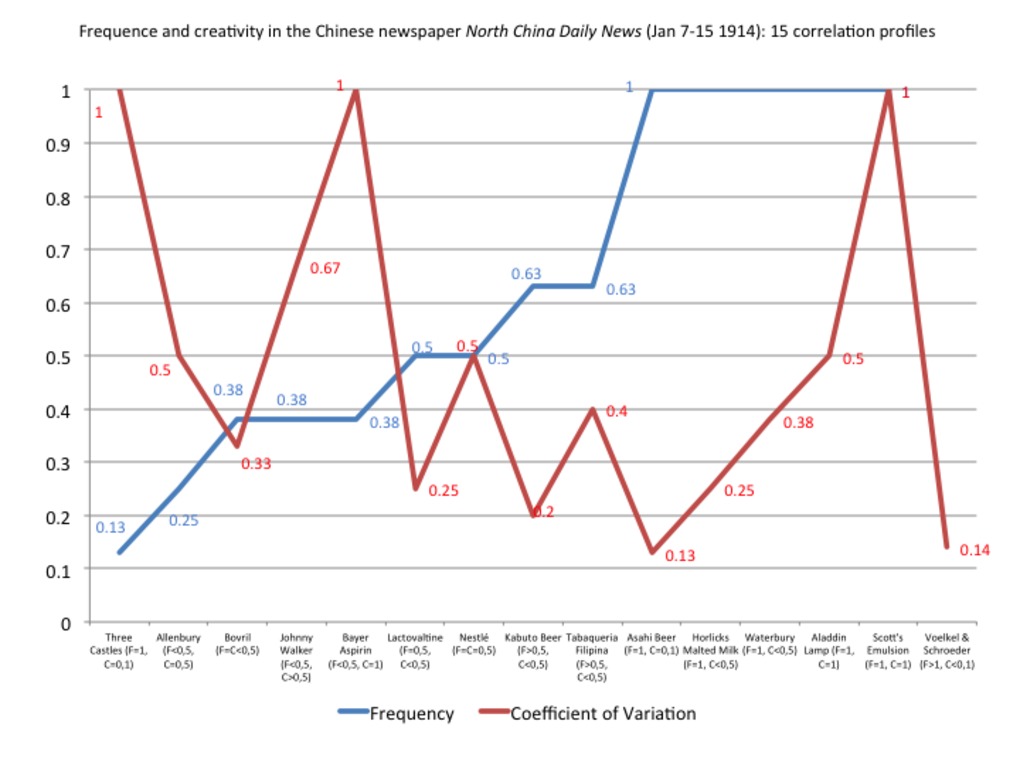 | 259 | Frequency and creativity in North China Daily News advertisements (1914) | This graph aims to correlate creativity (measured by the coefficient of variation) (red line) with frequency (blue line) in a given series of advertisements extracted from the Shanghai-based British newspaper North China Daily News in 1914.The measurements have been made after an extended weekly sample of this newspaper (Jan 7-15, 1914). Though there is a "logical" relation between high frequency and low creativity (Asahi Beer), advertising series in the Shenbao offered much more complexity in 1914. In effet, this graph actually reveals fifteen correlation profiles. |
 | 258 | Frequency and creativity in Shenbao advertisements (1914) | This graph aims to correlate creativity (measured by the coefficient of variation) (red line) with frequency (blue line) in a given series of advertisements extracted from the Chinese newspaper Shenbao in 1914.The measurements have been made after an extended weekly sample of this newspaper (Jan 7-15, 1914). Though there is a "logical" relation between high frequency and low creativity (Three Castles), advertising series in the Shenbao offered much more complexity in 1914. In effet, this graph actually reveals eleven correlation profiles. |
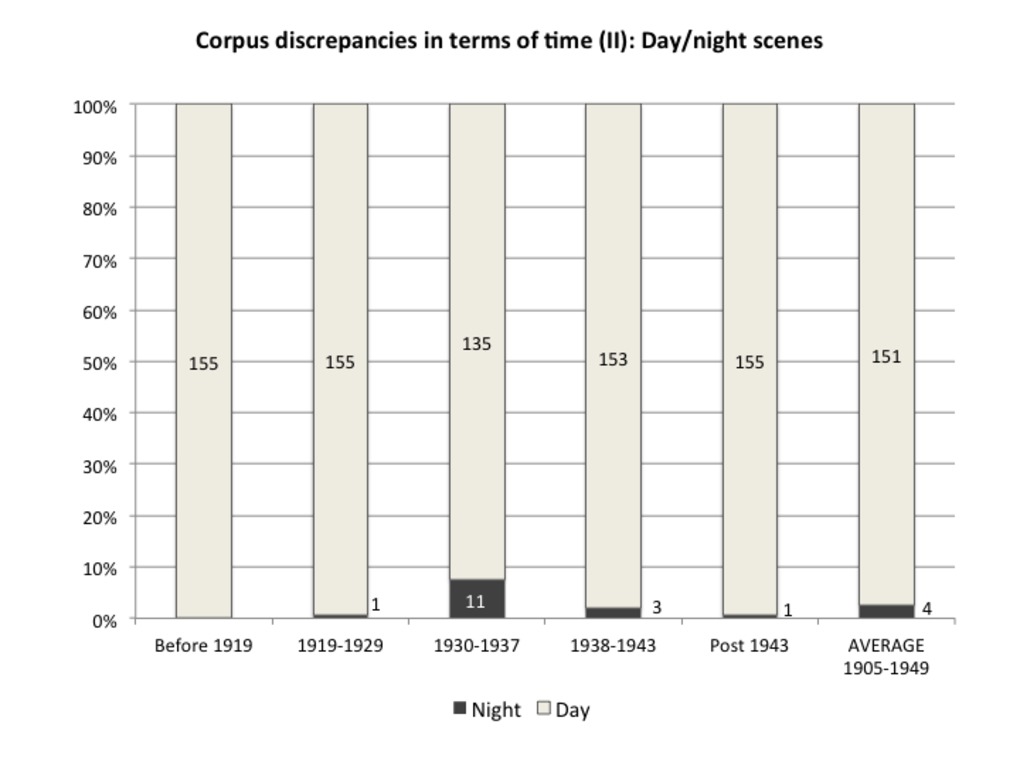 | 311 | A critical view of my photographic corpus (1905-1949): Temporal discrepancies (day/night scenes) | This graph aims to better visualize corpus discrepancies in terms of time - more precisely the uneven distribution between day/night scene, depending on timeslices. This graph been drawn after the related table (See the "Tables" section - Table 171). |
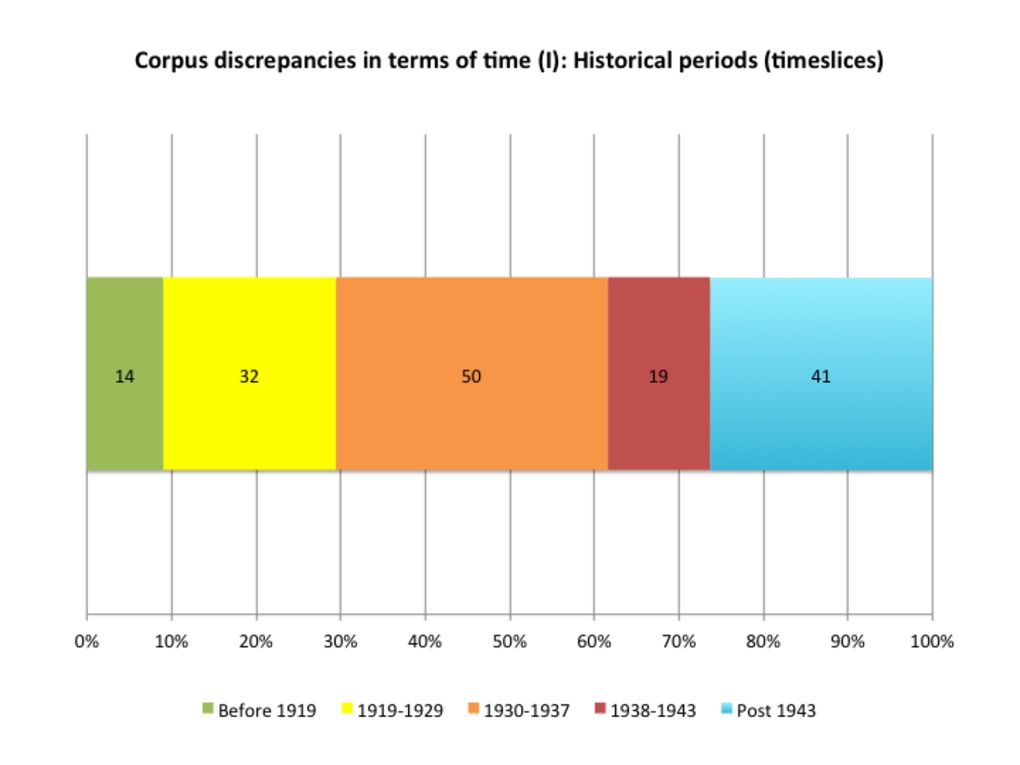 | 310 | A critical view of my photographic corpus (1905-1949): Temporal discrepancies (timeslices) | This graph aims to better visualize corpus discrepancies in terms of time (number and % of photos taken per timeslices). This graph has been drawn after the related table (See the "Tables" section - Table 171). |
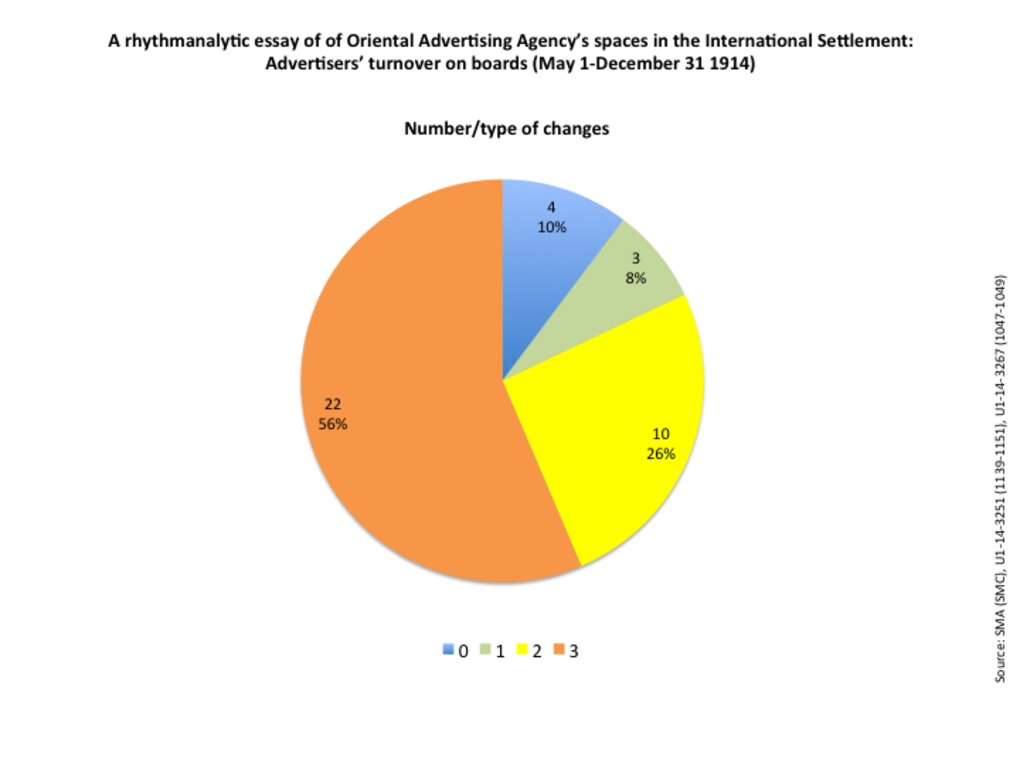 | 263 | Advertisers’ turnover on Oriental Advertising Agency's boards in the International Settlement (May 1-December 31 1914) | These set of three charts aims to refine the rhythmanalysis based on contracts duraction by appreciating the nature and degree of turnover within the same advertising spaces rented by the Oriental Advertising Agency in 1914. For that very purpose, we have established scale of change ranging from 0 to 3:
The pie chart suggests that Oriental Advertising Agency's spaces are marked by a high degree of instability in wartime. The maximal degree of change (3) represent 56% of the changes, followed by changes of location (26%), identical revewal (10%) and change of dimensions. The measurements are based on the the census made by the S.M.C. in 1914 and the regular inventories of Oriental Advertising Agency's boards sent to the Council by the company itself, between May 1 and December 31, 1914. Source: SMA (SMC), U1-14-3251 (1139-1151), U1-14-3267 (1047-1049). |
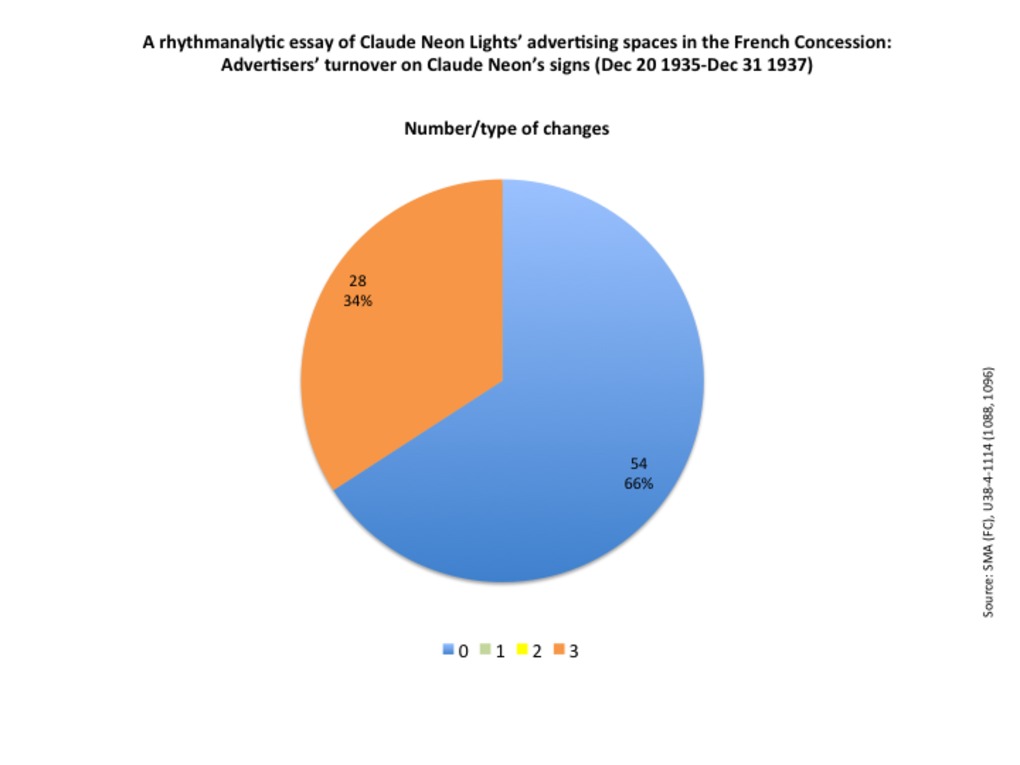 | 274 | Advertiser’s turnover on Claude Neon’s signs in the French Concession (Dec 20 1935-Dec 31 1937) | These set of three charts aims to refine the rhythmanalysis based on contracts duraction by appreciating the nature and degree of turnover within the advertising spaces owned by Claude Neon Lights between 1935 and 1937. For that very purpose, we have established scale of change ranging from 0 to 3:
The pie chart clearly reveals that Claude Neon Lights' signs enjoyed a relatively high degree of stability: 2/3 of signs remained unchanged during the entire period, while only 1/3 had experienced a change of advertiser. On can note that there is no intermediary changes, in terms of location or dimension (either a change of owner, either no change at all). This is due to the nature of the sign itsefl, firmly attached to the shop or building, with fixed dimensions. The measurements are based on the regular lists of signs that Claude Neon Lights sent to the French Municipal Council between December, 20 1935 and December, 31 1937, plus a few scattered signs recorded in other files in the Shanghai Municipal Archives (French concession and International Settlement in 1931 and 1941). Source: SMA (FC), U38-4-1114; SMA (SMC), U1-14-3261 (0246). |
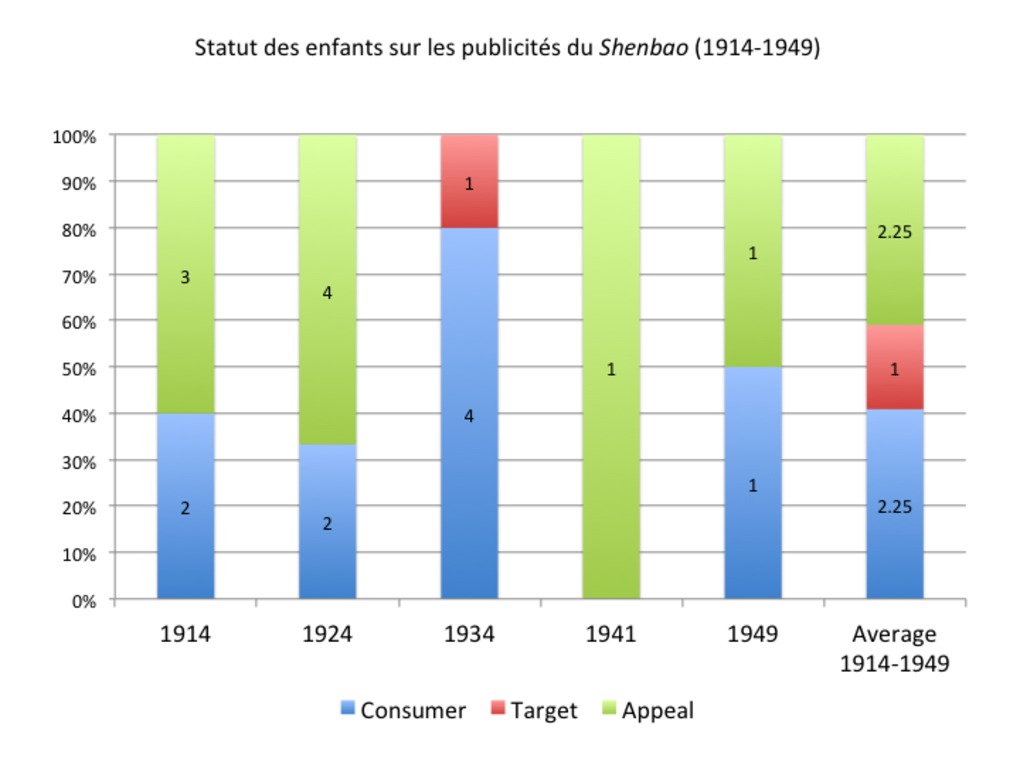 | 126 | Statut des enfants représentés sur les publicités du Shenbao (1914-1949) | Statut des enfants représentés sur les publicités du Shenbao (1914-1949) : simple "appât" (child appeal), cible du message publicitaire ou consommateur à part entière ? Mesures réalisées à partir de nos cinq échantillons de référence du quotidien chinois Shenbao : 1er-30 Janvier 1914 (échantillon volontairement élargi à un mois en raison du faible nombre d'images par numéro), 3 janvier 1924, 5 janvier 1934, 1er février 1941 et 1er janvier 1949. |
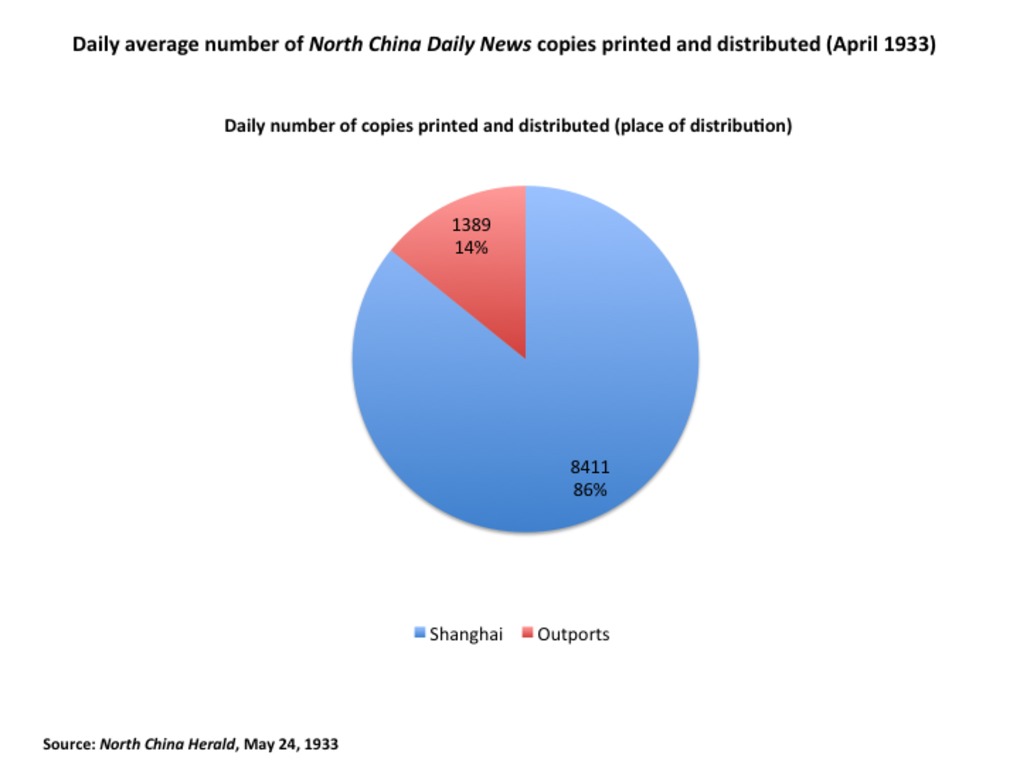 | 303 | North China Daily News circulation: Average daily number of copies printed and distributed (1933) | Source: "A circulation census. Increase in Chinese readers: Distribution Statistics." North China Herald and Supreme Court Gazette. May 24, 1933. |
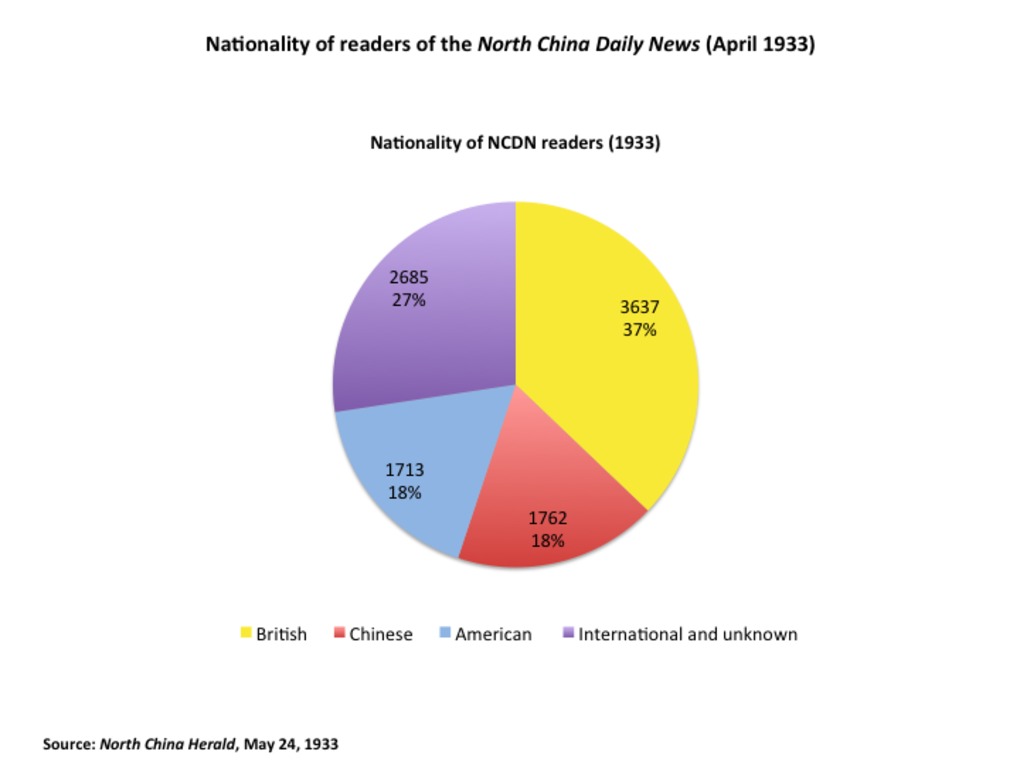 | 304 | North China Daily News circulation: Readers' nationality (1933) | Source: "A circulation census. Increase in Chinese readers: Distribution Statistics." North China Herald and Supreme Court Gazette. May 24, 1933. |
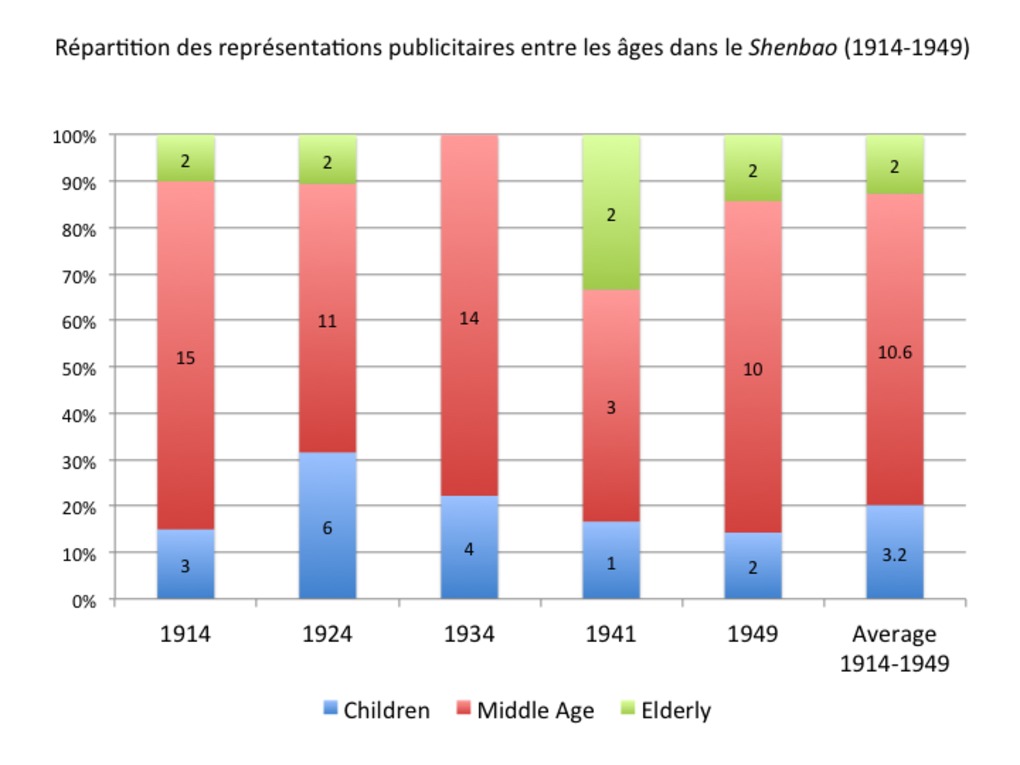 | 125 | Répartition des représentations publicitaires entre les âges dans le Shenbao (1914-1949) | Répartition entre les âges des représentations publicitaires dans le Shenbao (1914-1949). Mesures réalisées à partir de nos cinq échantillons de référence du quotidien chinois Shenbao : 1er-30 Janvier 1914 (échantillon volontairement élargi à un mois en raison du faible nombre d'images par numéro), 3 janvier 1924, 5 janvier 1934, 1er février 1941 et 1er janvier 1949. |
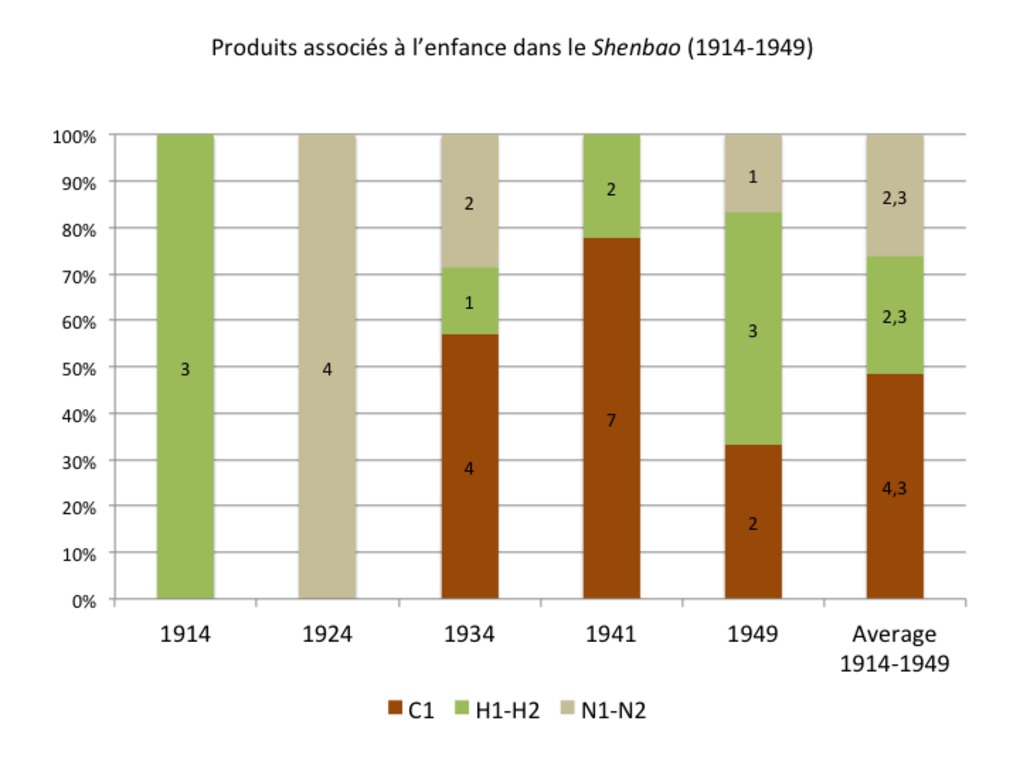 | 124 | Produits associés à l’enfance dans le Shenbao (1914-1949) | Produits associés à l'enfance dans le Shenbao (1914-1949). Mesures réalisées à partir de nos cinq échantillons de référence du quotidien chinois Shenbao : 1er-30 Janvier 1914 (échantillon volontairement élargi à un mois en raison du faible nombre d'images par numéro), 3 janvier 1924, 5 janvier 1934, 1er février 1941 et 1er janvier 1949. |
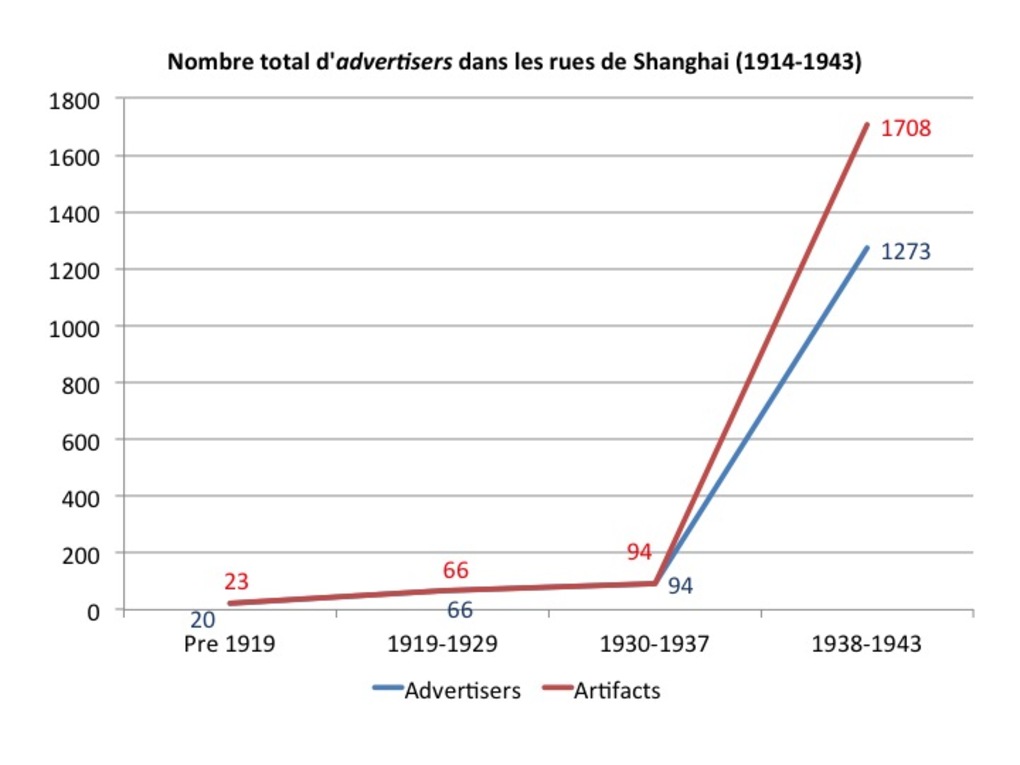 | 187 | Evolution du nombre d'annonceurs (advertisers) dans les rues de Shanghai entre 1914 et 1943 | Nombre total d'annonceurs (advertisers) dans les rues de Shanghai, rapporté au nombre total de publicités. Les mesures ont été réalisées à partir des recensements et demandes de permis relevés dans les archives municipales. La fiabilité des chiffres varie selon les périodes :le recensement de 1914 dans la concession internationale offre une base solide pour les débuts de la période, néanmoins restreinte aux clients de l'Oriental Advertising Agency. Les données sont très clairsemées en 1919-1929 et biaisées en 1930-1937 par les relevés de Claude Neon Light qui constituent notre principale source dans la concession française. Si les chiffres sont plus fiables pour la période 1938-1943 (recensement relativement exhaustif de 1943 dans la concession internationale), l’historien souffre de l’absence d’archives après 1943. L'écart entre les courbes est inverse de celui dans la presse : le nombre d'annonceurs connus est inférieur ou égal à celui des artefacts : les archives s'intéressent davantage au support qu'à l'annonceur, et n'enregistrent généralement qu'un seule compagnie. L'augmentation du nombre d'annonceurs sur la longue durée s'explique d'abord et avant tout par l'augmentation du nombre d'artefacts/supports recensés et d'annonceurs identifiés. La courbe ascendante est donc le reflet de la réalité documentaire et des préoccupations municipales plus que celle du terrain : elle traduit l'attention plus aiguë des autorités pour la publicité de rue et la précision accrue des instruments de mesure et des informations recensées. |
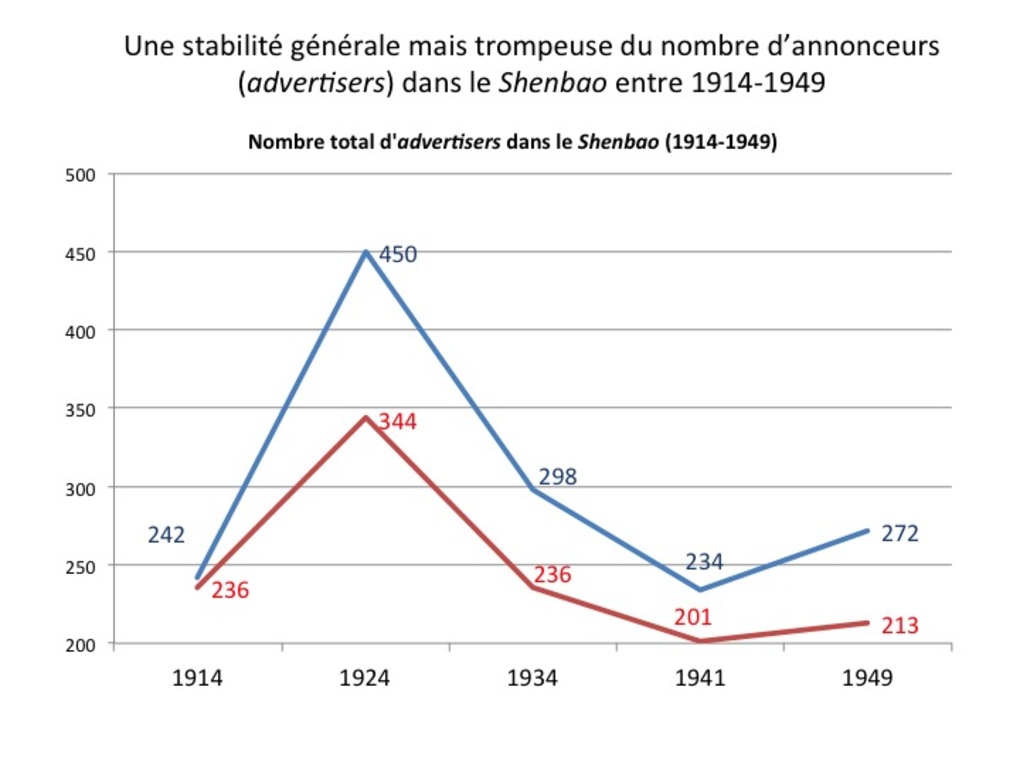 | 151 | Evolution du nombre d'annonceurs (advertisers) dans le Shenbao entre 1914 et 1949 | Nombre total d'annonceurs (advertisers) dans le Shenbao entre 1914 et 1949, rapporté au nombre total de publicités. Les mesures ont été réalisées à partir de nos échantillons habituels : 7 janvier 1914, 3 janvier 1924, 5 janvier 1934, 1er février 1941 et 1er janvier 1949. Si la courbe obtenue révèle une stabilité sur la longue durée autour de 250 annonceurs en moyenne, cette stabilité est trompeuse : la courbe marque de grandes variations au cours de la période, avec notamment un pic en 1924 et un creux en 1941. L'écart surprenant entre les deux courbes (nombre d'annonceurs supérieur à celui des publicités) s'explique par la fréquence élevée des publicités "collectives" ou à "annonceurs multiples" (associations de plusieurs compagnies, indication du ou des distributeurs locaux). |
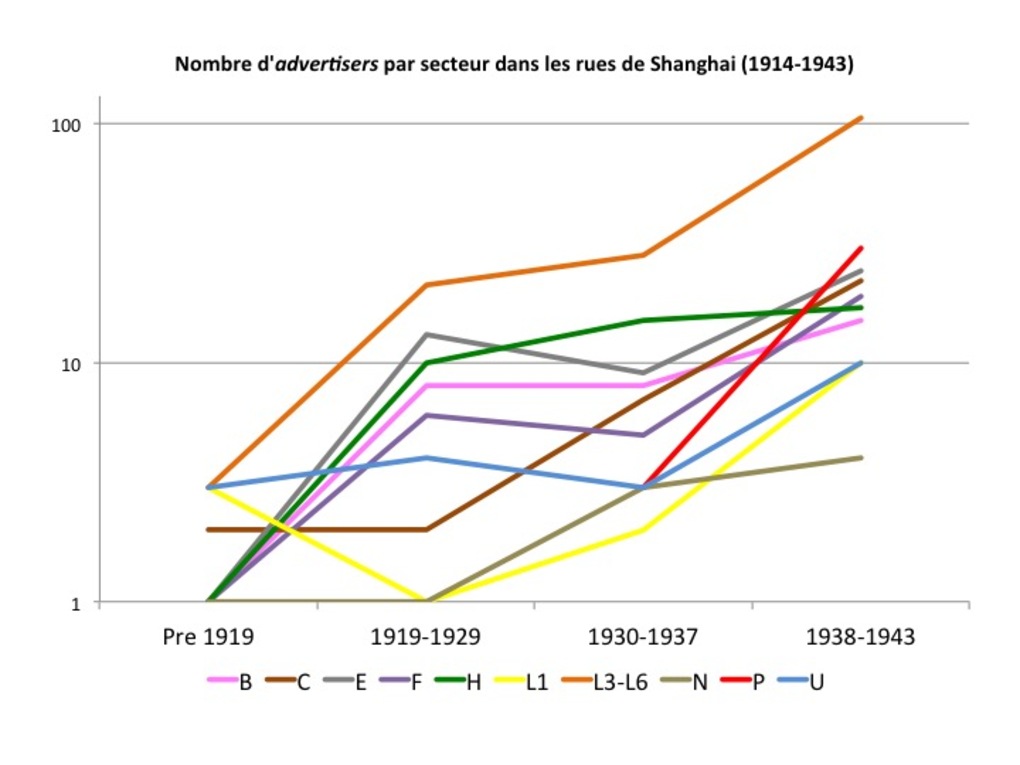 | 189 | Evolution du nombre d'annonceurs (advertisers) par secteurs productifs dans les rues de Shanghai (1914-1943) | Nombre d'annonceurs (advertisers) identifiés pour chaque secteur productif dans les rues de Shanghai entre 1914 et 1943 Les mesures ont été réalisées à partir des archives municipales, dont les relevés sont quantitativement et qualitativement inégaux. L'axe des abscisses indiquent les années, l'axe des ordonnées le nombre de compagnies. On a repris le code couleur et les lettres habituels pour les secteurs. Ce jeu de courbes est difficilement lisible mais il a le mérité de montrer que le degré de compétition varie selon les secteurs et au fil du temps. |
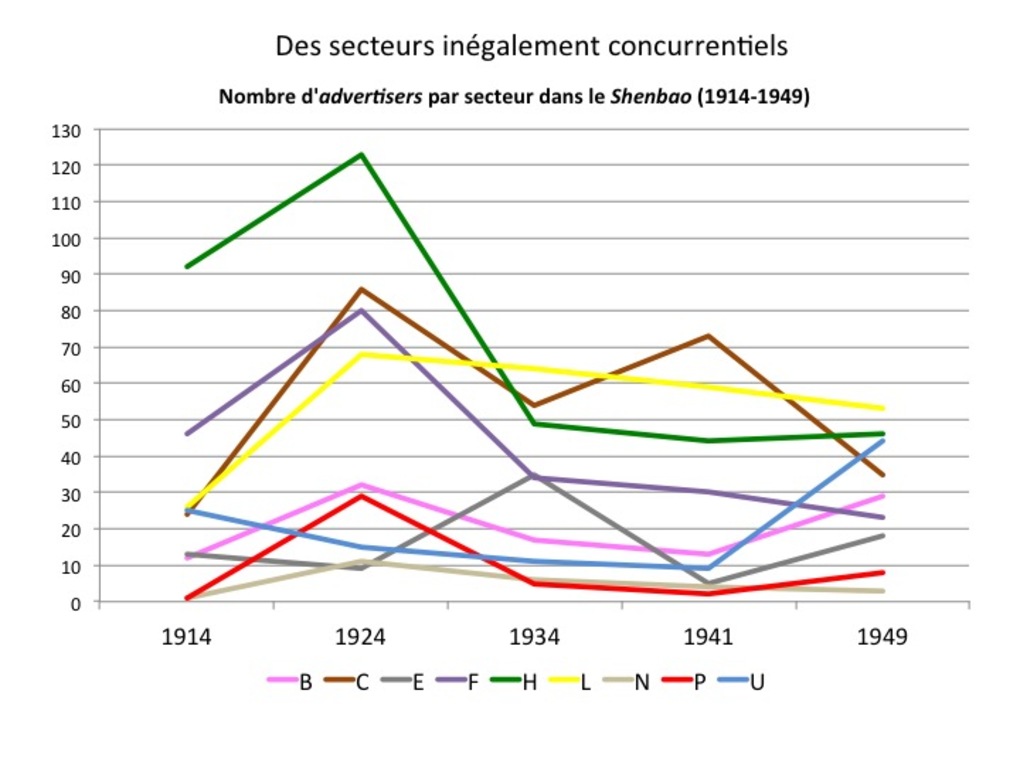 | 153 | Evolution du nombre d'annonceurs (advertisers) par secteurs productifs dans le Shenbao entre 1914 et 1949 | Nombre d'annonceurs (advertisers) dans chaque secteur productif dans le Shenbao entre 1914 et 1949. Les mesures ont été réalisées à partir de nos échantillons habituels : 7 janvier 1914, 3 janvier 1924, 5 janvier 1934, 1er février 1941 et 1er janvier 1949. L'axe des abscisses indiquent les années, l'axe des ordonnées le nombre de compagnies. On a repris le code couleur et les lettres habituels pour les secteurs. Ce jeu de courbes est difficilement lisible mais il a le mérité de montrer que le degré de compétition varie selon les secteurs et au fil du temps. Par exemple, si le secteur pharmaceutique est le plus ouvert à la concurrence tout en long de la période, la compétition décroît à partir de 1934. Le secteur des loisirs suit une trajectoire inverse, mais la concurrence reste relativement stable à partir de 1924. Certains secteurs restent très fermés, presque monopolistiques, comme l'industrie ou les services et transports, qui ne s'ouvrent à la concurrence qu'à la fin de la période. |