


 12345
12345 

filter by Title A B C D E F G H I J K L M N O P Q R S T U V W X Y Z [all]
| ID | Title | Description | |
|---|---|---|---|
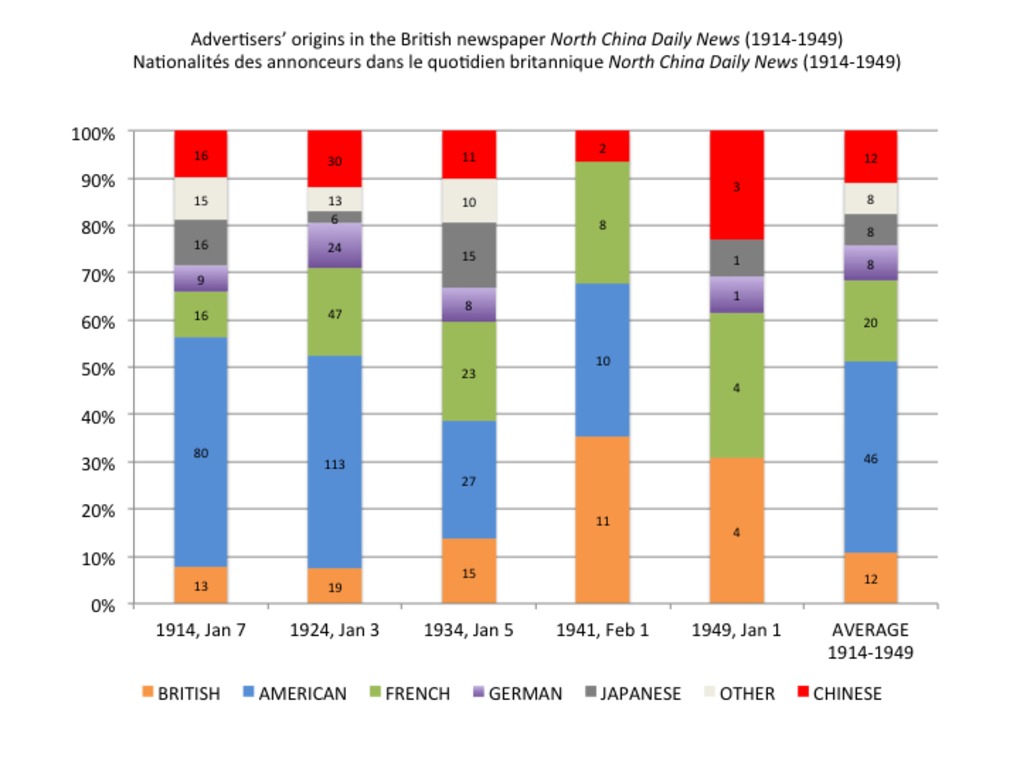 | 245 | Origin of advertisers in the British newspaper North China Daily News (1914-1949) | Nationalités des annonceurs dans le quotidien britannique North China Daily News (1914-1949) Par cohérence, les mesures ont été réalisées à partir des cinq mêmes échantillons que pour le quotidien chinois Shenbao : 7 janvier 1914, 3 janvier 1924, 5 janvier 1934, 1er fevrier 1941, 1er janver 1949. Pour facliter les comparaisons, on a appliqué la même typologie et le même code couleur que pour le Shenbao. Origin/Nationality of advertisers in the British newspaper North China Daily News (1914-1949) For consistency reasons, the measurements were made after the same five samples as those used for the Chinese newspaper Shenbao (Jan 7, 1914; Jan 3, 1924; Jan 5, 1934; Feb 1, 1941; Jan 1, 1949). In order to facilitate comparisons, we have applied the same typology and color code as used for the Chinese newspaper Shenbao. |
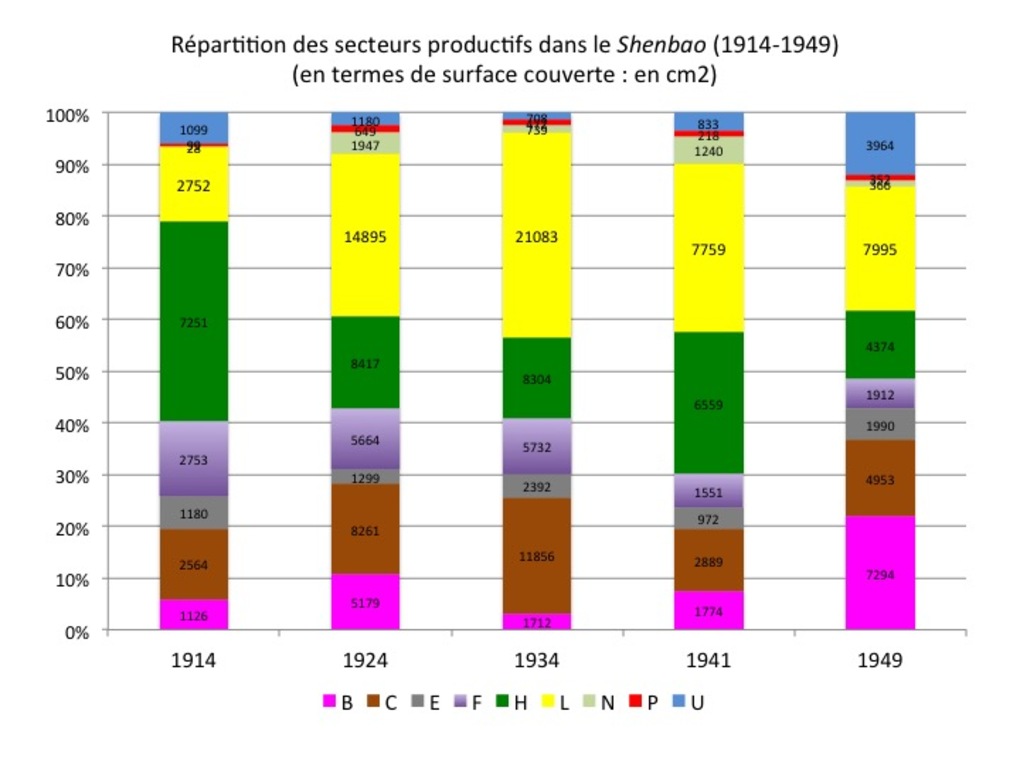 | 130 | Types of products and business sectors in the Chinese newspaper Shenbao (in spatial terms) (1914-1949) | Répartition de l'espace entre produits/secteurs productifs en termes de surfaces couvertes dans le quotidien chinois Shenbao (1914-1949) Types of produits et secteurs productifs exposés dans le Shenbao (1914-1949). Cette répartition est mesurée en termes d'espace (surface couverte, en cm2). Les mesures ont été réalisées à partir de nos cinq échantillons habituels du Shenbao : 7 janvier 1914, 3 janvier 1924, 5 janvier 1934, 1er fevrier 1941, 1er janver 1949. On a appliqué avec cohérence le code des lettres et des couleurs associé à notre typologie (http://madspace.org/cooked/Drawings?ID=114 ; http://madspace.org/cooked/Trees?ID=101). Types of products and business sectors advertised in the Chinese newspaper Shenbao (in terms of areas/surfaces) Types of products and business sectors advertised in the Chinese newspaper Shenbao (in terms of areas, that is the surface covered by advertisements). The measurements were made after our five usual samples of the newspaper Shenbao (Jan 7, 1914; Jan 3, 1924; Jan 5, 1934; Feb 1, 1941; Jan 1, 1949). Each type of product is associated to a letter/number and color code, according to the following typology: http://madspace.org/cooked/Drawings?ID=114 ; http://madspace.org/cooked/Trees?ID=101. |
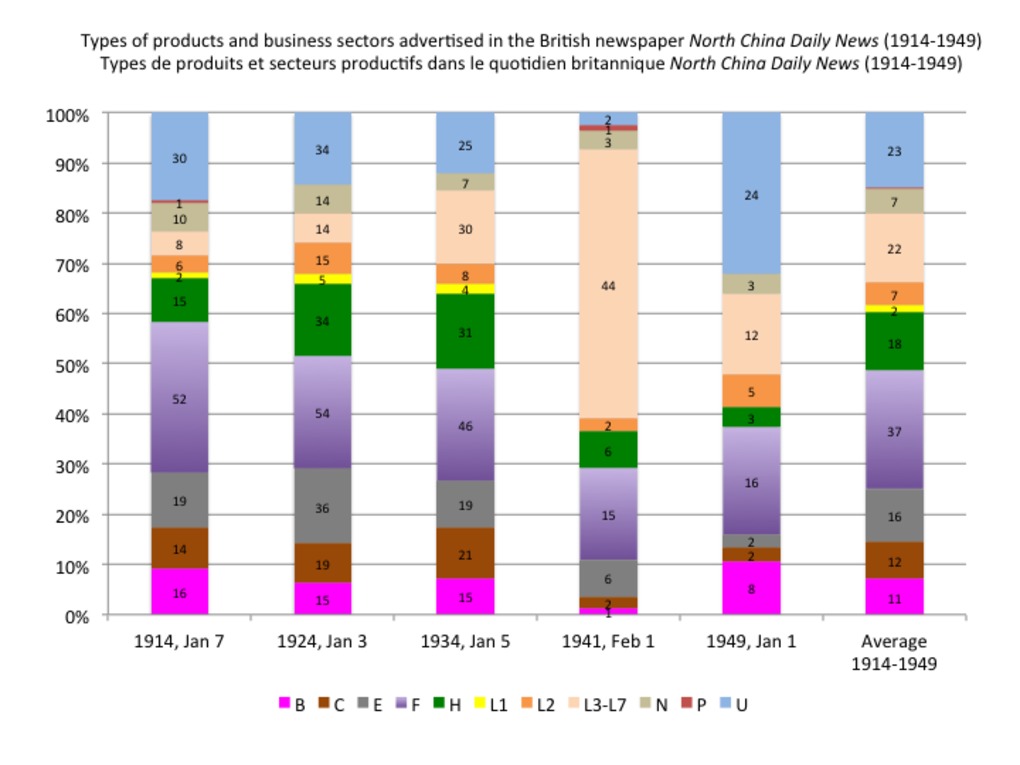 | 244 | Types of products and business sectors advertised in the British newspaper North China Daily News (1914-1949) | Répartition démographique des secteurs productifs dans le North China Daily News (1914-1949) Proportion de produits/secteurs productifs exposés dans le quotidien britannique North China Daily News (1914-1949). Cette répartition est mesurée en termes de population (nombre de publicités). Par cohérence, les mesures ont été réalisées à partir des cinq mêmes échantillons que pour le quotidien chinois Shenbao : 7 janvier 1914, 3 janvier 1924, 5 janvier 1934, 1er fevrier 1941, 1er janver 1949. On a appliqué avec cohérence le code des lettres et des couleurs associé à notre typologie (http://madspace.org/cooked/Drawings?ID=114 ; http://madspace.org/cooked/Trees?ID=101). Proportion of products and business sectors advertised in the British newspaper North China Daily News (1914-1949) Types of products and business sectors advertised in the Shanghai-based British newspaper North China Daily News (in terms of population/number of ads). For consistency reasons, the measurements were made after the same five samples as those used for the Chinese newspaper Shenbao (Jan 7, 1914; Jan 3, 1924; Jan 5, 1934; Feb 1, 1941; Jan 1, 1949). Each type of product is associated to a letter/number and a color code, according to the following typology: http://madspace.org/cooked/Drawings?ID=114 ; http://madspace.org/cooked/Trees?ID=101. |
 | 129 | Types of products and business sectors advertised in the Chinese newspaper Shenbao (in terms of population/number of ads) (1914-1949) | Répartition démographique des secteurs productifs dans le quotidien chinois Shenbao (1914-1949) Proportion de produits/secteurs productifs exposés dans le quotidien britannique Shenbao (1914-1949). Cette répartition est mesurée en termes de population (nombre de publicités). Les mesures ont été réalisées à partir de nos cinq échantillons habituels du Shenbao : 7 janvier 1914, 3 janvier 1924, 5 janvier 1934, 1er fevrier 1941, 1er janver 1949. On a appliqué avec cohérence le code des lettres et des couleurs associé à notre typologie (http://madspace.org/cooked/Drawings?ID=114 ; http://madspace.org/cooked/Trees?ID=101). Proportion of products and business sectors advertised in the Chinese newspaper Shenbao (1914-1949) Types of products and business sectors advertised in the Chinese newspaper Shenbao (in terms of population/number of ads). The measurements were made after our five usual samples of the newspaper Shenbao (Jan 7, 1914; Jan 3, 1924; Jan 5, 1934; Feb 1, 1941; Jan 1, 1949). Each type of product is associated to a letter/number and color code, according to the following typology: http://madspace.org/cooked/Drawings?ID=114 ; http://madspace.org/cooked/Trees?ID=101.
|
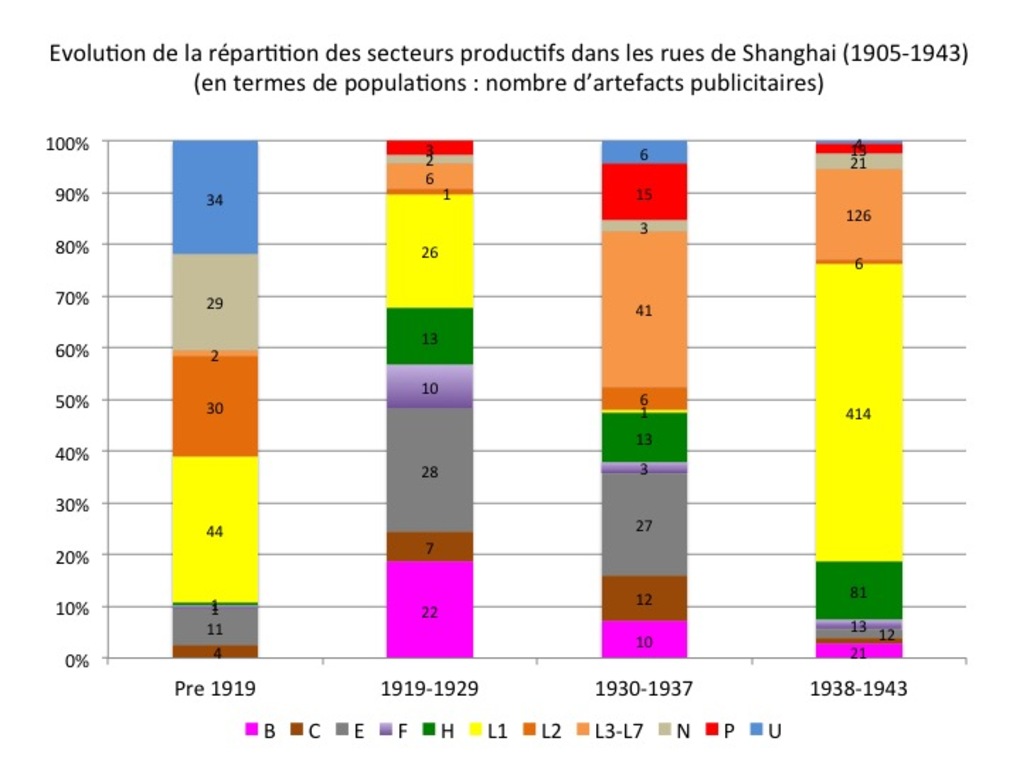 | 136 | Répartition démographique des secteurs productifs dans les concessions étrangères à Shanghai (1905-1943) | Répartition démographique des secteurs productifs dans les concessions étrangères à Shanghai (1905-1943). Cette répartition est mesurée en termes de population (nombre de publicités). Les mesures ont été réalisées à partir des archives municipales des concessions étrangères, essentiellement trois enquêtes systématiques (en 1914 et 1943 dans la Concession Internationale, en 1933-1937 pour les néons de Claude Neon Light dans la concession française), plus les relevés réalisés à partir des demandes de permis individuels tout au long de la période. Comme pour la presse, on a appliqué avec cohérence le code des lettres et des couleurs associé à notre typologie (http://madspace.org/cooked/Drawings?ID=114 ; http://madspace.org/cooked/Trees?ID=101). |
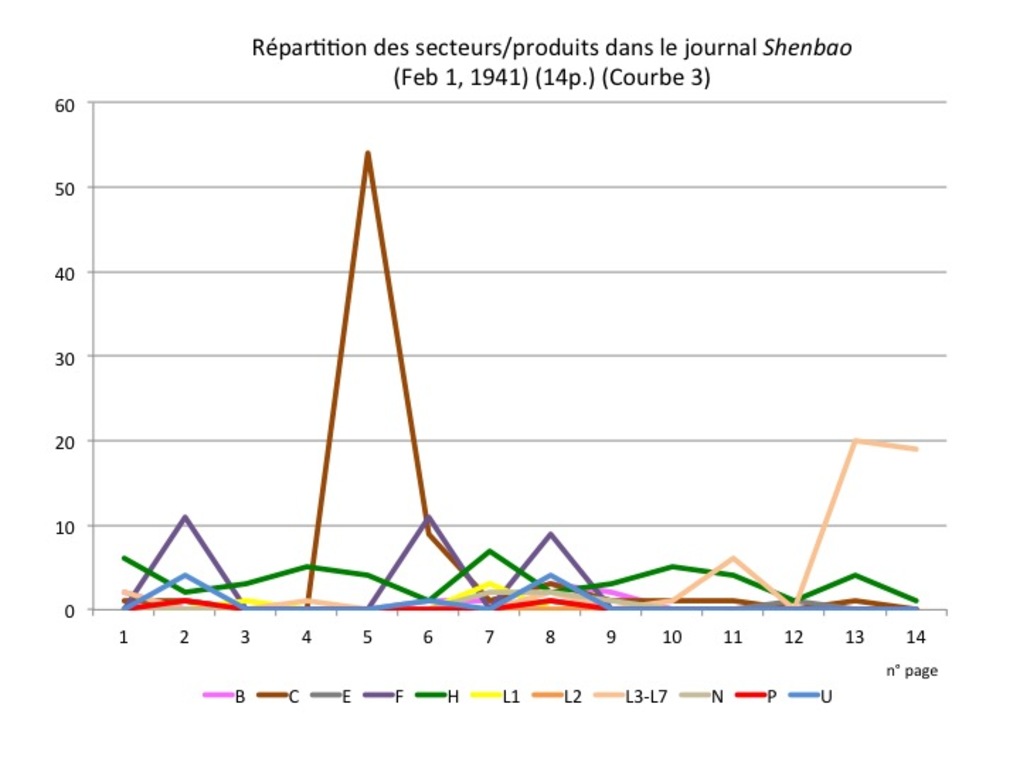 | 134 | Répartition des produits le Shenbao du 1er février 1941 | Répartition des produits dans le numéro du Shenbao du 1er février 1941 (en termes de population : nombre de publicités par page). L'axe des abscisses indique le numéro de page, l'axe des ordonnées le nombre de publicités. On a appliqué avec cohérence le code des lettres et des couleurs associé à notre typologie (http://madspace.org/cooked/Drawings?ID=114 ; http://madspace.org/cooked/Trees?ID=101). |
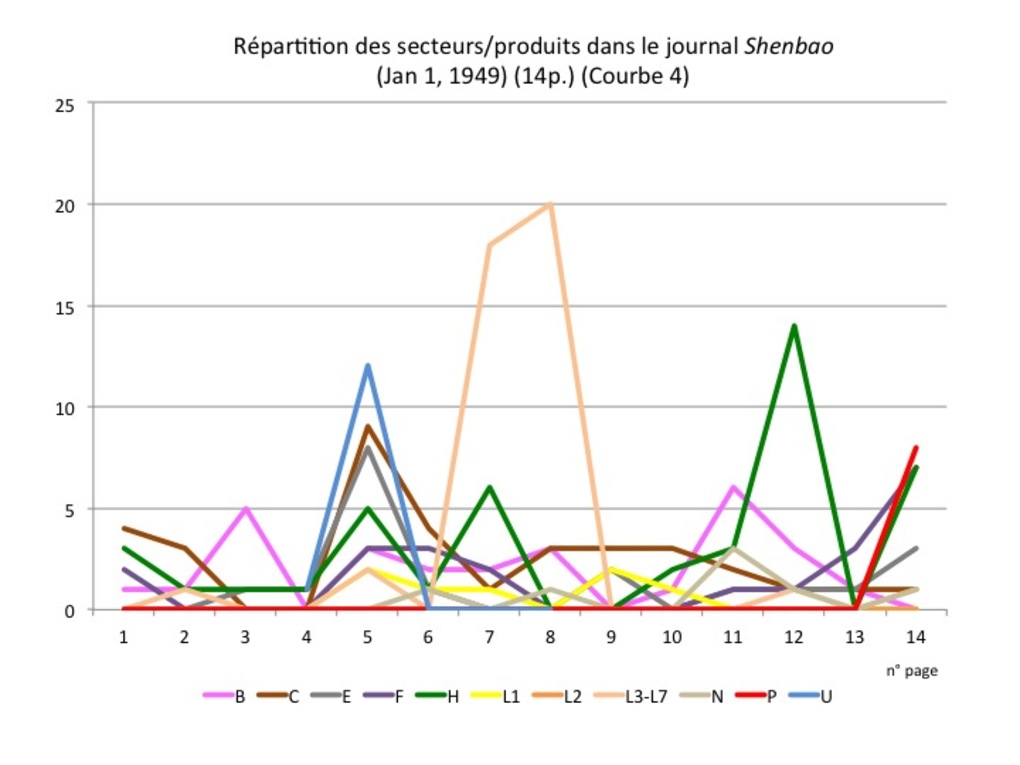 | 135 | Répartition des produits le Shenbao du 1er janvier 1949 | Répartition des produits dans le numéro du Shenbao du 1er janvier 1949 (en termes de population : nombre de publicités par page). L'axe des abscisses indique le numéro de page, l'axe des ordonnées le nombre de publicités. On a appliqué avec cohérence le code des lettres et des couleurs associé à notre typologie (http://madspace.org/cooked/Drawings?ID=114 ; http://madspace.org/cooked/Trees?ID=101). |
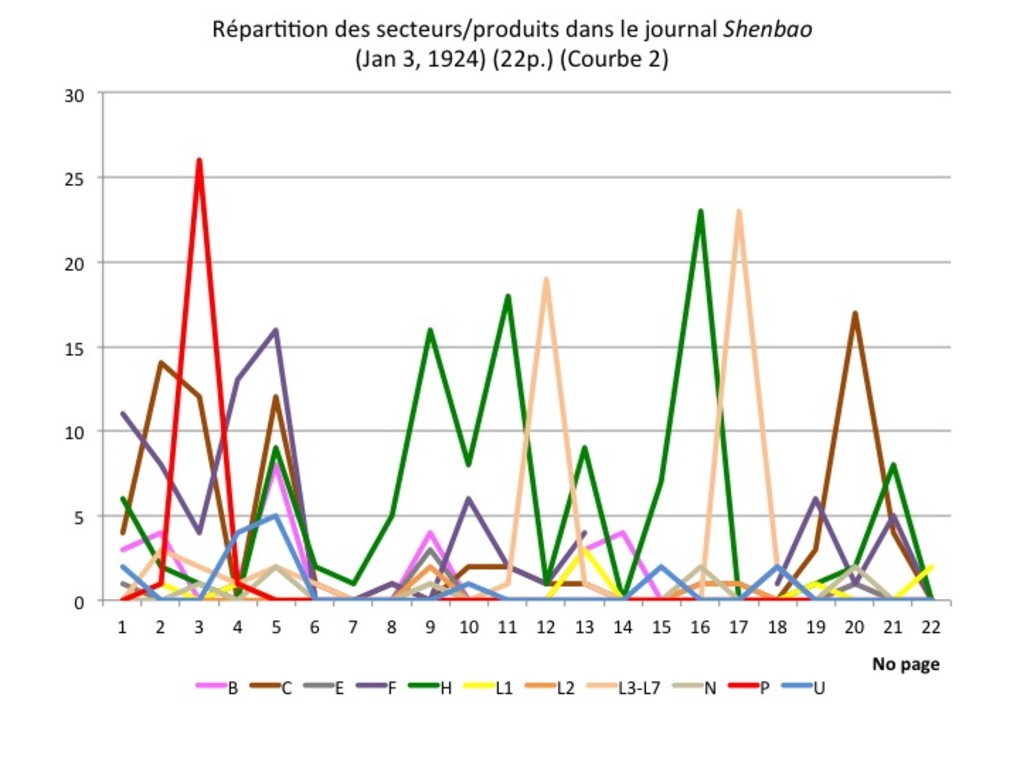 | 132 | Répartition des produits le Shenbao du 3 janvier 1924 | Répartition des produits dans le numéro du Shenbao du 3 janvier 1924 (en termes de population : nombre de publicités par page). L'axe des abscisses indique le numéro de page, l'axe des ordonnées le nombre de publicités. On a appliqué avec cohérence le code des lettres et des couleurs associé à notre typologie (http://madspace.org/cooked/Drawings?ID=114 ; http://madspace.org/cooked/Trees?ID=101). |
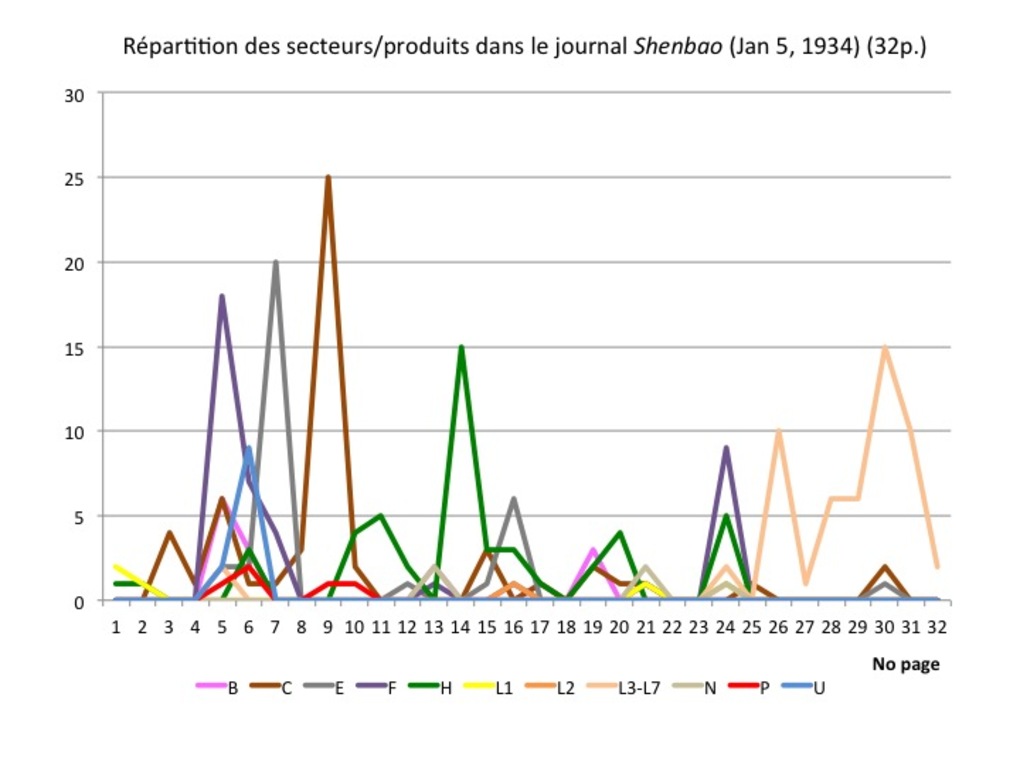 | 133 | Répartition des produits le Shenbao du 5 janvier 1934 | Répartition des produits dans le numéro du Shenbao du 5 janvier 1934 (en termes de population : nombre de publicités par page). L'axe des abscisses indique le numéro de page, l'axe des ordonnées le nombre de publicités. On a appliqué avec cohérence le code des lettres et des couleurs associé à notre typologie (http://madspace.org/cooked/Drawings?ID=114 ; http://madspace.org/cooked/Trees?ID=101). |
 | 131 | Répartition des produits le Shenbao du 7 janvier 1914 | Répartition des produits dans le numéro du Shenbao du 7 janvier 1914 (en termes de population : nombre de publicités par page). L'axe des abscisses indique le numéro de page, l'axe des ordonnées le nombre de publicités. On a appliqué avec cohérence le code des lettres et des couleurs associé à notre typologie (http://madspace.org/cooked/Drawings?ID=114 ; http://madspace.org/cooked/Trees?ID=101). |
 | 271 | Gradual sinification process of advertising agencies in Shanghai (1905-1956) | This bar chart aims to show the sinification process of the advertising profession in Shanghai. While foreign agencies represented 65% of all agencies in Shanghai in 1919, their share gradually declined in the long term 1919-1943. Though they still represented a short majority between 1919-1937, their share fell down to 35% at the end of the period (1938-1956). Their decline proved beneficial to Chinese agencies, whose share climbed from 30% in 1919 to almost 60% during the war 1938-1945. Japanese agencies remained a minority in Shanghai: an average of only 15% during the entire period, only 5% in 1915 (1 agency) and a maximum of 25% in the 1920s. The figures are based on the Shanghai Municipal Archives and other secondary sources (Bankers' Directory, 1933; Hong List, 1941; Morgan, 2003). |
 | 270 | Gradual catch-up process by Chinese advertising agencies in Shanghai (1905-1956) | This graph line aims to show the rapid growth of Chinese advertising agencies in Shanghai and gradual catch-up process in the long-term. While foreign agencies were far more numerous until 1929, the number of Chinese advertising agencies more than doubled in the 1920s (from 9 in 1919 to 24 in 1929) and 1930s (from 24 in 1930 to 42 in 1937). Although they experienced a slight decline during the war 1937-1945, Chinese agencies eventually led the profession in Shanghai at the end of the period (36 Chinese vs. 23 Western, and only 8 Japanese). This was mainly due to the massive departure of foreigners after December 1941 and the restitution of foreign settlements in 1943. Despite a gradual growth (from 1 in 1919 to 8 during the war 1938-1943), Japanese agencies remained but a minority during the entire period. The figures are based on the Shanghai Municipal Archives and other secondary sources (Bankers' Directory, 1933; Hong List, 1941; Morgan, 2003). |
 | 346 | Length of articles published in the Chinese Economic Journal, per issue (all topics included) | Based on the following dataset, the attached graph visualizes the average, minimum and maximal length of authored articles (measured by the number of pages) in each issue of the Chinese Economic Monthly/Journal between 1924 and 1936, all topics included. Relying on R package "ggplot2", we alternatively used scattered plots (1), graph line (2) and smoothing (3) to visualize variations in the length of articles from one issue to the other, and between articles within the same issue. |
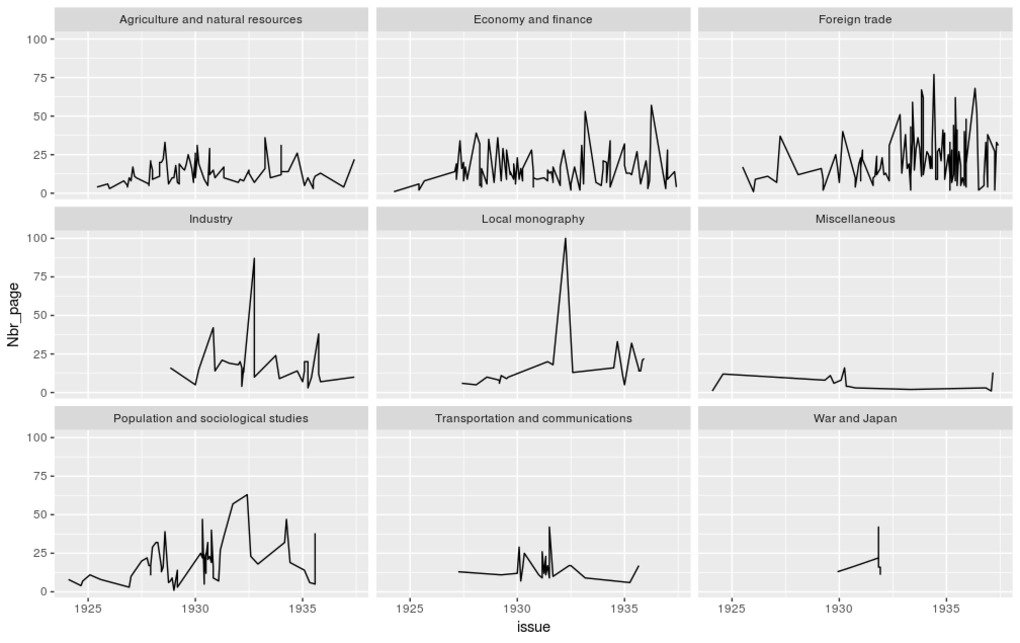 | 344 | Length of articles published in the Chinese Economic Journal, per issue and topic | Based on the following dataset, the attached graph visualizes the average, minimum and maximal length of authored articles (measured by the number of pages) in each issue of the Chinese Economic Monthly/Journal between 1924 and 1936, depending on the topic they address. Relying on R package "ggplot2", we alternatively used faceted graph line (1) and boxplots (2) to visualize variations in the length of articles from one topic to the other. The code used for classifying topics is described in the notice attached to the original dataset. |
 | 345 | Range of topics covered by the Chinese Economic Journal, per issue | Based on the following dataset, the attached graph visualizes the range of topics covered by each issue of the Chinese Economic Monthly/Journal between 1924 and 1936. We relied on R package "ggplot2" to build this graph. |
 | 361 | Contributors to the Chinese Economic Journal (country and city of occupation) | Based on the following dataset, the attached graphs aim to map the countries and cities in which the authors worked at the time they contributed to the Chinese Economic Monthly/Journal, all periods included (1, 2) and per period (3, 4). Relying on R package "ggplot2", we alternatively used bar charts and polar coordinates. |
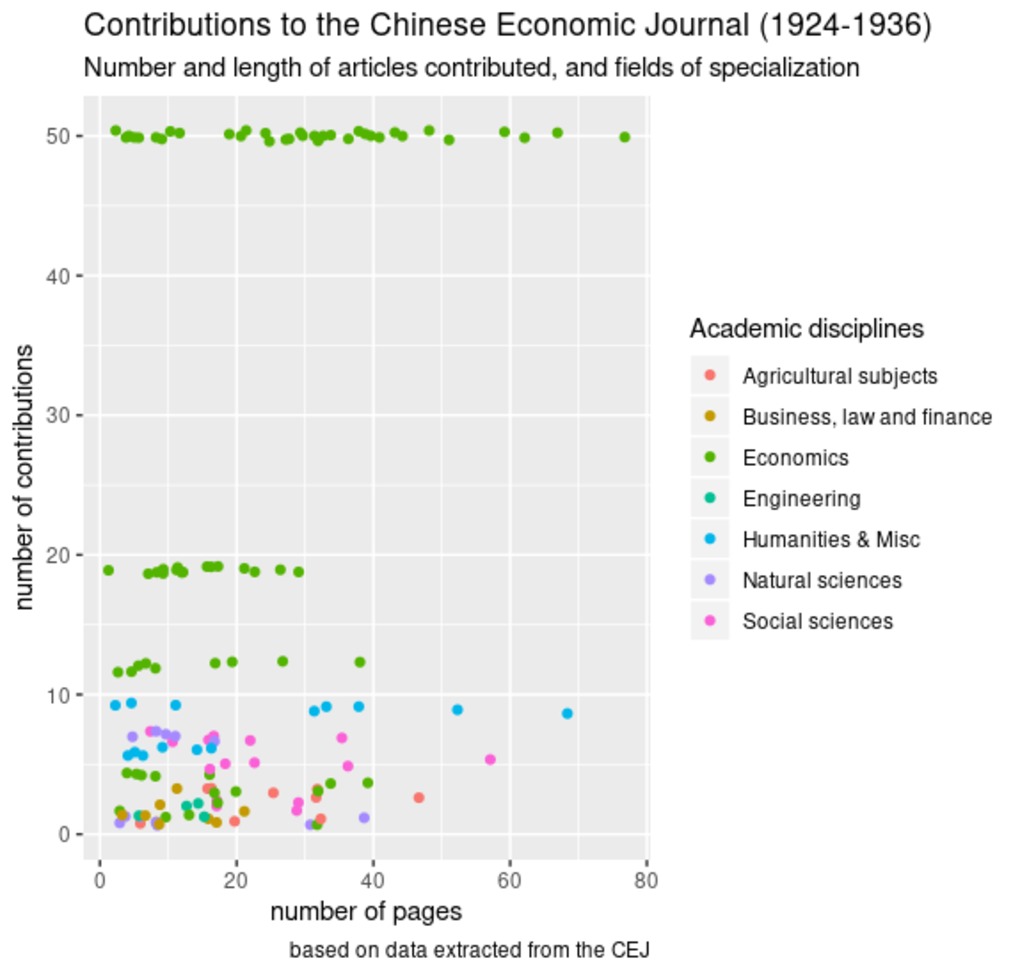 | 374 | Contributions to the Chinese Economic Journal (length of articles and contributors' fields of specialization) | Based on the following dataset, the attached graphs aim to test the potential influence of contributions' educational backbround (the academic disciplines in which they graduated) on the number of articles they contributed to the Chinese Economic Monthly/Journal, in relation to the length of articles (measured by the number of pages, visualized by the varying size of dots), all periods included (1) and per period (2). We relied on R package "ggplot2" to build the scattered plots. |
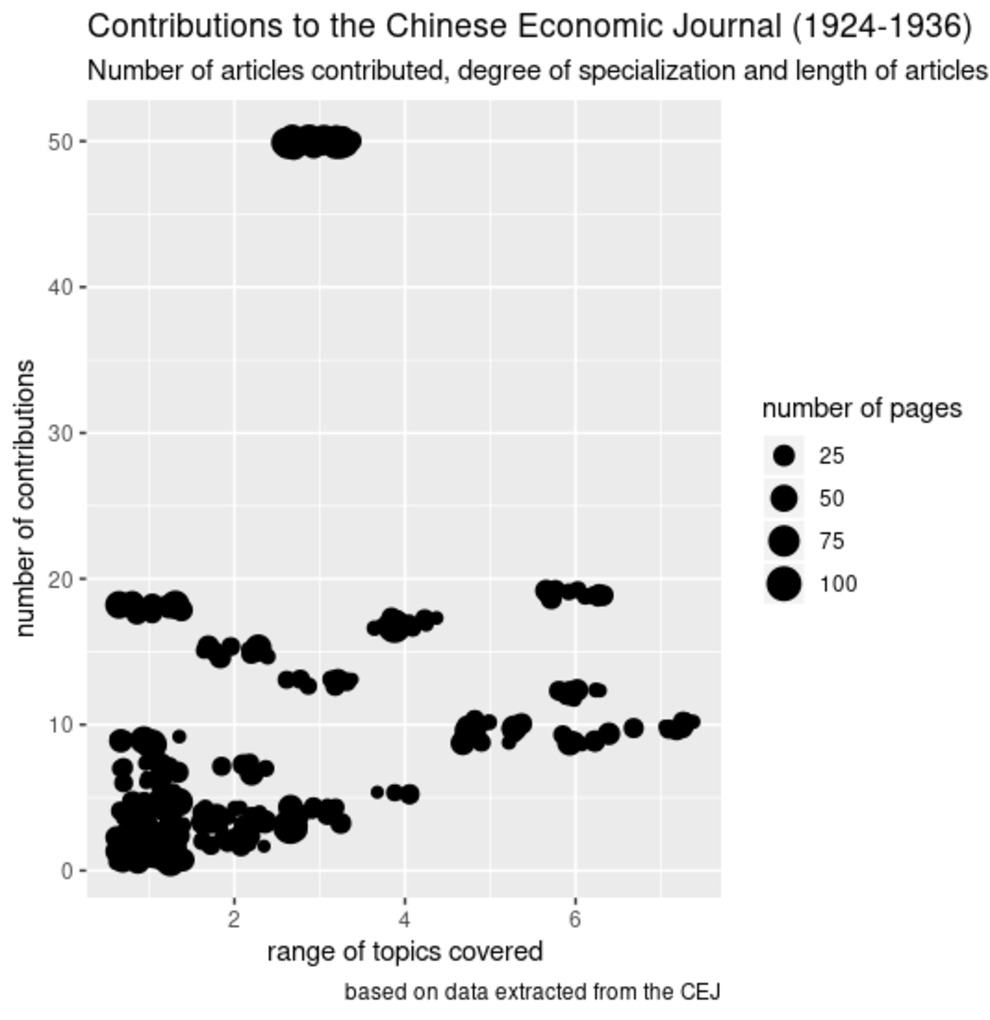
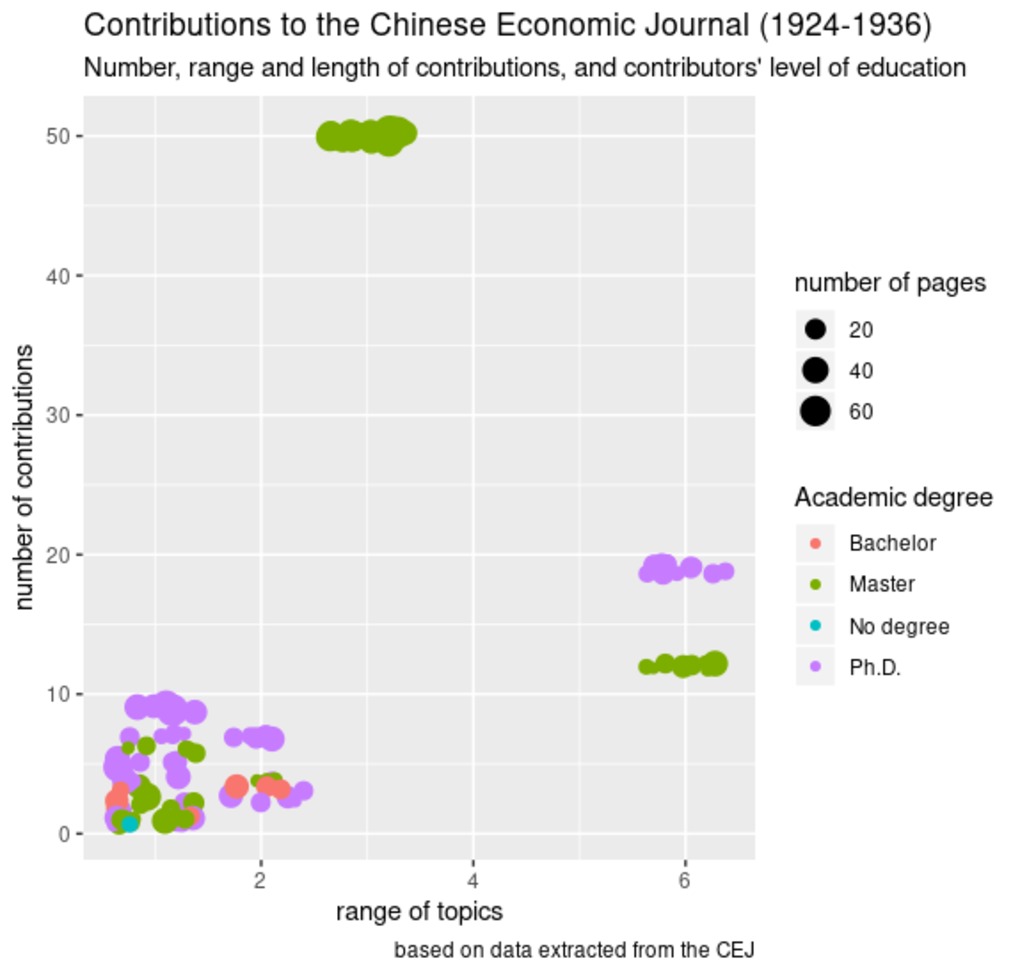 | 371 | Contributions to the Chinese Economic Journal (degree of specialization, length of articles and contributors' level of education) | Based on the following dataset, the attached graphs aim to test the potential influence of contributions' educational backbround (the highest academic degree they obtained) on the number of articles they contributed to the Chinese Economic Monthly/Journal, in relation to the length of articles (measured by the number of pages, visualized by the varying size of dots), and the range of topics they addressed (number of distinct topics, on a scale ranging from 1 to 7), all periods included (1) and per period (2). We relied on R package "ggplot2" to build the scattered plots. |
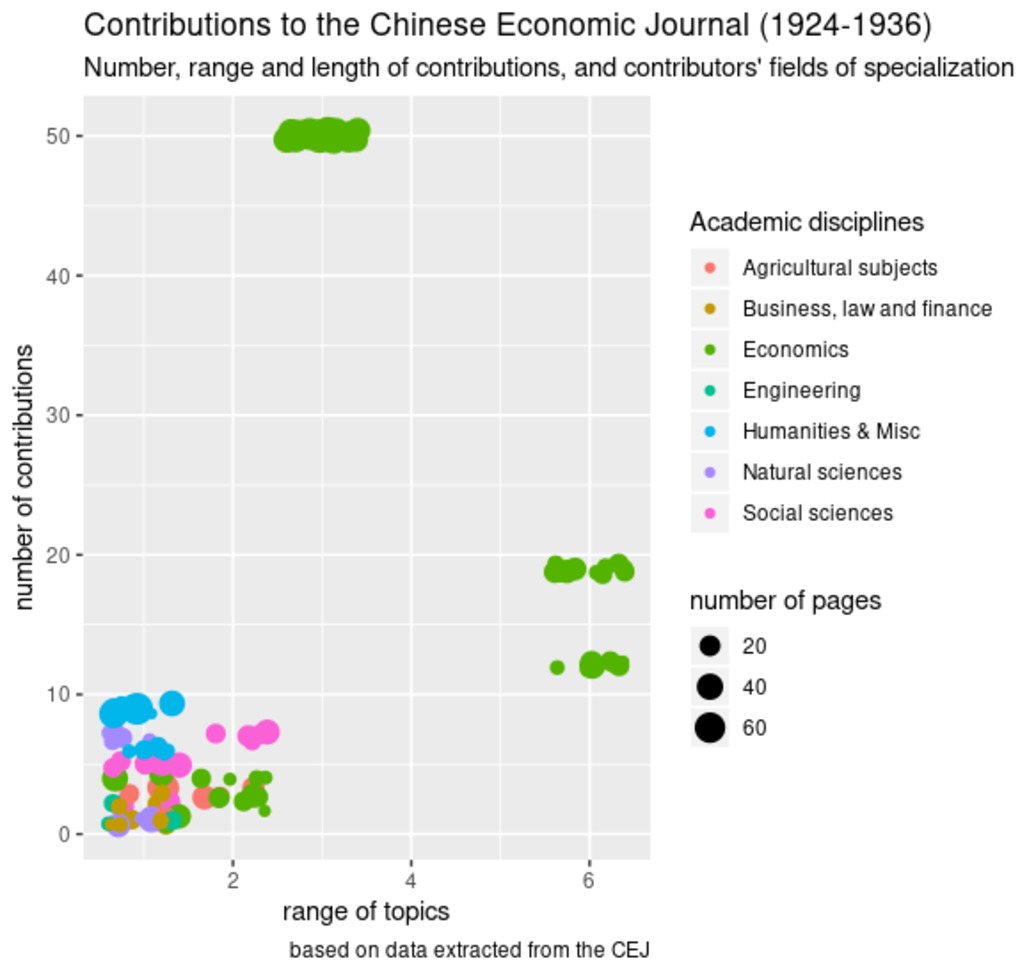
 | 365 | Contributions to the Chinese Economic Journal (degree and contributors' field of specialization) | Based on the following dataset, the attached graphs aim to test the potential influence of contributions' educational background (the academic disipline in which they graduated) on the number of articles they contributed to the Chinese Economic Monthly/Journal, in relation to the range of topics they addressed (number of distinct topics, on a scale ranging from 1 to 7), all periods included (1) and per period (2). We relied on R package "ggplot2" to build the scattered plots. |
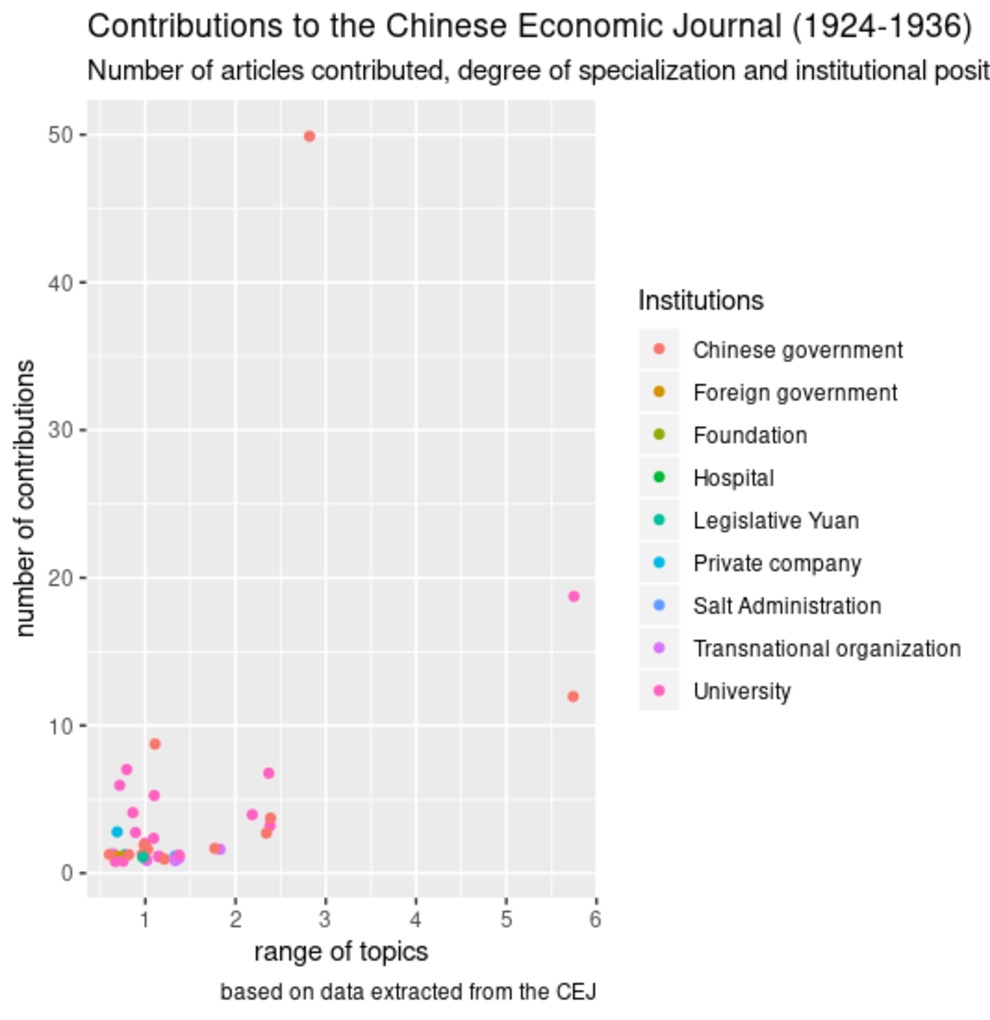 | 367 | Contributions to the Chinese Economic Journal (degree of specialization and contributors' institutional position) | Based on the following dataset, the attached graphs aim to test the potential influence of contributions' institutional position (sector of activity) on the number of articles they contributed to the Chinese Economic Monthly/Journal, in relation to the range of topics they addressed (number of distinct topics, on a scale ranging from 1 to 7), all periods included (1) and per period (2). We relied on R package "ggplot2" to build the scattered plots. |
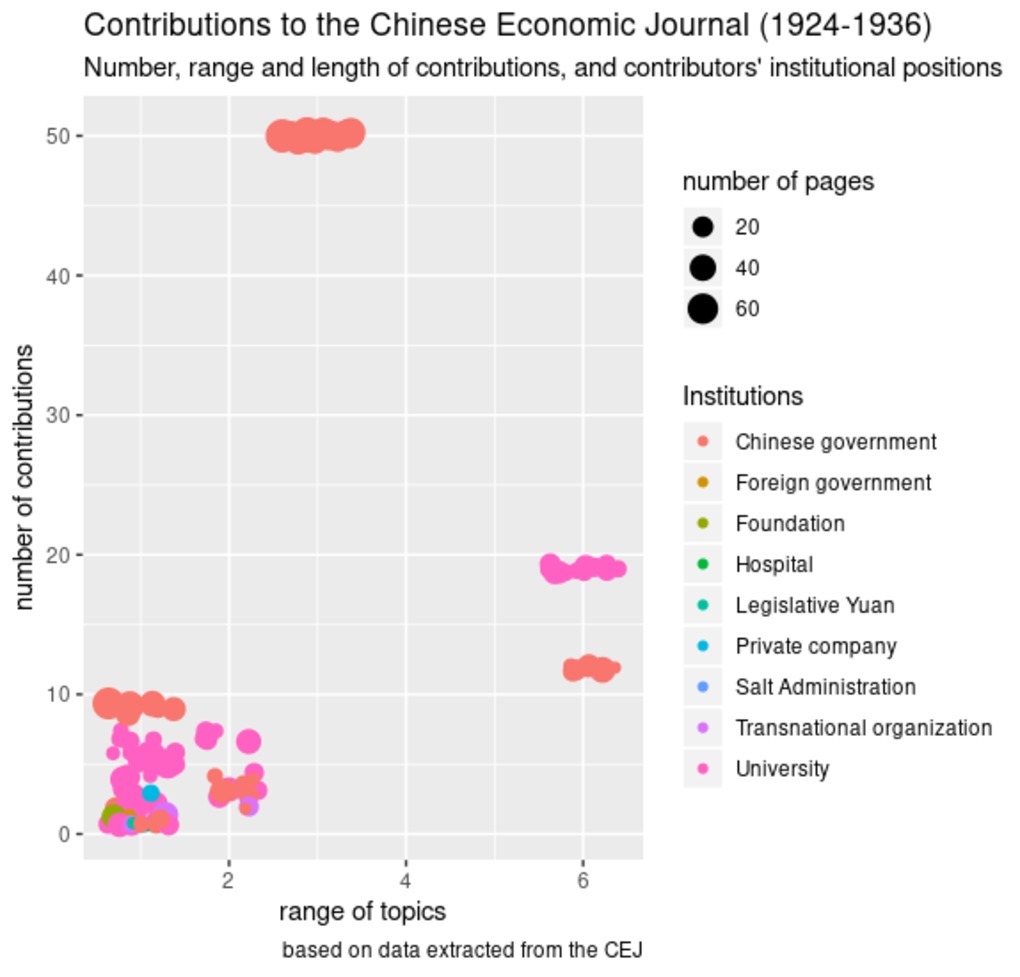 | 372 | Contributions to the Chinese Economic Journal (degree of specialization, length of articles and contributors' institutional position) | Based on the following dataset, the attached graphs aim to test the potential influence of contributions' institutional positions (sector of activity) on the number of articles they contributed to the Chinese Economic Monthly/Journal, in relation to the length of articles (measured by the number of pages, visualized by the varying size of dots), and the range of topics they addressed (number of distinct topics, on a scale ranging from 1 to 7), all periods included (1) and per period (2). We relied on R package "ggplot2" to build the scattered plots. |
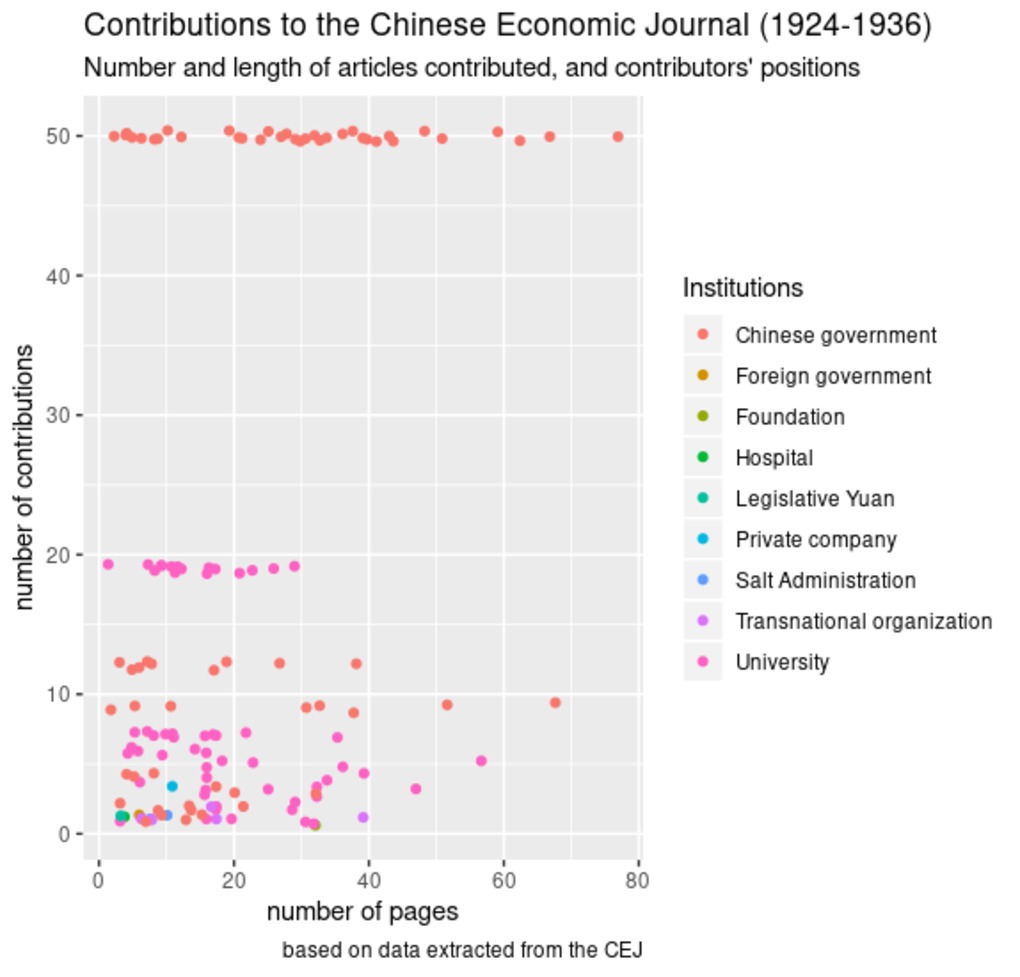 | 376 | Contributions to the Chinese Economic Journal (length of articles and contributors' institutional position) | Based on the following dataset, the attached graphs aim to test the potential influence of contributions' institutional positions (sector of activity) on the number of articles they contributed to the Chinese Economic Monthly/Journal, in relation to the length of articles (measured by the number of pages, visualized by the varying size of dots), all periods included (1) and per period (2). We relied on R package "ggplot2" to build the scattered plots. |
 | 364 | Contributions to the Chinese Economic Journal (degree of specialization and contributors' nationality) | Based on the following dataset, the attached graphs aim to test the potential influence of contributions' nationality on the number of articles they contributed to the Chinese Economic Monthly/Journal, in relation to the range of topics they addressed (number of distinct topics, on a scale ranging from 1 to 7), all periods included (1) and per period (2). We relied on R package "ggplot2" to build the scattered plots. |
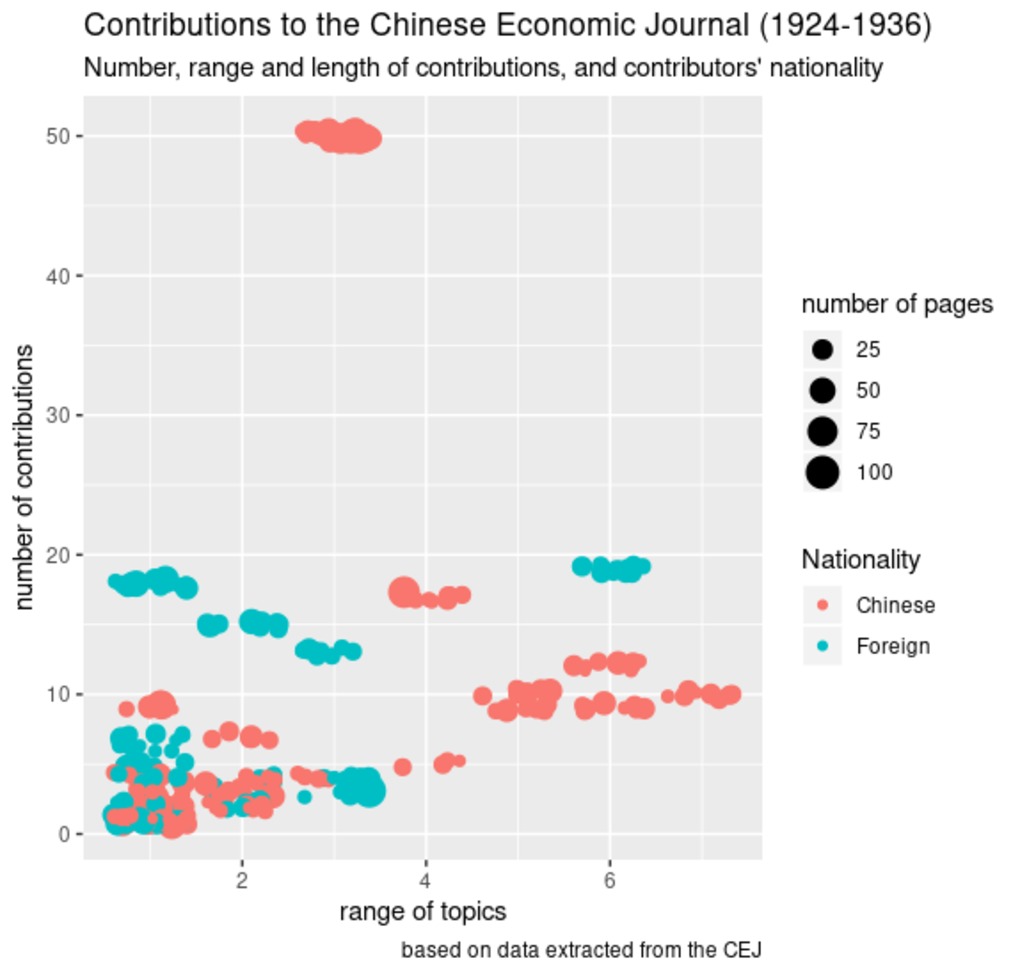 | 368 | Contributions to the Chinese Economic Journal (degree of specialization, length of articles and contributors' nationality) | Based on the following dataset, the attached graphs aim to test the potential influence of contributions' nationality on the number of articles they contributed to the Chinese Economic Monthly/Journal, in relation to the range of topics they addressed (number of distinct topics, on a scale ranging from 1 to 7) and the length of articles they contributed (measured by the number of pages), all periods included (1) and per period (2). We relied on R package "ggplot2" to build the scattered plots. |
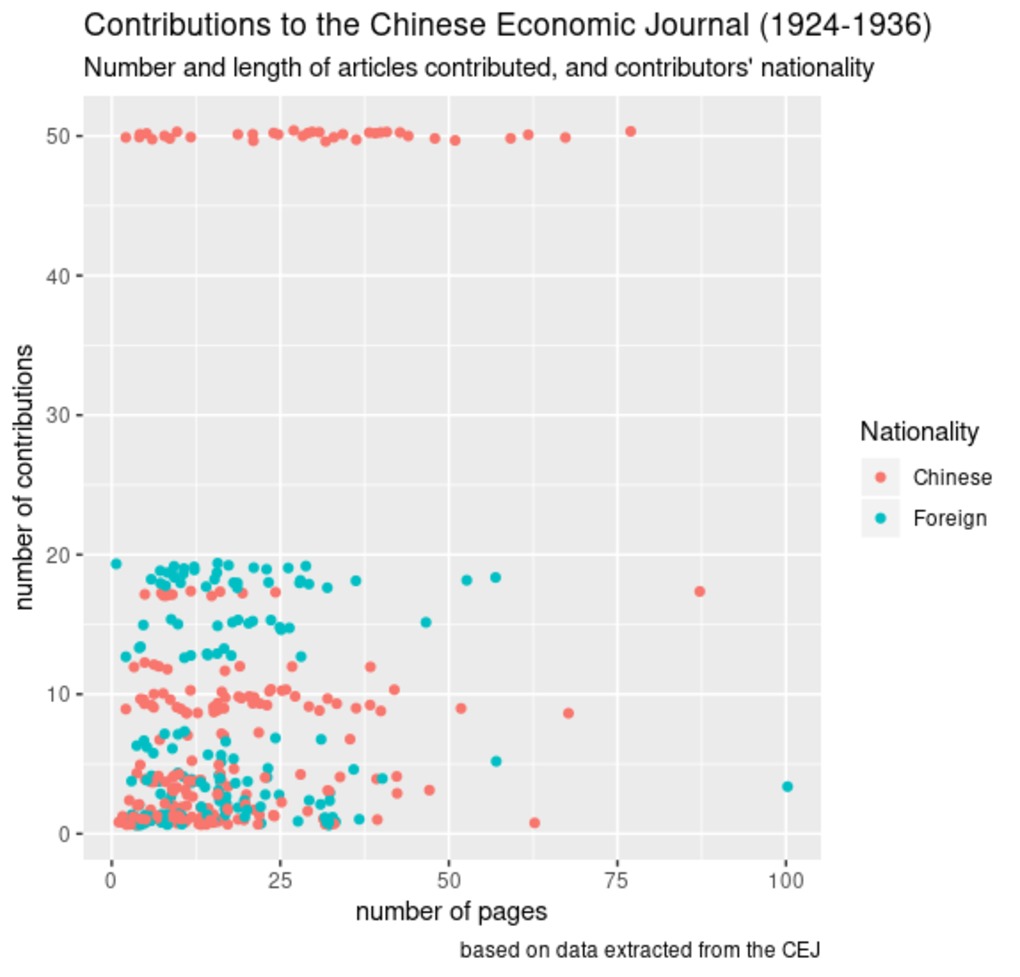 | 373 | Contributions to the Chinese Economic Journal (length of articles and contributors' nationality) | Based on the following dataset, the attached graphs aim to test the potential influence of contributions' nationality on the number of articles they contributed to the Chinese Economic Monthly/Journal, in relation to the length of articles (measured by the number of pages), all periods included (1) and per period (2). We relied on R package "ggplot2" to build the scattered plots. |
 | 370 | Contributions to the Chinese Economic Journal (degree of specialization, length of articles and contributors' fields of specialization) | Based on the following dataset, the attached graphs aim to test the potential influence of contributions' educational backbround (the academic disciplines in which they graduated) on the number of articles they contributed to the Chinese Economic Monthly/Journal, in relation to the length of articles (measured by the number of pages, visualized by the varying size of dots), and the range of topics they addressed (number of distinct topics, on a scale ranging from 1 to 7), all periods included (1) and per period (2). We relied on R package "ggplot2" to build the scattered plots. |
 | 375 | Contributions to the Chinese Economic Journal (length of articles and contributors' level of education) | Based on the following dataset, the attached graphs aim to test the potential influence of contributions' educational backbround (the highest academic degree they obtained) on the number of articles they contributed to the Chinese Economic Monthly/Journal, in relation to the length of articles (measured by the number of pages, visualized by the varying size of dots), all periods included (1) and per period (2). We relied on R package "ggplot2" to build the scattered plots. |
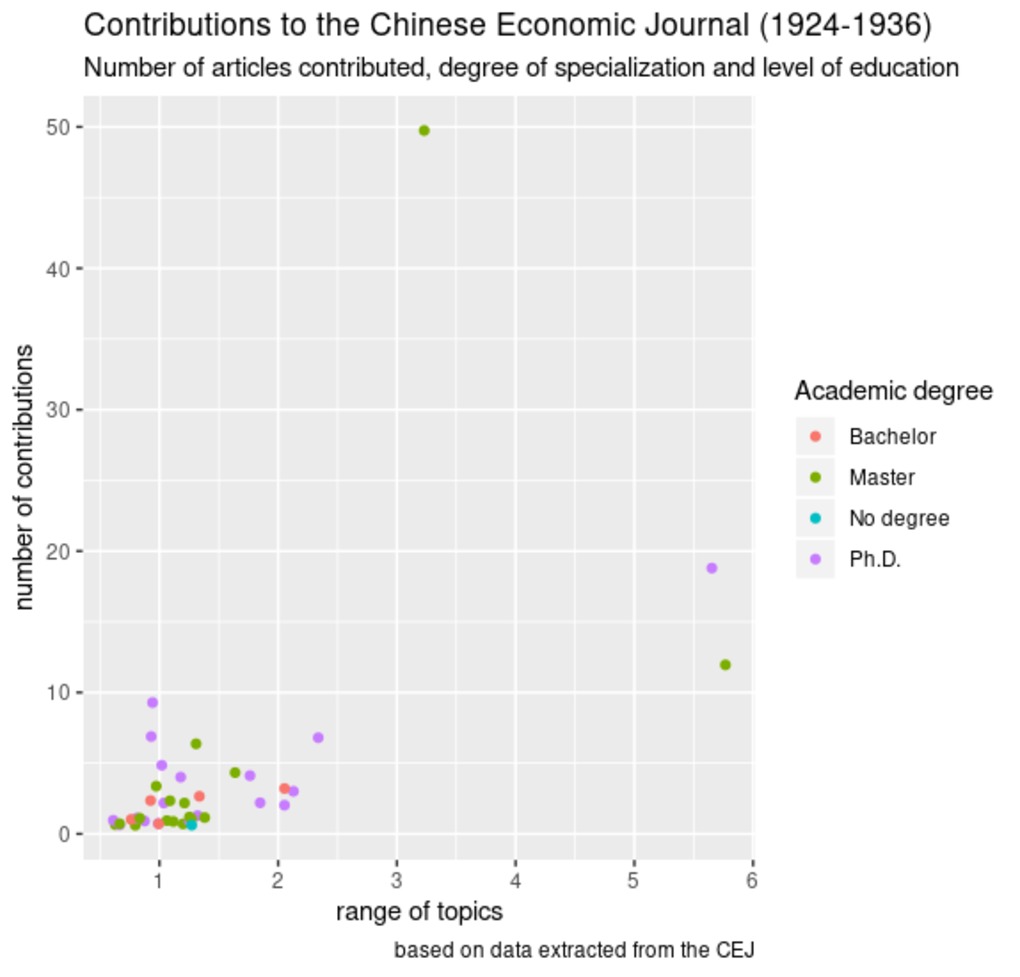 | 366 | Contributions to the Chinese Economic Journal (degree of specialization and contributors' level of education) | Based on the following dataset, the attached graphs aim to test the potential influence of contributions' educational background (the highest academic degree they obtained) on the number of articles they contributed to the Chinese Economic Monthly/Journal, in relation to the range of topics they addressed (number of distinct topics, on a scale ranging from 1 to 7), all periods included (1) and per period (2). We relied on R package "ggplot2" to build the scattered plots. |
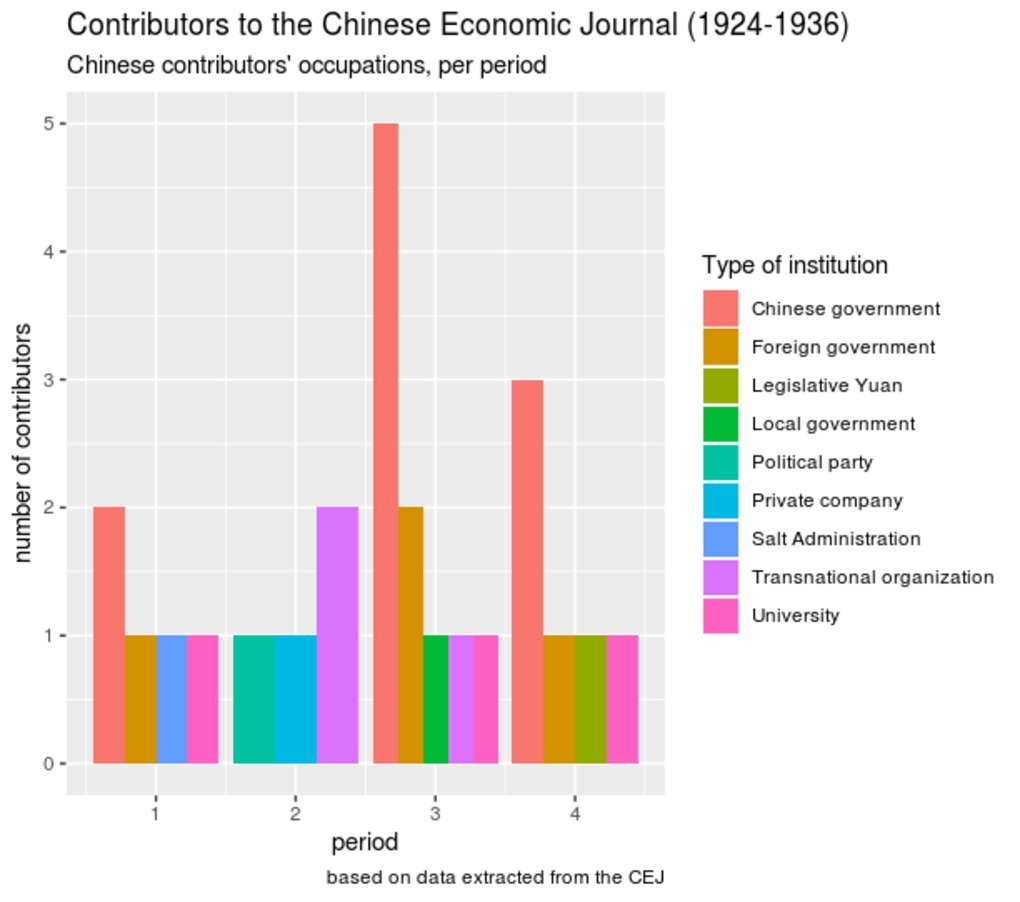 | 360 | Contributors to the Chinese Economic Journal (institutional positions) | Based on the following dataset, the attached graphs explore authors' institutional positions at the time they contributed to the Chinese Economic Monthly/Journal, per period (1, 2, 3) and sector of activity (4, 5). Relying on R package "ggplot2", we alternatively used faceted, stacked and dodged bar charts. The last set of graphs (6) provides a more detailed analysis of institutions, arranged by sector of activity and period. |
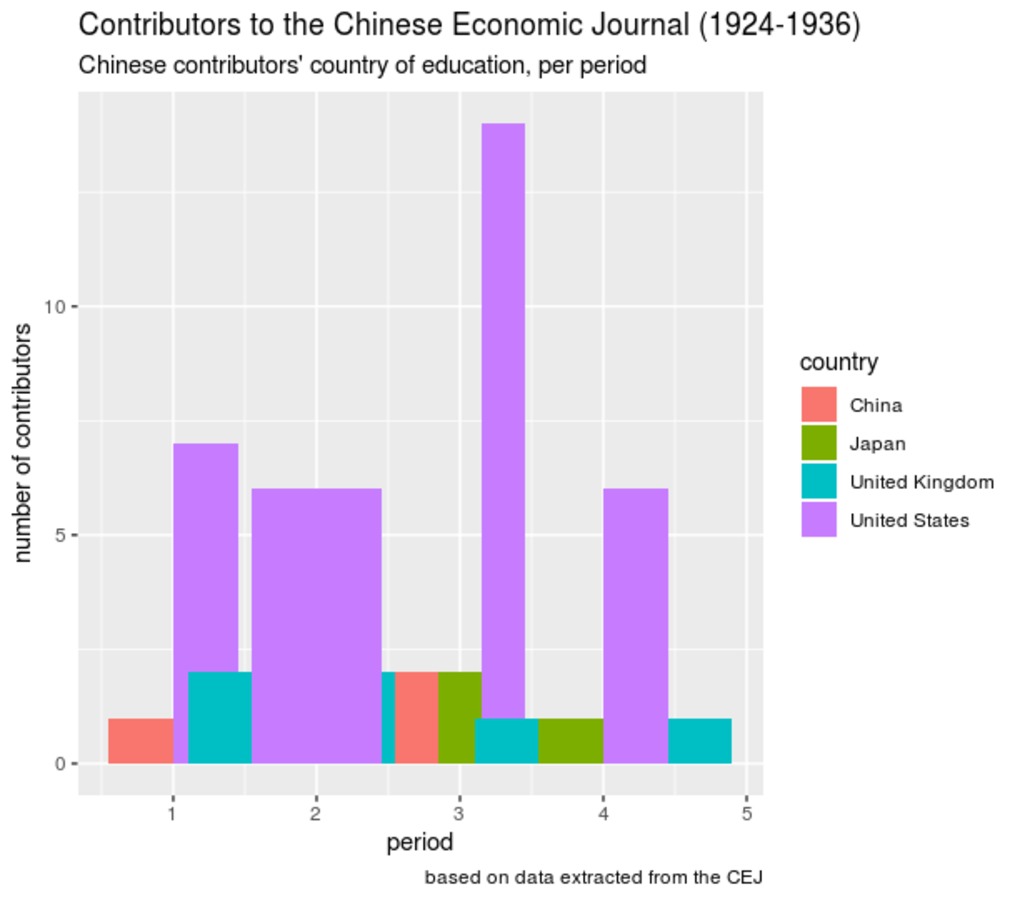 | 357 | Chinese contributors to the Chinese Economic Journal, per period (country of education) | Based on the following dataset, the attached graphs explore Chinese contributors' country of education (the country in which they received their highest degree) in the Chinese Economic Monthly/Journal between 1924 and 1936, per period. Relying on R package "ggplot2", we alternatively used faceted and dodged bar charts. |
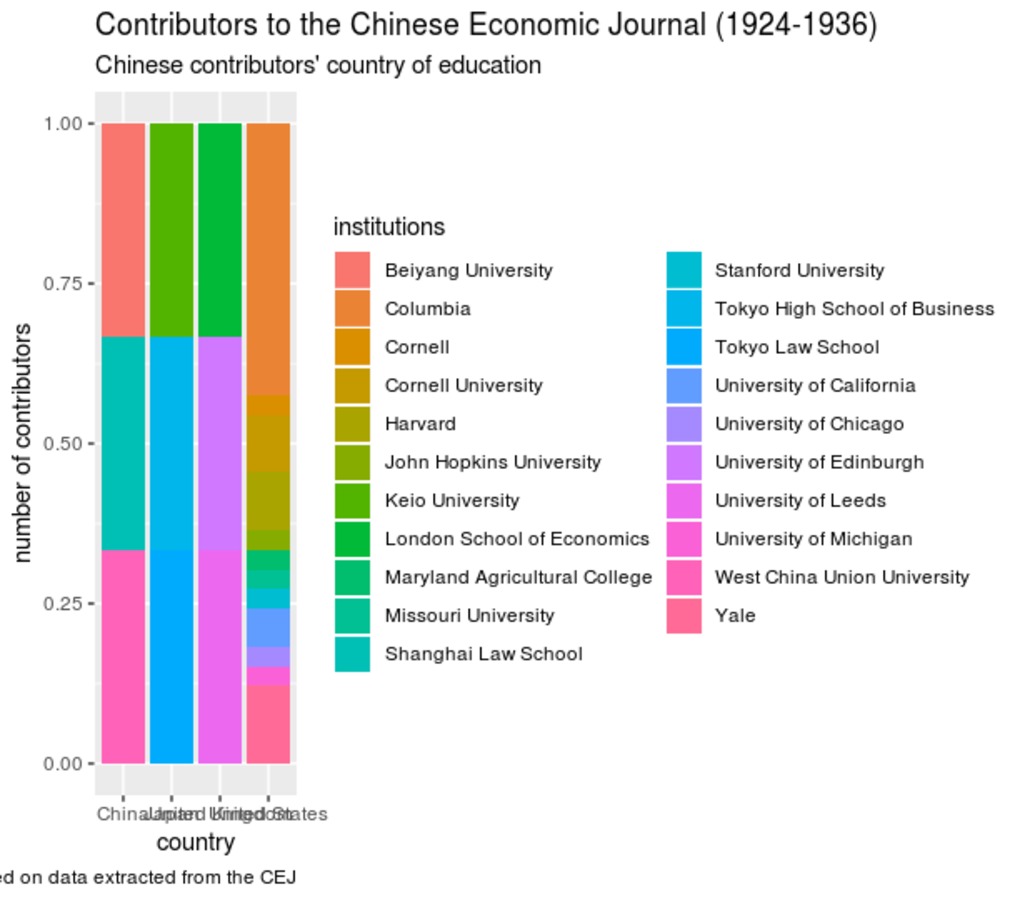 | 359 | Chinese contributors to the Chinese Economic Journal (educational institutions) | Based on the following dataset, the attached graphs explore Chinese contributors' educational institutions (the university in which they received their highest degree) in the Chinese Economic Monthly/Journal between 1924 and 1936, all periods included (1) and per period (2, 3). We relied on R package "ggplot2" to build these bar charts. |
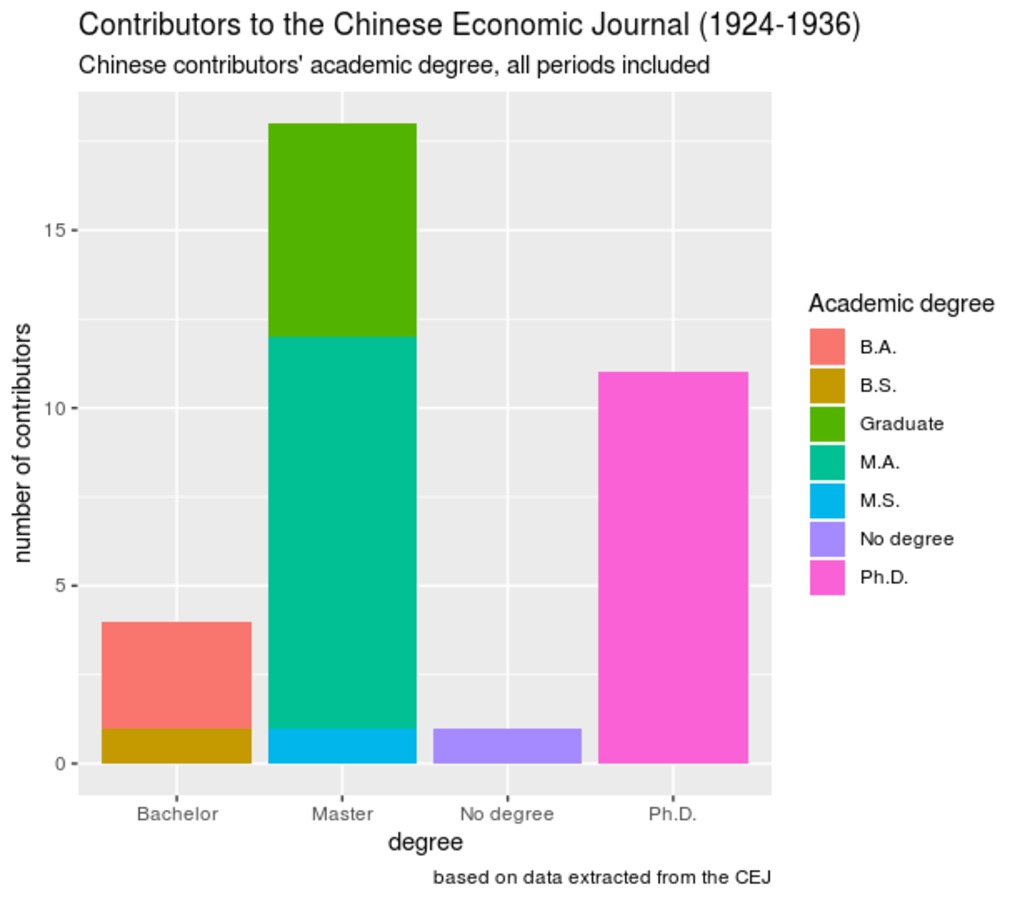 | 355 | Chinese contributors to the Chinese Economic Journal, per period (level of education) | Based on the following dataset, the attached graphs explore Chinese contributors' level of education (the highest academic degrees obtained) in the Chinese Economic Monthly/Journal between 1924 and 1936, all periods included (1), and per period (2, 3, 4). Relying on R package "ggplot2", we alternatively used stacked and dodged bar charts. |
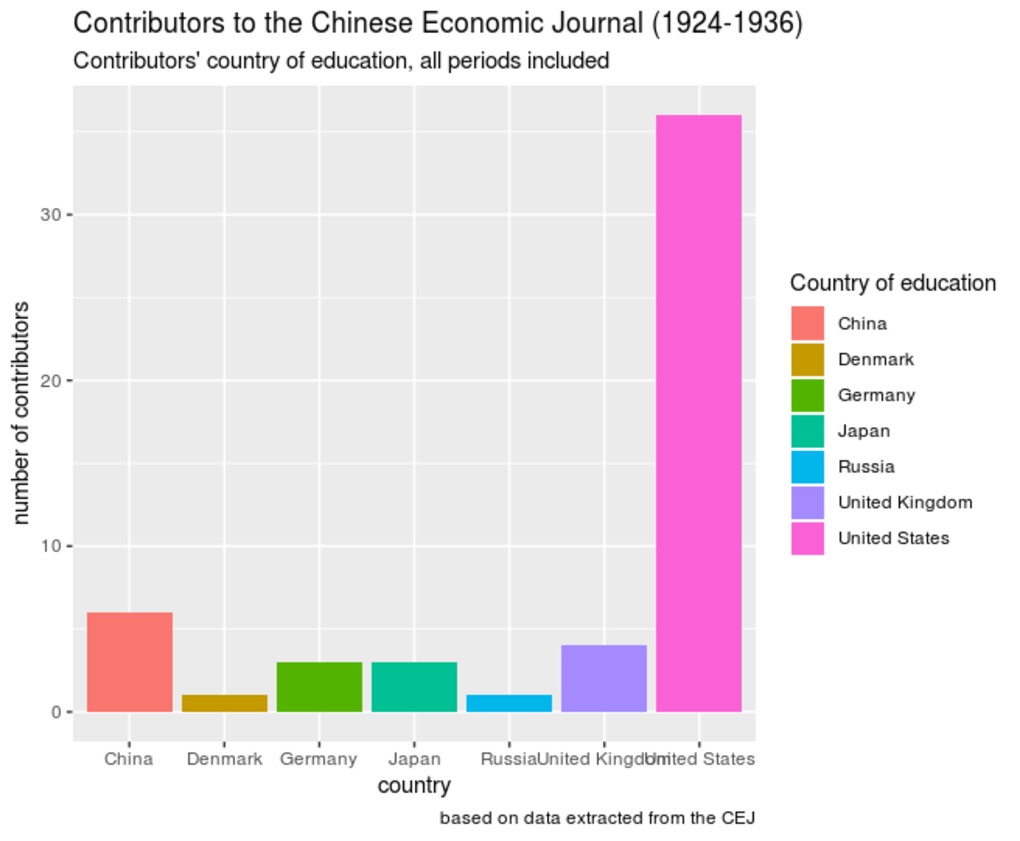 | 356 | Contributors to the Chinese Economic Journal, per period (country of education) | Based on the following dataset, the attached graphs explore contributors' country of education (in country in which they received their highest degree) in the Chinese Economic Monthly/Journal between 1924 and 1936, all periods included (1), and per period (2). We relied on R package "ggplot2" to build these bar charts. These graphs reveals the heavy weight of the United States as the privileged destination for pursuing higher education. |
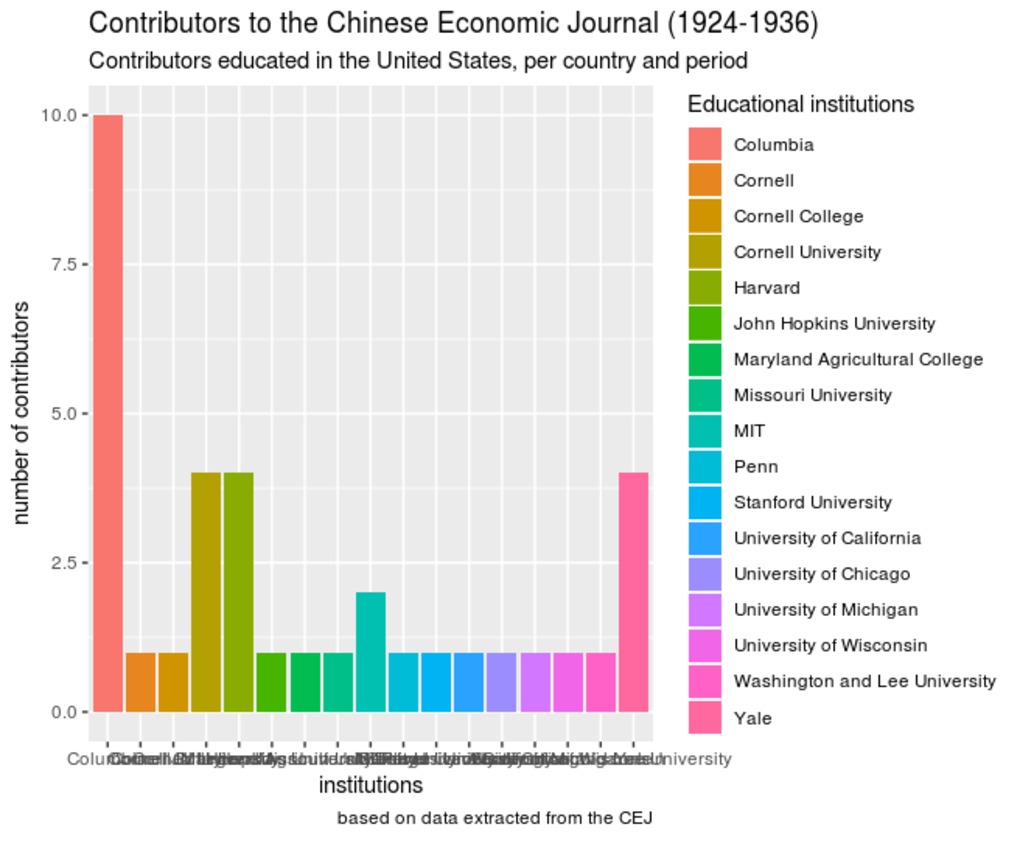 | 358 | Contributors to the Chinese Economic Journal, per period (educational institutions) | Based on the following dataset, the attached graphs explore contributors' educational institutions (the university in which they received their highest degree) in the Chinese Economic Monthly/Journal between 1924 and 1936, with a particular focus on the United States (1) and China (2). We relied on R package "ggplot2" to build these bar charts. |
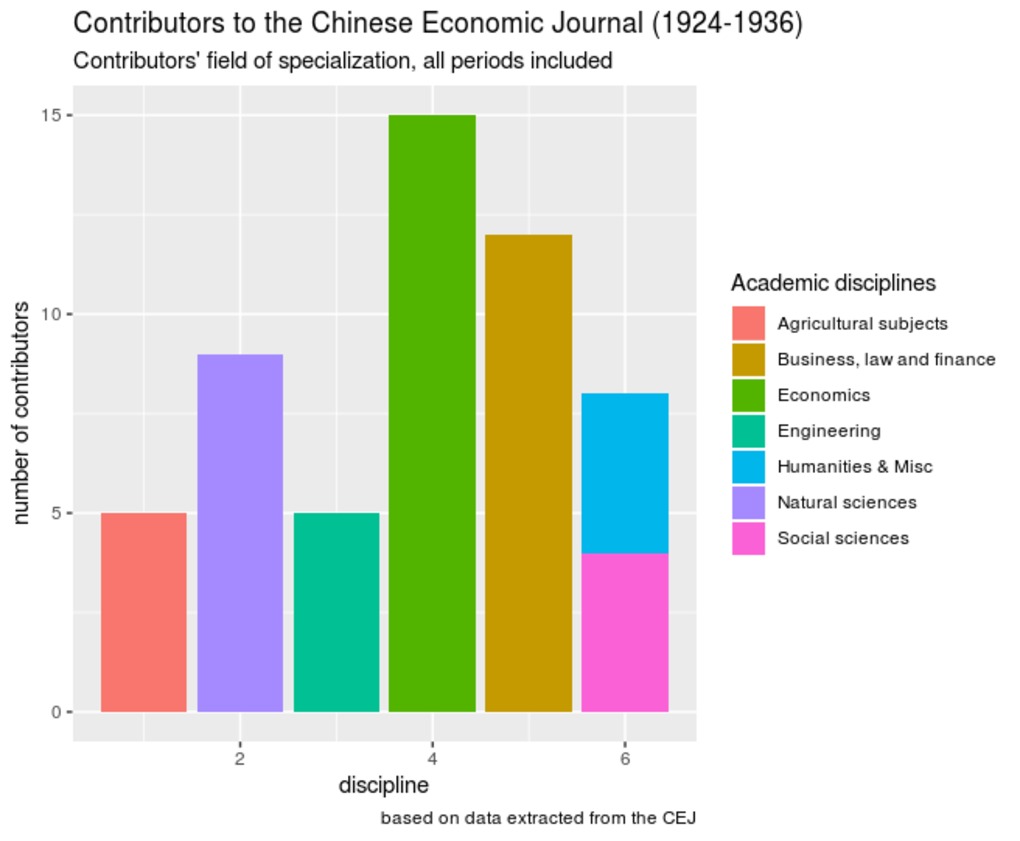 | 351 | Contributors to the Chinese Economic Journal, per period (field of specialization) | Based on the following dataset, the attached graphs explore contributors' fields of specialization (the academic disciplines in which they graduated) in the Chinese Economic Monthly/Journal between 1924 and 1936, all periods included (1), and per period (2, 3). Relying on R package "ggplot2", we alternatively used faceted and stacked bar charts. |
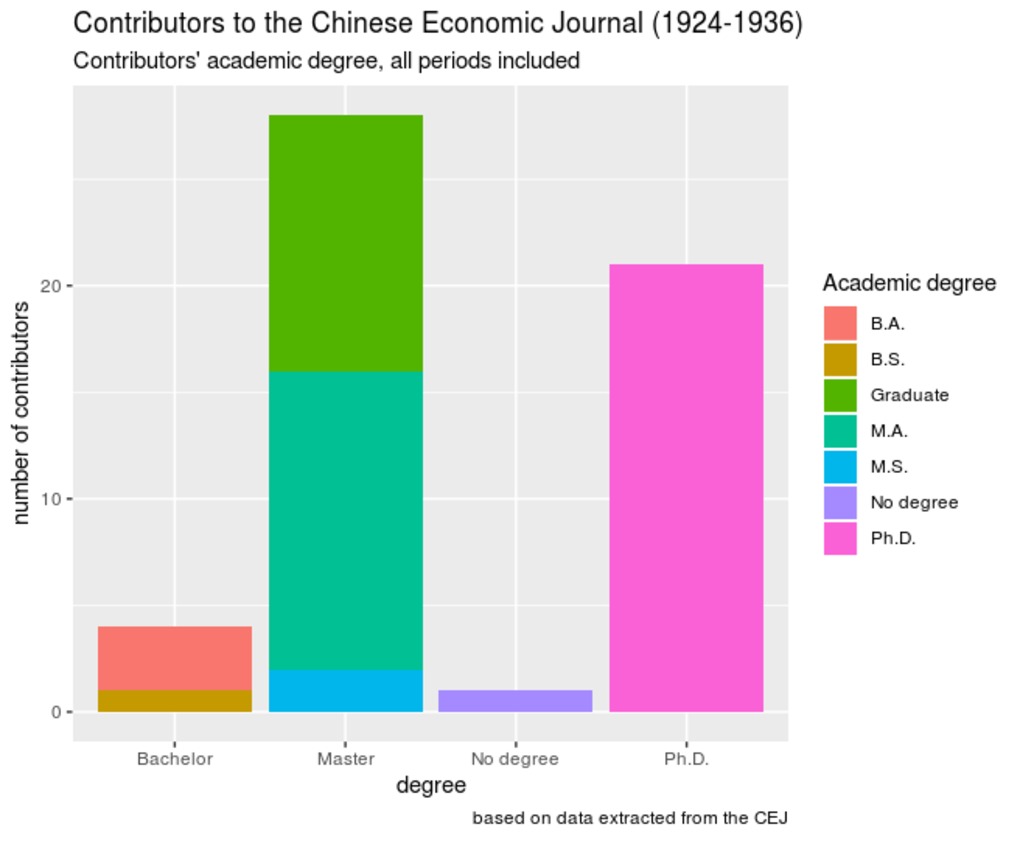 | 354 | Contributors to the Chinese Economic Journal, per period (level of education) | Based on the following dataset, the attached graphs explore contributors' level of education (the highest academic degrees obtained) in the Chinese Economic Monthly/Journal between 1924 and 1936, all periods included (1), and per period (2, 3, 4). Relying on R package "ggplot2", we alternatively used faceted, stacked and dodged bar charts. |
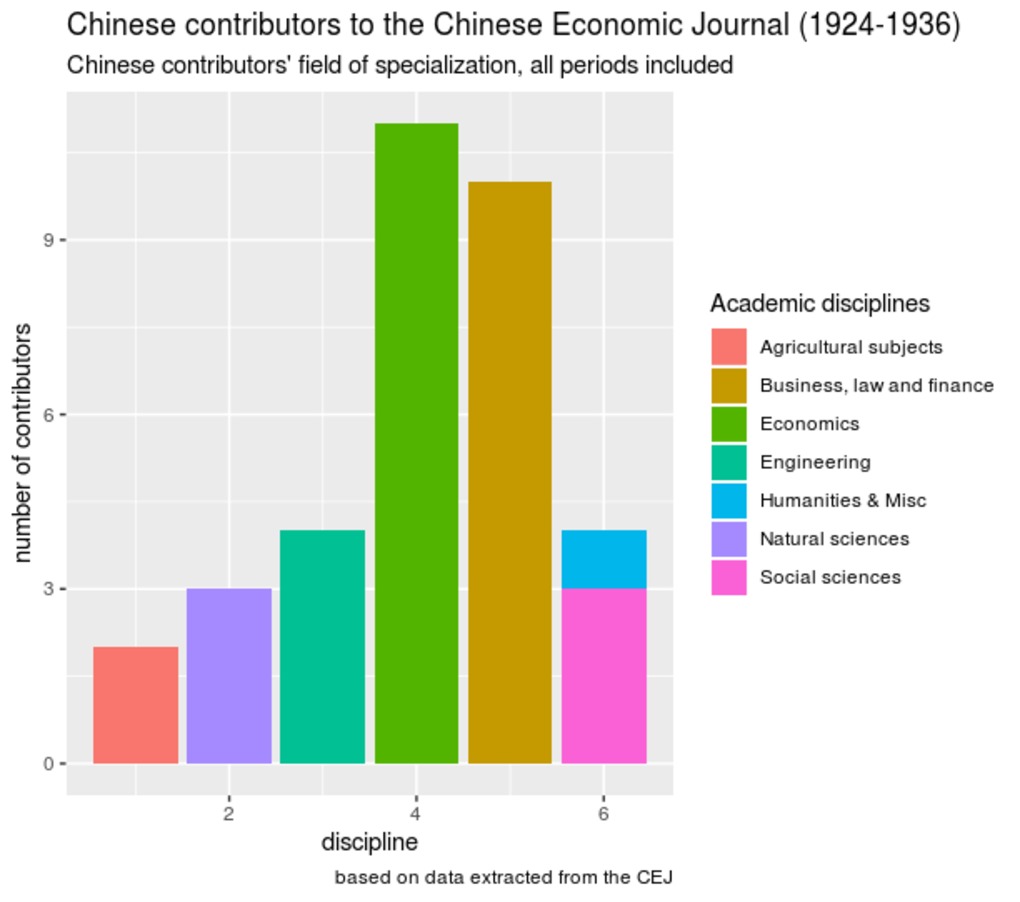 | 353 | Chinese contributors to the Chinese Economic Journal, per period (field of specialization) | Based on the following dataset, the attached graphs explore more specificially Chinese contributors' fields of specialization (the academic disciplines in which they graduated) in the Chinese Economic Monthly/Journal between 1924 and 1936, all periods included (1), and per period (2, 3, 4). Relying on R package "ggplot2", we alternatively used stacked, dodged and faceted bar charts. |
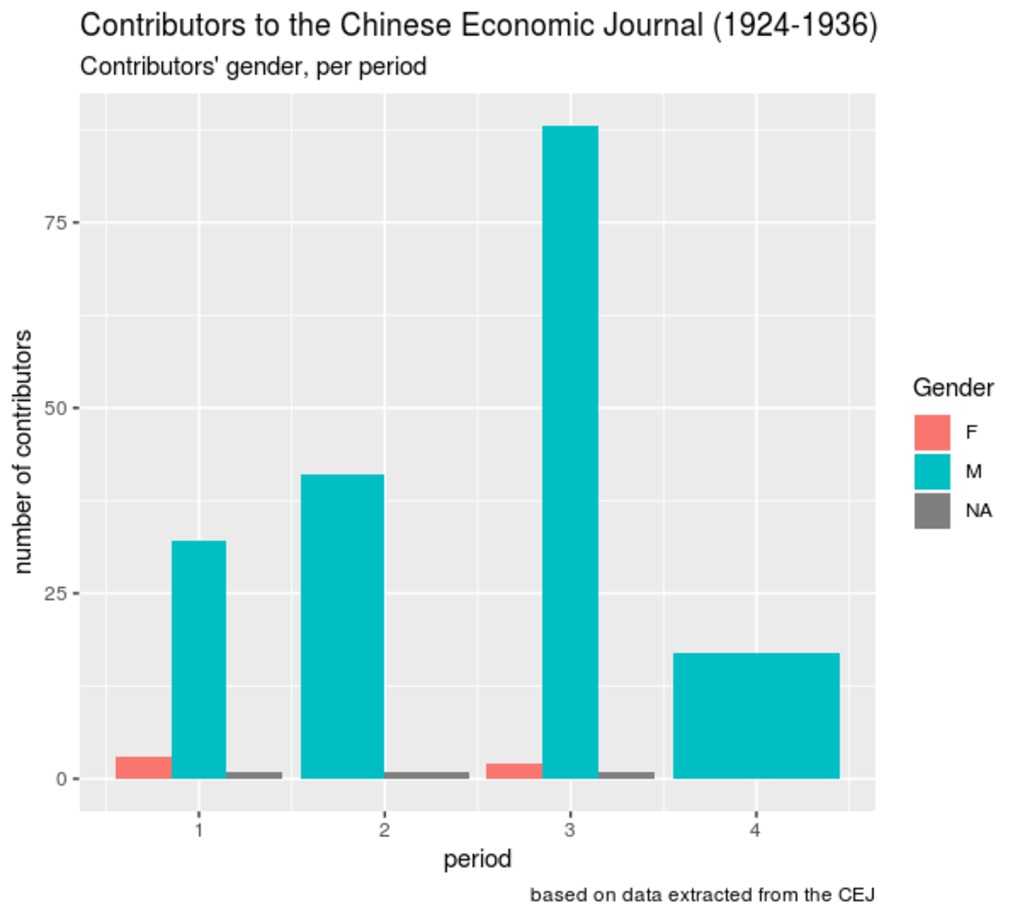 | 350 | Contributors to the Chinese Economic Journal, per period (gender) | Based on the following dataset, the attached graphs explore the gendered distribution of contributors to the Chinese Economic Monthly/Journal between 1924 and 1936, per period (1) and all periods included (2). We relied on R package "ggplot2" to build these bar charts. Unsurprisingly, male contributors dominated during the entire period. Woman made but a small contribution during the first and third periods. |
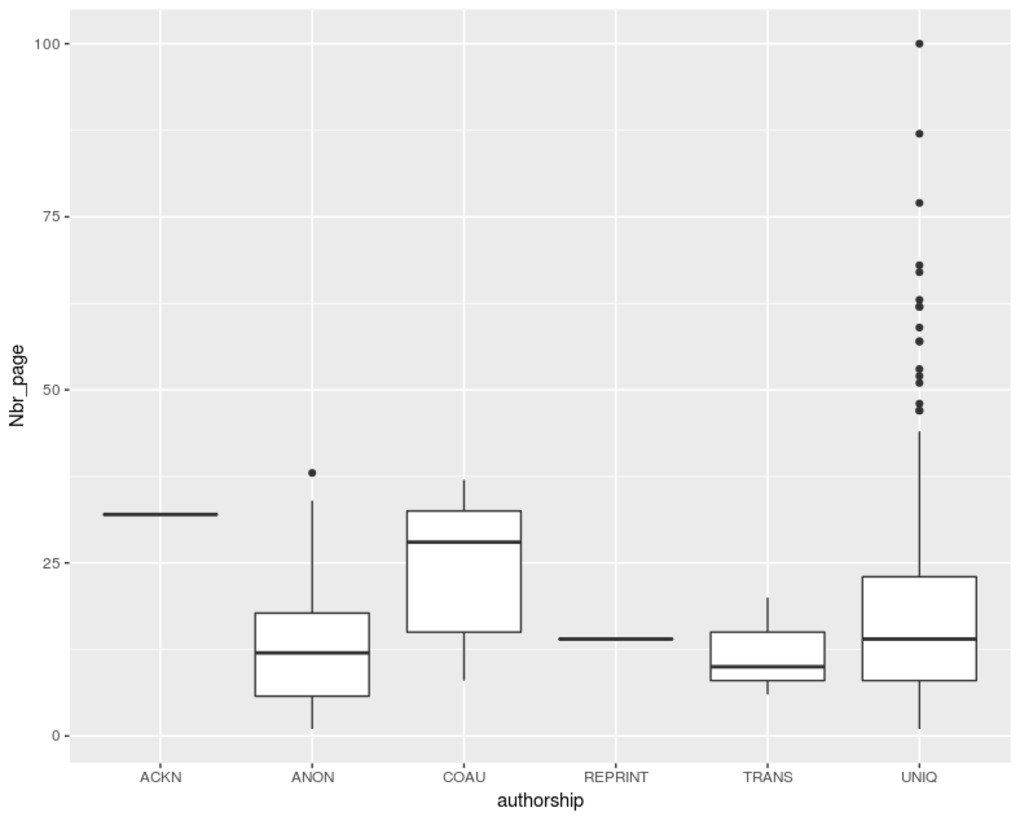 | 347 | Authorship in the Chinese Economic Journal | Based on the following dataset, the attached graphs explore the nature of authorship the Chinese Economic Monthly/Journal between 1924 and 1936, in relation to the the length of articles (1) and to the topics they addressed (2, 3). Relying on R package "ggplot2", we alternatively used boxplots (1, 2) and bar charts (3). The codes used for classifying topics and authorship are described in the notice attached to the original dataset. |
 | 369 | Contributions to the Chinese Economic Journal (degree of specialization and length of articles) | Based on the following dataset, the attached graphs visualize the number of articles that individual authors contributed to the Chinese Economic Monthly/Journal, in relation to the range of topics they addressed (number of distinct topics, on a scale ranging from 1 to 7) and the length of articles they contributed (measured by the number of pages, visualized by the varying size of dots), all periods included (1) and per period (2). We relied on R package "ggplot2" to build the scattered plots. |
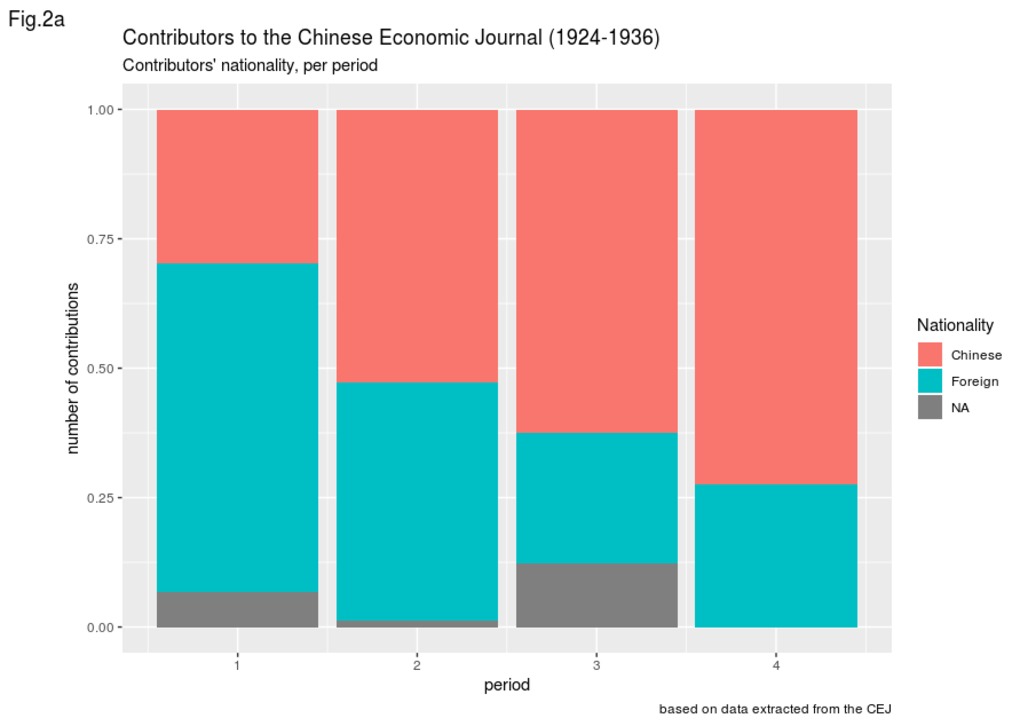 | 348 | Contributors to the Chinese Economic Journal, per period (origin) | Based on the following dataset, the attached graphs visualize the origin of contributors to the Chinese Economic Monthly/Journal between 1924 and 1936, per period. Relying on R package "ggplot2", we alternatively used faceted and stacked bar charts. What is striking on these graphs is the meteoritic rise of Chinese contributors from 1928 onwards. The next set of graphs will explore the contributors' nationality in greater details. |
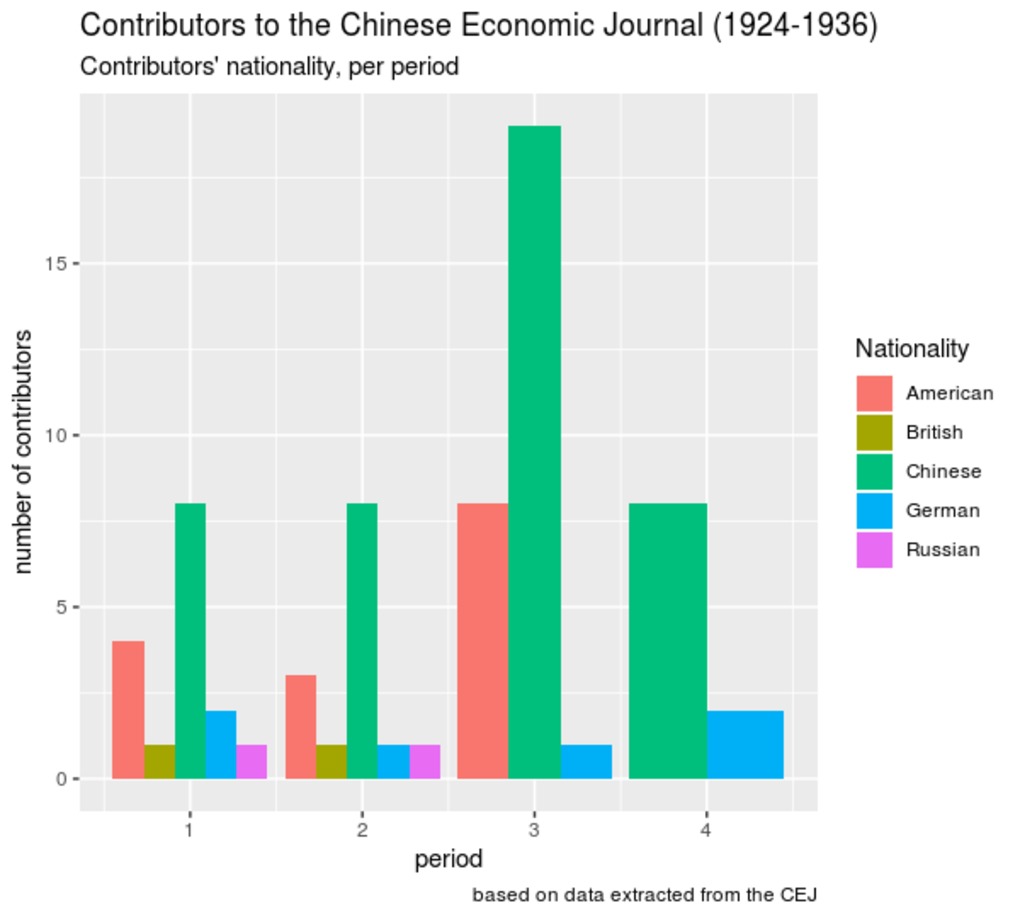 | 349 | Contributors to the Chinese Economic Journal, per period (nationality) | Based on the following dataset, the attached graphs visualize the nationality of contributors to the Chinese Economic Monthly/Journal between 1924 and 1936, all periods included (2) and per period (1, 3). Compared to the related graphs that merely discriminate between Chinese and foreign contributors, this set explores the distribution of national groups in greater details. Relying on R package "ggplot2", we alternatively used faceted and stacked bar charts. |
 | 362 | Contributions to the Chinese Economic Journal (importance and duration) | Based on the following dataset, the attached graphs visualize the number of articles that individual authors contributed to the Chinese Economic Monthly/Journal, in relation to the duration of their contribution (number of years). We relied on R package "ggplot2" to build the scattered plots. In addition, we test multiple factors that may potentially account for their varying contribution to the journal: nationality (2), field of specialization (3), level of education (4), and institutional position (5). |
 | 363 | Contributions to the Chinese Economic Journal (contributors' degree of specialization) | Based on the following dataset, the attached graphs visualize the number of articles that individual authors contributed to the Chinese Economic Monthly/Journal, in relation to the range of topics they addressed (number of distinct topics, on a scale ranging from 1 to 7), all periods included (1) and per period (2). We relied on R package "ggplot2" to build the scattered plots. |
 | 342 | Number of articles published in the Chinese Economic Journal, per issue | Based on the following dataset, the attached graphs visualize the number of articles published in the Chinese Economic Monthly/Journal between 1924 and 1936. Relying on R package "ggplot2", we propose two main types of visualization - graph lines and bar charts - to explore variations in the number of articles and topics per issue. The code used for classifying topics is described in the notice attached to the original dataset. |
 | 343 | Number of articles published in the Chinese Economic Journal, per period | Based on the following dataset, the attached graphs visualize the number of articles published in the Chinese Economic Monthly/Journal between 1924 and 1936. Relying on R package "ggplot2", we used faceted, colored and stacked bar charts to explore variations in the number of articles and topics per period. The codes used for classifying topics and for periodizing the history of the journal are described in the notice attached to the original dataset. |
 | 381 | Time series of attendance percentage at the Shanghai Rotary Club | Based on the following dataset, the attached time series trace the evolution of attendance percentage at the Rotary Club of Shanghai over the period May 1920-September 1935 (inclusive).
NB Since the attendance time series cannot be described as an additive model, it was not possible to decompose it. |
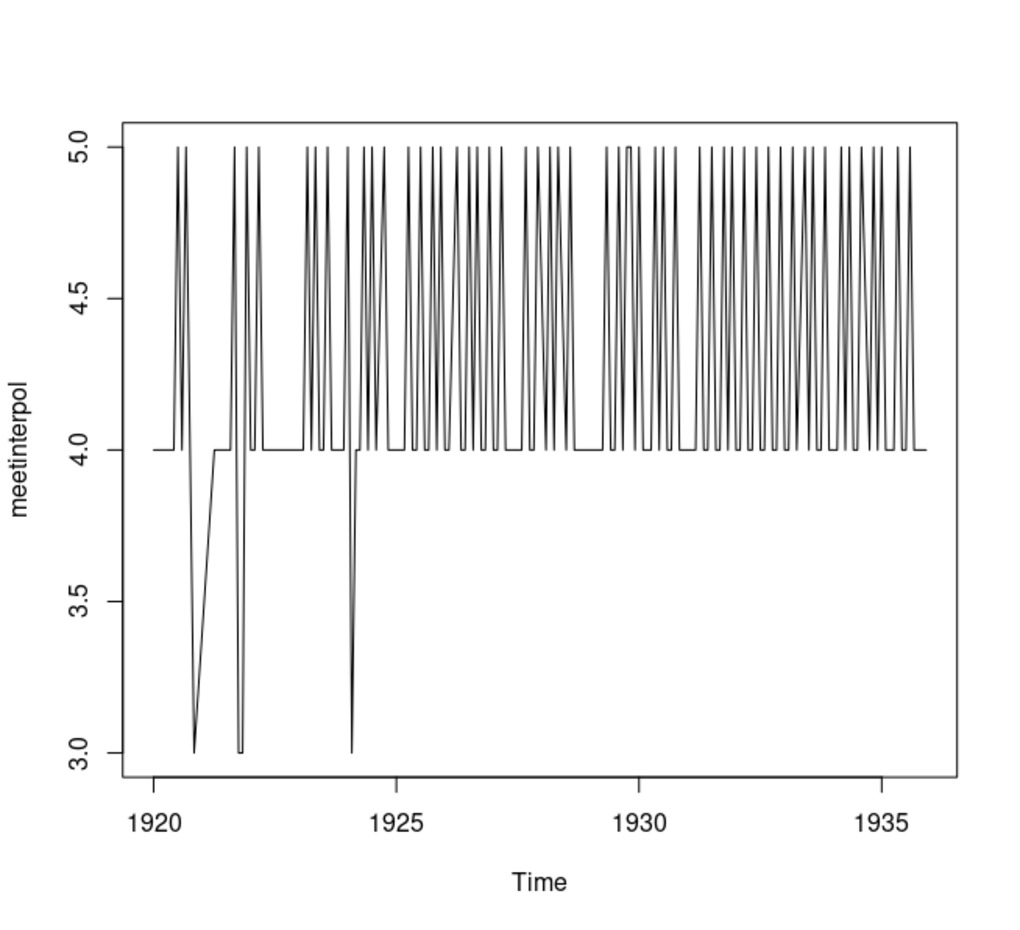 | 383 | Time series of meetings at the Shanghai Rotary Club | Based on the following dataset, the attached time series trace the evolution of meetings (monthly number of meetings per year) at the Rotary Club of Shanghai over the period May 1920-September 1935 (inclusive).
|
 | 380 | Time series of membership at the Shanghai Rotary Club | Based on the following dataset, the attached time series trace the evolution of membership at the Rotary Club of Shanghai over the period May 1920-September 1935 (inclusive).
|
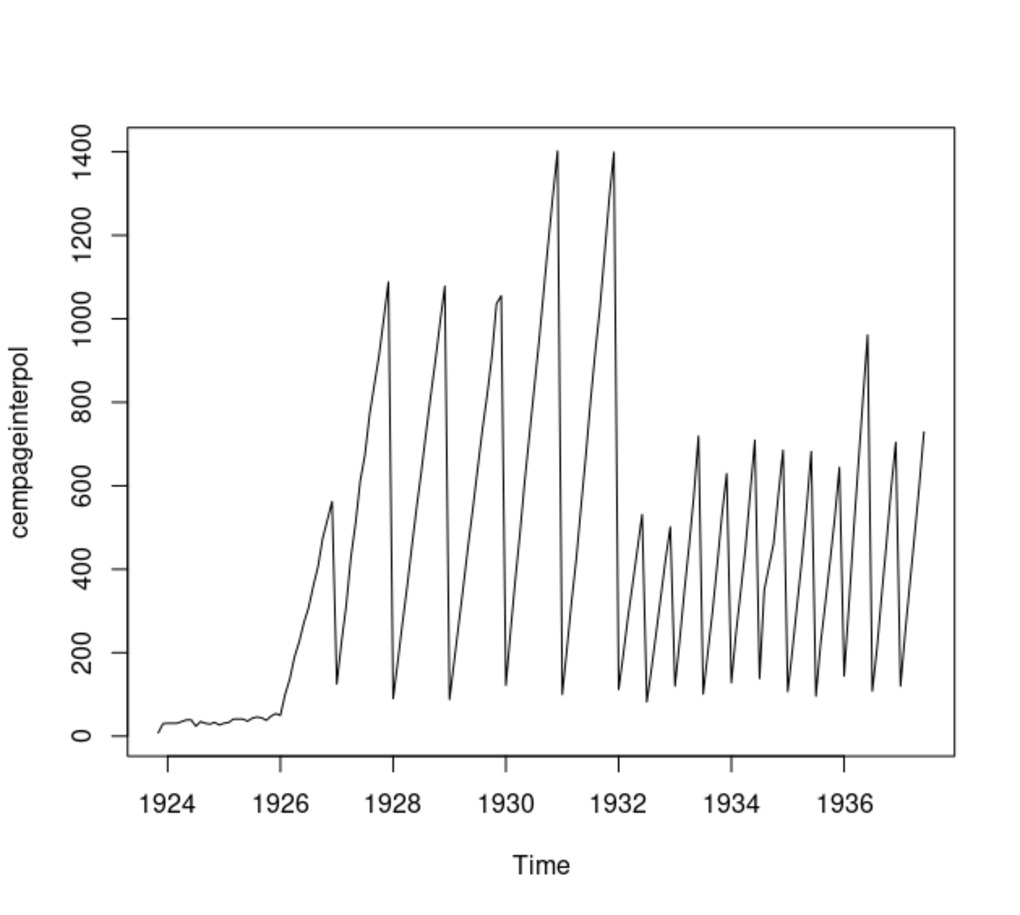 | 384 | Number of pages in the Chinese Economic Journal: A Time Series Analysis | Based on the following dataset, the attached time series trace the evolution in the volume (number of pages per issue) of the Chinese Economic Journal over the period November 1923-June 1937 (inclusive).
|
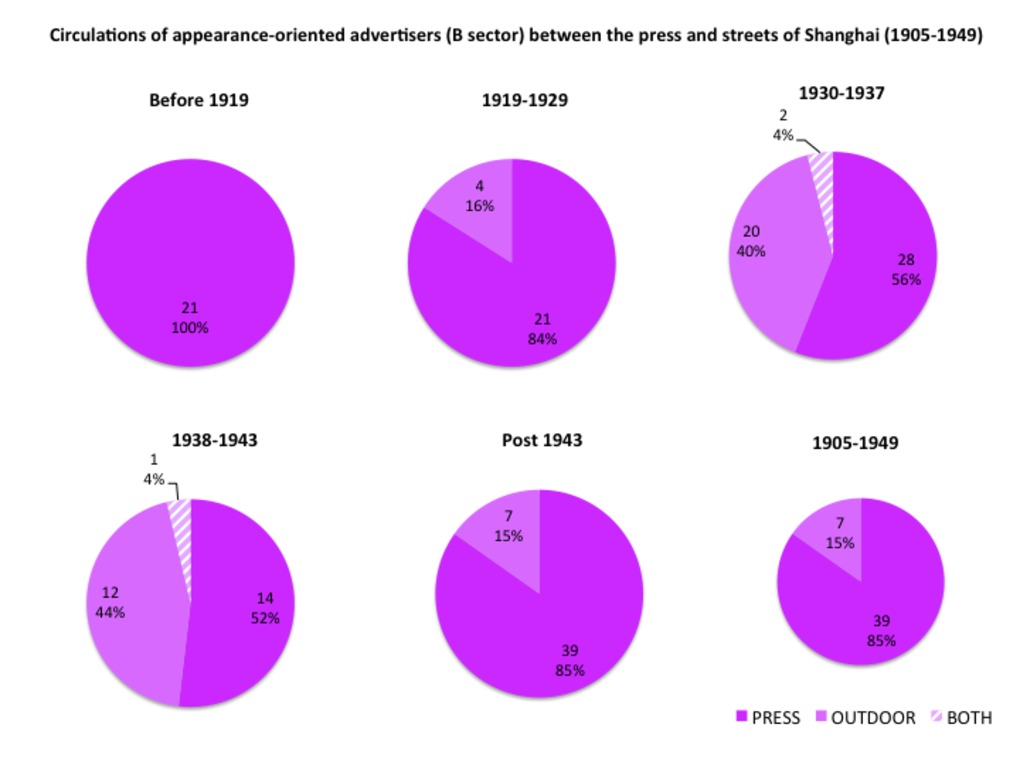 | 290 | Advertisers circulating between the press and streets of Shanghai, according to their business sector: appearance (B) and culture (C) (1914-1949) | Ce triple jeu de six camemberts chacun suit les circulations (ou les blocages) des annonceurs entre la presse et les rues de Shanghai, en fonction de leur secteur d'activité (selon le code adopté dans le quatrième chapitre, associant une lettre et une couleur à chaque secteur: http://madspace.org/cooked/Tables?ID=103). L'objectif est de savoir si certains secteurs productifs sont plus mobiles que d'autres, et si les circulations sont multilatérales ou unilatérales d'un journal à l'autre. Ce tableau a été réalisé à partir de la table associée : http://madspace.org/cooked/Tables?ID=158 Le premier ensemble de camemberts concerne la culture des apparences (B, en rose : cosmétiques, parures, objects décoratifs pour la maison, etc); le second la culture et les produits dits "culturels" (C, en marron). On rappelle que cette catégorie globale inclut les livres, radio, musique, annonces scolaires, cinéma, photographie, matériel bureautique, etc). |
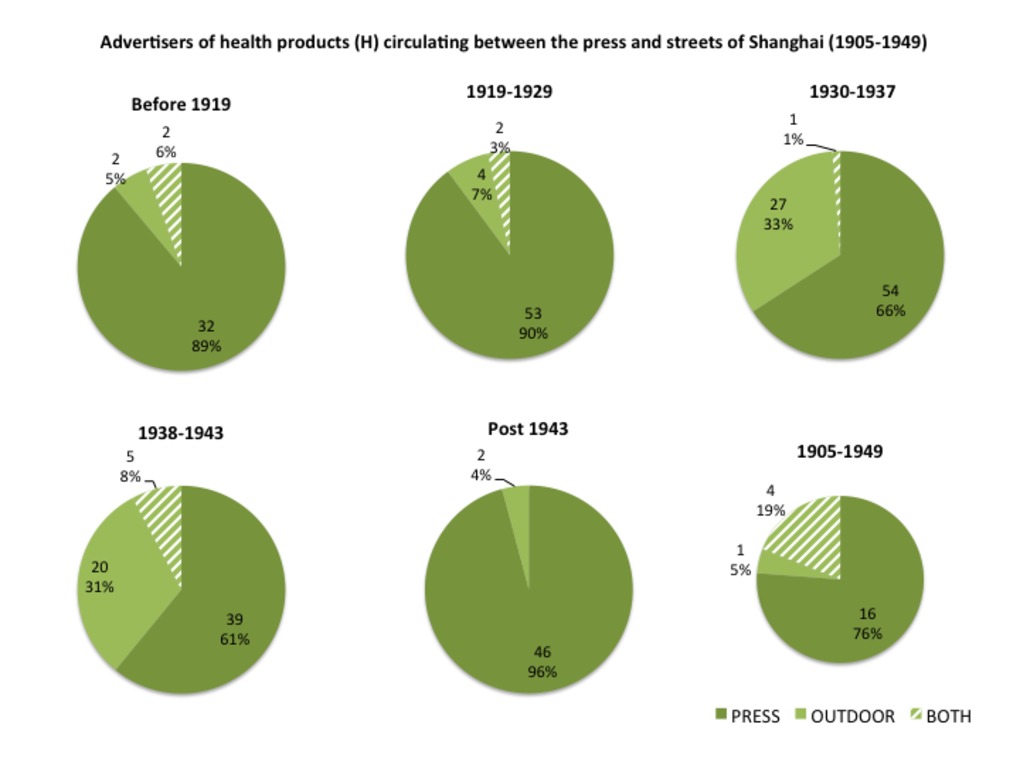 | 291 | Advertisers circulating between the press and streets of Shanghai, according to their business sector: health (H) and nutrition (N) (1914-1949) | Ce triple jeu de six camemberts chacun suit les circulations (ou les blocages) des annonceurs entre la presse et les rues de Shanghai, en fonction de leur secteur d'activité (selon le code adopté dans le quatrième chapitre, associant une lettre et une couleur à chaque secteur: http://madspace.org/cooked/Tables?ID=103). L'objectif est de savoir si certains secteurs productifs sont plus mobiles que d'autres, et si les circulations sont multilatérales ou unilatérales d'un journal à l'autre. Ce tableau a été réalisé à partir de la table associée : http://madspace.org/cooked/Tables?ID=158 Le premier ensemble de camemberts concerne la santé (H, en vert); le second les aliments et les boissons (N, en marron-vert). |
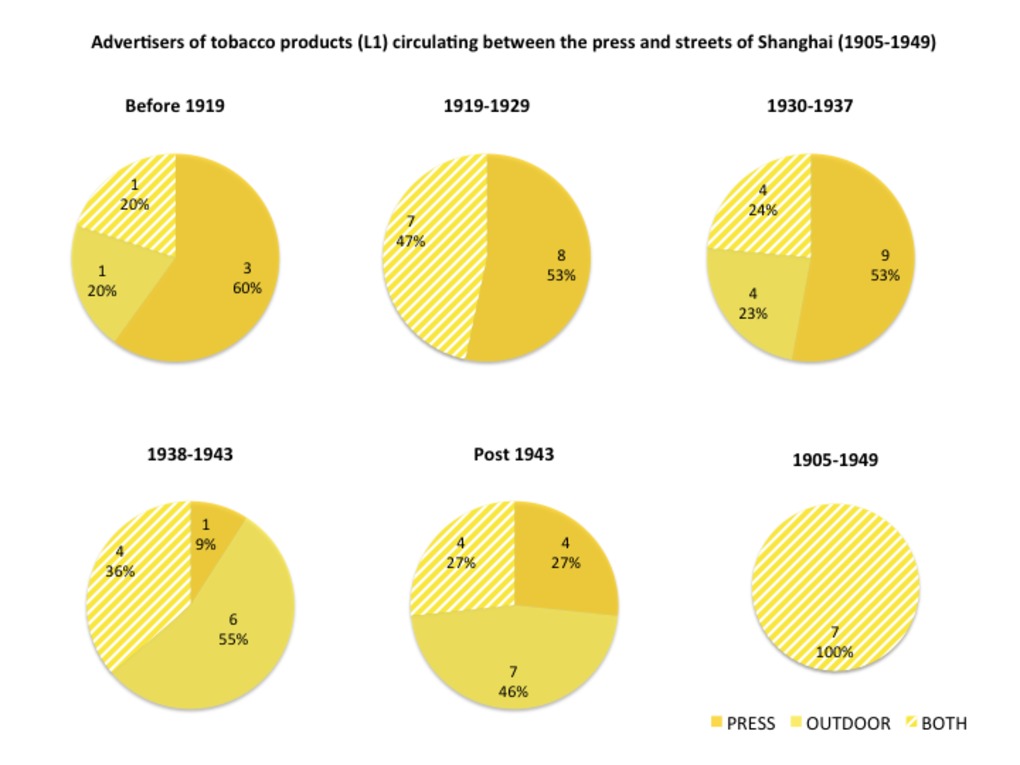 | 292 | Advertisers circulating between the press and streets of Shanghai, according to their business sector: tobacco (L1), alcohol (L2) and leisure (L3-L5) (1914-1949) | Ce triple jeu de six camemberts chacun suit les circulations (ou les blocages) des annonceurs entre la presse et les rues de Shanghai, en fonction de leur secteur d'activité (selon le code adopté dans le quatrième chapitre, associant une lettre et une couleur à chaque secteur: http://madspace.org/cooked/Tables?ID=103). L'objectif est de savoir si certains secteurs productifs sont plus mobiles que d'autres, et si les circulations sont multilatérales ou unilatérales d'un journal à l'autre. Ce tableau a été réalisé à partir de la table associée : http://madspace.org/cooked/Tables?ID=158 Le premier jeu de camemberts concerne le tabac (L1, en jaune); le deuxième les boissons alcoolisées (L2, en orange foncé); le troisième les loisirs et autres formes de plaisirs (L3-L5) (théâtre, cinéma, bar, restaurant, grand magasin, etc). |
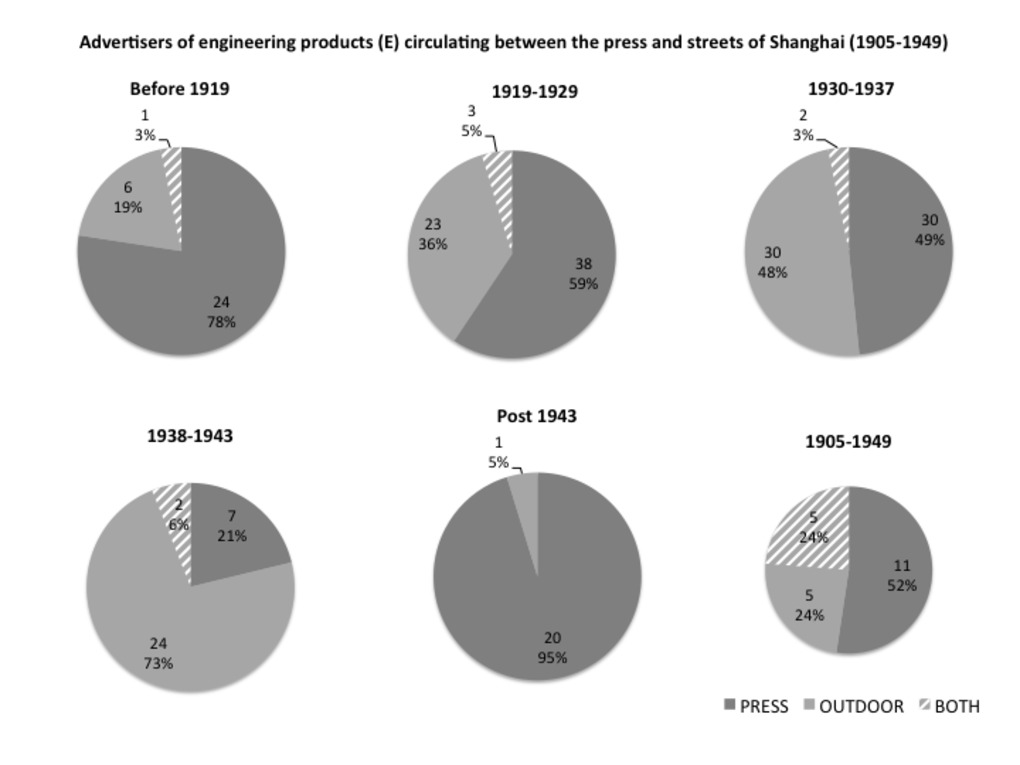 | 293 | Advertisers circulating between the press and streets of Shanghai, according to their business sector: industry (E), finance (F) and urban services (U) (1914-1949) | Ce triple jeu de six camemberts chacun suit les circulations (ou les blocages) des annonceurs entre la presse et les rues de Shanghai, en fonction de leur secteur d'activité (selon le code adopté dans le quatrième chapitre, associant une lettre et une couleur à chaque secteur: http://madspace.org/cooked/Tables?ID=103). L'objectif est de savoir si certains secteurs productifs sont plus mobiles que d'autres, et si les circulations sont multilatérales ou unilatérales d'un journal à l'autre. Ce tableau a été réalisé à partir de la table associée : http://madspace.org/cooked/Tables?ID=158 Le premier jeu de camemberts concerne le secteur financier (F, en violet); le deuxième l'industrie (E, en gris); le troisième les services (énergie et transports) (U, en bleu). |
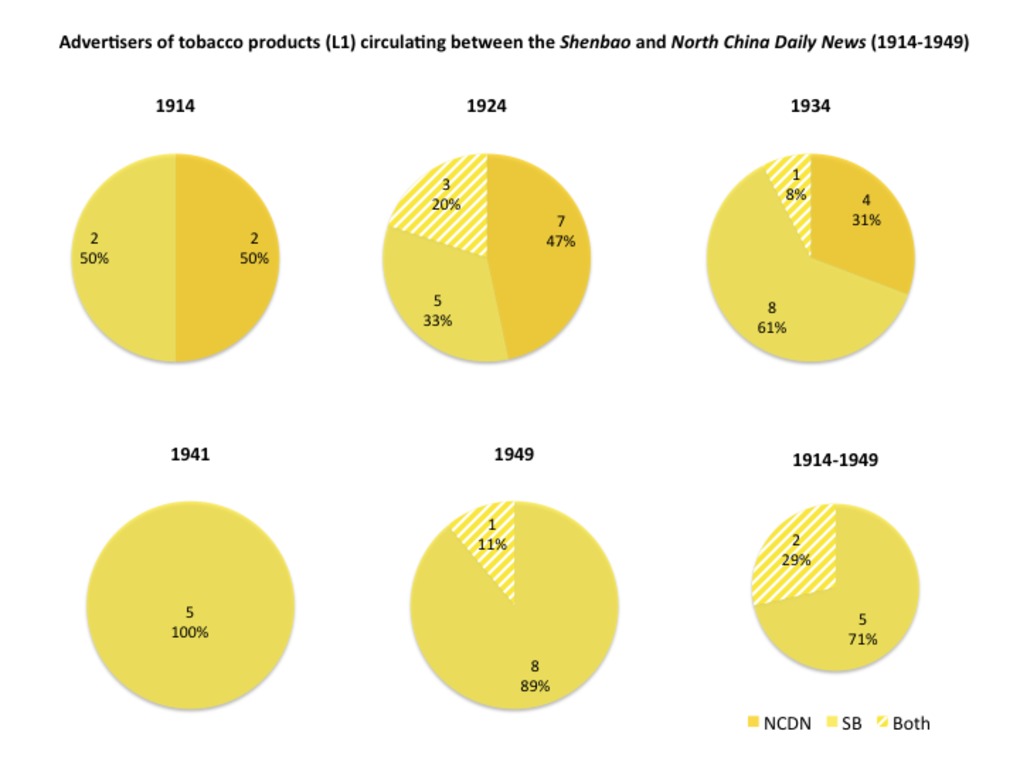 | 288 | Advertisers circulating within the Shanghai press, according to their business sector: tobacco (L1), alcohol (L2) and leisure (L3-L5) (1914-1949) | Ce triple jeu de six camemberts chacun suit les circulations (ou les blocages) des annonceurs entre le quotidien chinois Shenbao et son homologue britannique North China Daily News, en fonction de leur secteur d'activité (selon le code adopté dans le quatrième chapitre, associant une lettre et une couleur à chaque secteur: http://madspace.org/cooked/Tables?ID=103). L'objectif est de savoir si certains secteurs productifs sont plus mobiles que d'autres, et si les circulations sont multilatérales ou unilatérales d'un journal à l'autre. Ce tableau a été réalisé à partir de la table associée : http://madspace.org/cooked/Tables?ID=158 Le premier jeu de camemberts concerne le tabac (L1, en jaune); le deuxième les boissons alcoolisées (L2, en orange foncé); le troisième les loisirs et autres formes de plaisirs (L3-L5) (théâtre, cinéma, bar, restaurant, grand magasin, etc). |
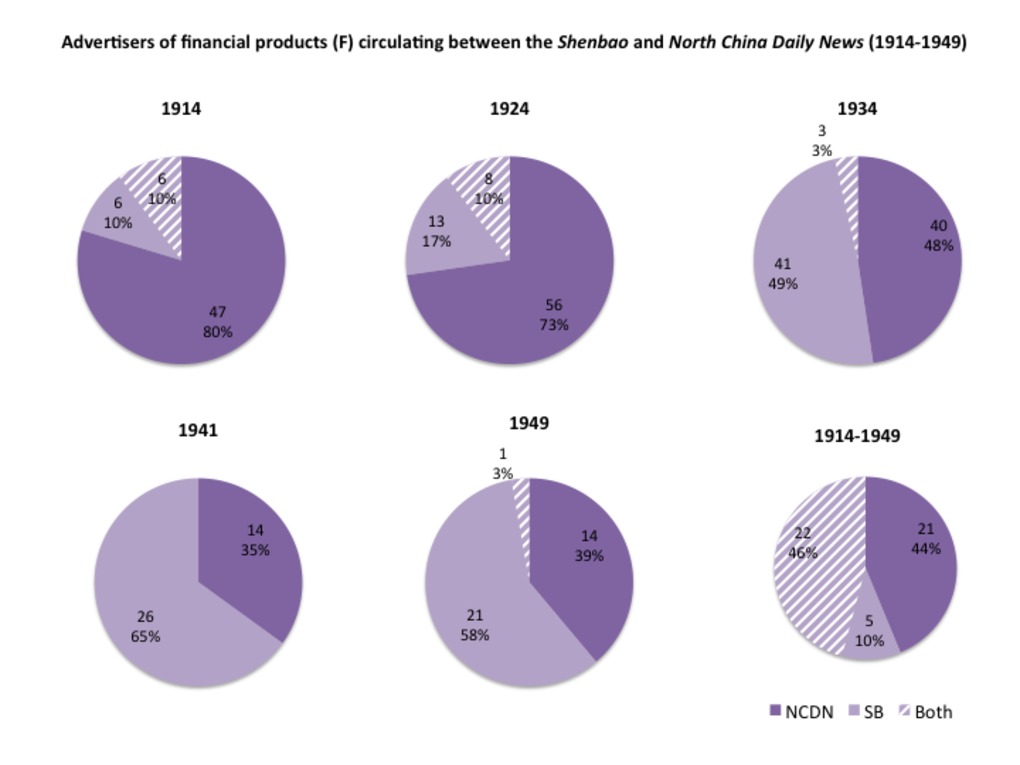 | 289 | Advertisers circulating within the Shanghai press, according to their business sector: industry (E), finance (F) and urban services (U) (1914-1949) | Ce triple jeu de six camemberts chacun suit les circulations (ou les blocages) des annonceurs entre le quotidien chinois Shenbao et son homologue britannique North China Daily News, en fonction de leur secteur d'activité (selon le code adopté dans le quatrième chapitre, associant une lettre et une couleur à chaque secteur: http://madspace.org/cooked/Tables?ID=103). L'objectif est de savoir si certains secteurs productifs sont plus mobiles que d'autres, et si les circulations sont multilatérales ou unilatérales d'un journal à l'autre. Ce tableau a été réalisé à partir de la table associée : http://madspace.org/cooked/Tables?ID=158 Le premier jeu de camemberts concerne le secteur financier (F, en violet); le deuxième l'industrie (E, en gris); le troisième les services (énergie et transports) (U, en bleu). |
 | 286 | Advertisers circulating within the Shanghai press, according to their business sector: appearance (B) and culture (C) (1914-1949) | Ce triple jeu de six camemberts chacun suit les circulations (ou les blocages) des annonceurs entre le quotidien chinois Shenbao et son homologue britannique North China Daily News, en fonction de leur secteur d'activité (selon le code adopté dans le quatrième chapitre, associant une lettre et une couleur à chaque secteur: http://madspace.org/cooked/Tables?ID=103). L'objectif est de savoir si certains secteurs productifs sont plus mobiles que d'autres, et si les circulations sont multilatérales ou unilatérales d'un journal à l'autre. Ce tableau a été réalisé à partir de la table associée : http://madspace.org/cooked/Tables?ID=158 Le premier ensemble de camemberts concerne la culture des apparences (B, en rose : cosmétiques, parures, objects décoratifs pour la maison, etc); le second la culture et les produits dits "culturels" (C, en marron). On rappelle que cette catégorie globale inclut les livres, radio, musique, annonces scolaires, cinéma, photographie, matériel bureautique, etc). |
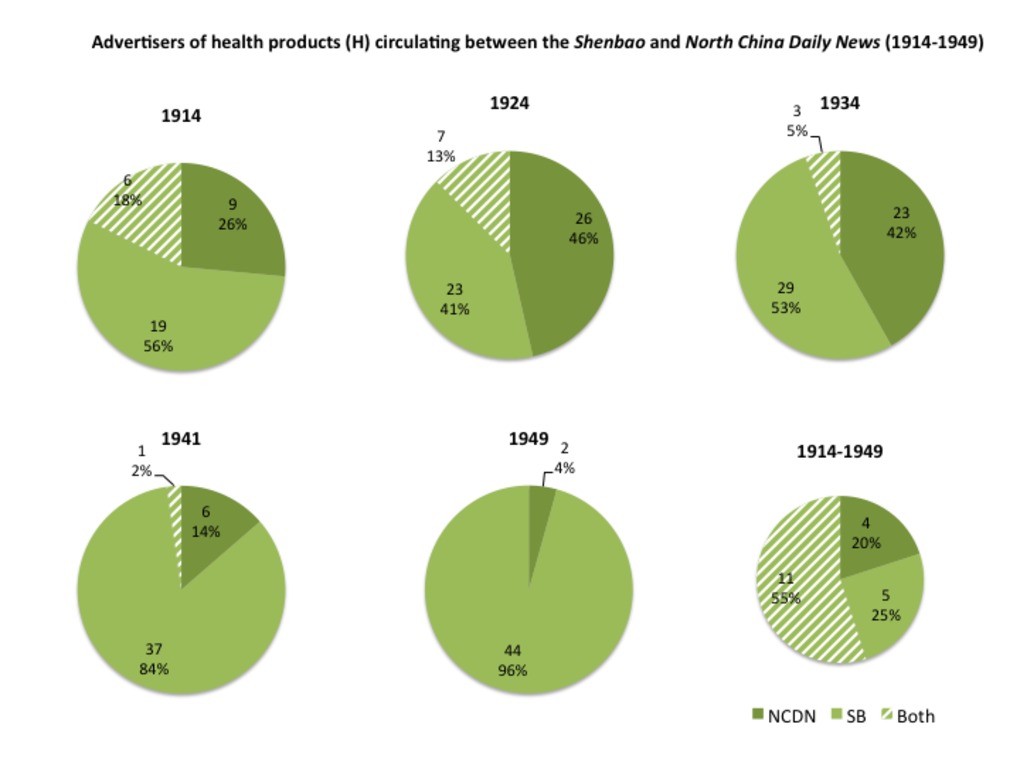 | 287 | Advertisers circulating within the Shanghai press, according to their business sector: health (H) and nutrition (N) (1914-1949) | Ce triple jeu de six camemberts chacun suit les circulations (ou les blocages) des annonceurs entre le quotidien chinois Shenbao et son homologue britannique North China Daily News, en fonction de leur secteur d'activité (selon le code adopté dans le quatrième chapitre, associant une lettre et une couleur à chaque secteur: http://madspace.org/cooked/Tables?ID=103). L'objectif est de savoir si certains secteurs productifs sont plus mobiles que d'autres, et si les circulations sont multilatérales ou unilatérales d'un journal à l'autre. Ce tableau a été réalisé à partir de la table associée : http://madspace.org/cooked/Tables?ID=158 Le premier ensemble de camemberts concerne la santé (H, en vert); le second les aliments et les boissons (N, en marron-vert). |
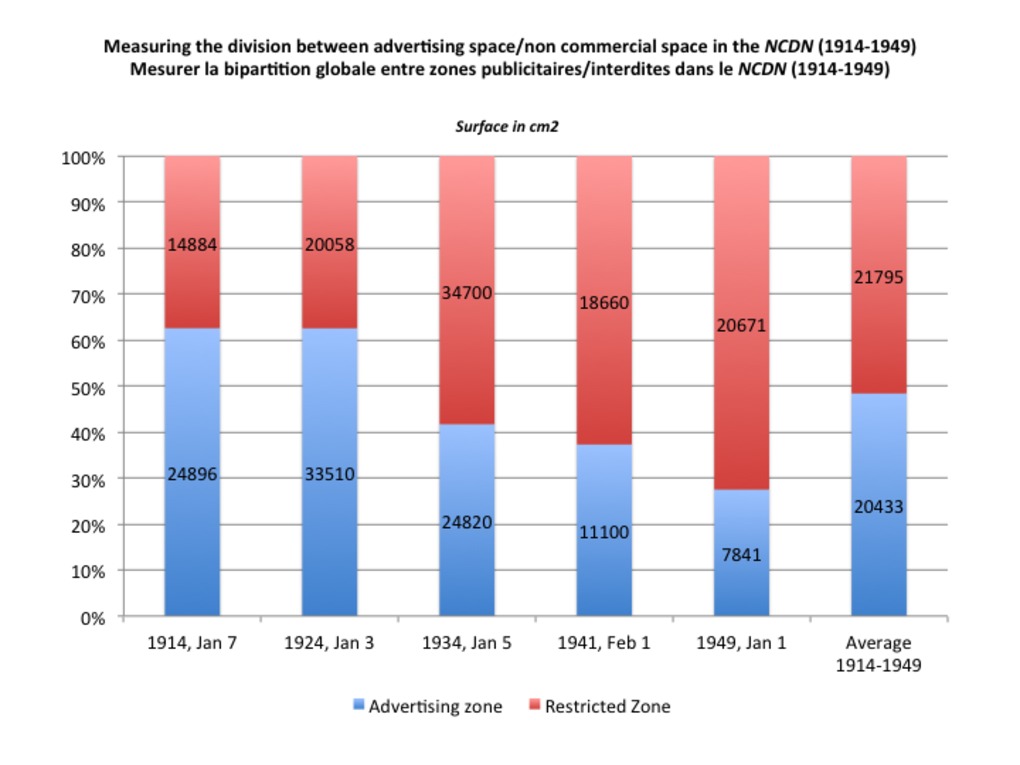 | 242 | Measuring the division between advertising space/non commercial space in the British newspaper North China Daily News between 1914 and 1949 (close reading/quantitative approach) | Ces histogrammes montrent la répartition de l'espace du journal entre espace publicitaire/zone autorisée (en bleu) et contenus non commerciaux/zone interdite de publicité (en rouge) dans le quotidien britannique North China Daily News. Par souci de cohérence, on s'est appuyé sur les cinq mêmes échantillons que pour le Shenbao : 7 janvier 1914, 3 janvier 1924, 5 janvier 1934, 1er février 1941, 1er janvier 1949. La démarche s'inspire directement de l'étude conduite par deux chercheurs de Qinghua dans cinq quotidiens chinois en décembre 1923 (Source: “An Analytical Study of Advertisements in Chinese Newspapers”. Chinese Economic Monthly (CEM). April 1926. Vol. III, No. 4, p.139-143). La structure relativement stable et "rationnelle" du quotidien britannique a simplifié la démarche par rapport au quotidien chinois. En effet, le groupement quasi géométrique des publicités permet d'évaluer facilement la surface publicitaire couverte sur chaque page, sans qu'il soit nécessaire d'additionner les surfaces individuelles. Rough English translation These bar charts measure the division between advertising space (blue)/non commercial space (red) in the Shanghai-based British newspaper North China Daily News between 1914 and 1949. For consistency reasons, the measurements were made after the same five samples as used for the Chinese newspaper Shenbao: January 7, 1914; January 3, 1924; January 5, 1934; February 1, 1941; January 1, 1949. The method was inspired by a contemporary study of newspaper advertising conducted in 1923 and published in the Chinese Economic Monthly in 1926 (source: “An Analytical Study of Advertisements in Chinese Newspapers”. Chinese Economic Monthly (CEM). April 1926. Vol. III, No. 4, p.139-143). |
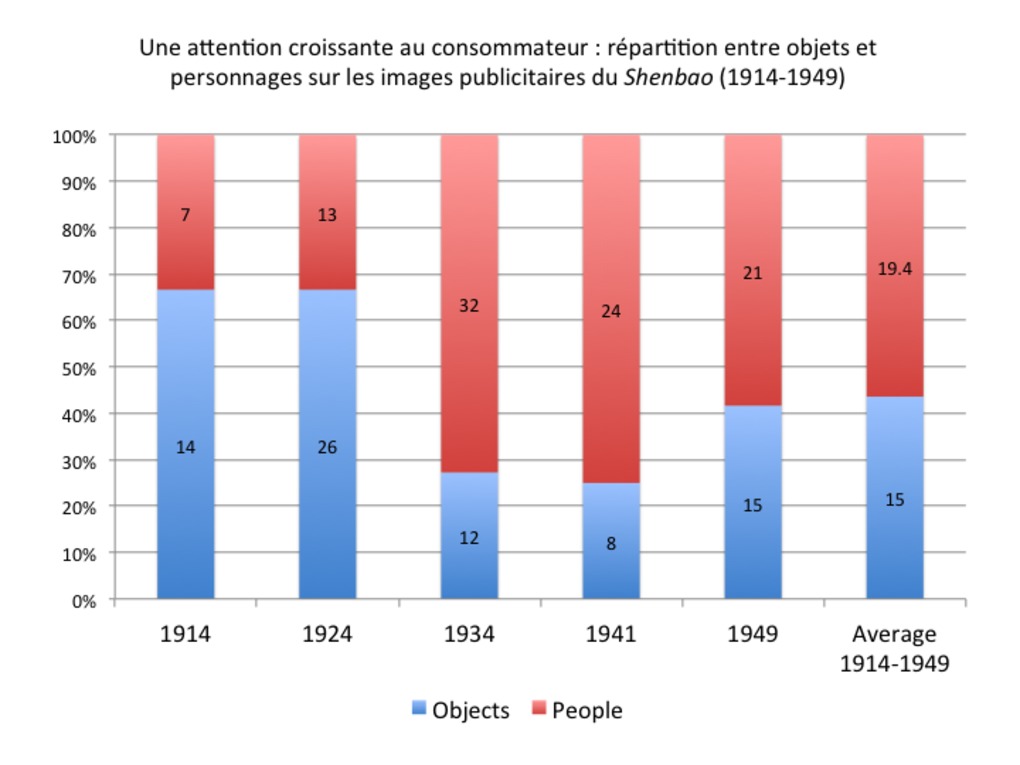 | 116 | Une attention croissante au consommateur : répartition entre objets et personnages sur les images publicitaires du Shenbao (1914-1949) | Etude de la répartition entre objets et personnages sur les images publicitaires du Shenbao (1914-1949). Mesures réalisées à partir de nos cinq échantillons de référence du quotidien chinois Shenbao : 1er-30 Janvier 1914 (échantillon volontairement élargi à un mois en raison du faible nombre d'images par numéro), 3 janvier 1924, 5 janvier 1934, 1er février 1941 et 1er janvier 1949. |