


| ID | Title | Description | |
|---|---|---|---|
 | 106 | The emergence of branding in the Shenbao (1914-1949) | Ces quatre courbes mesurent l'émergence des marques "modernes" (brands) dans le quotidien chinois Shenbao à partir de trois critères : le nombre d'occurrences des termes chinois 牌 (pai) et 商標 (shangbiao), d'un côté ; le nombre de marques modernes (défini par un nom et un logo propre au produit) dans un numéro du journal donné. Cinq échantillons ont servi de source aux relevés : les numéros du 7 janvier 1914, 3 janvier 1924, 5 janvier 1934, 1er février 1941, 1er janvier 1949. On constate l'augmentation du nombre de marques modernes (brands) et son association croissante au terme ancien 牌 (pai), tandis que le terme 商標 (shangbiao) se rapporte davantage au fabricant ou à la firme (il est l'équivalent du terme anglais trademark). Pour autant, les termes anciens se maintiennent et coexistent avec les marques nouvelles. |
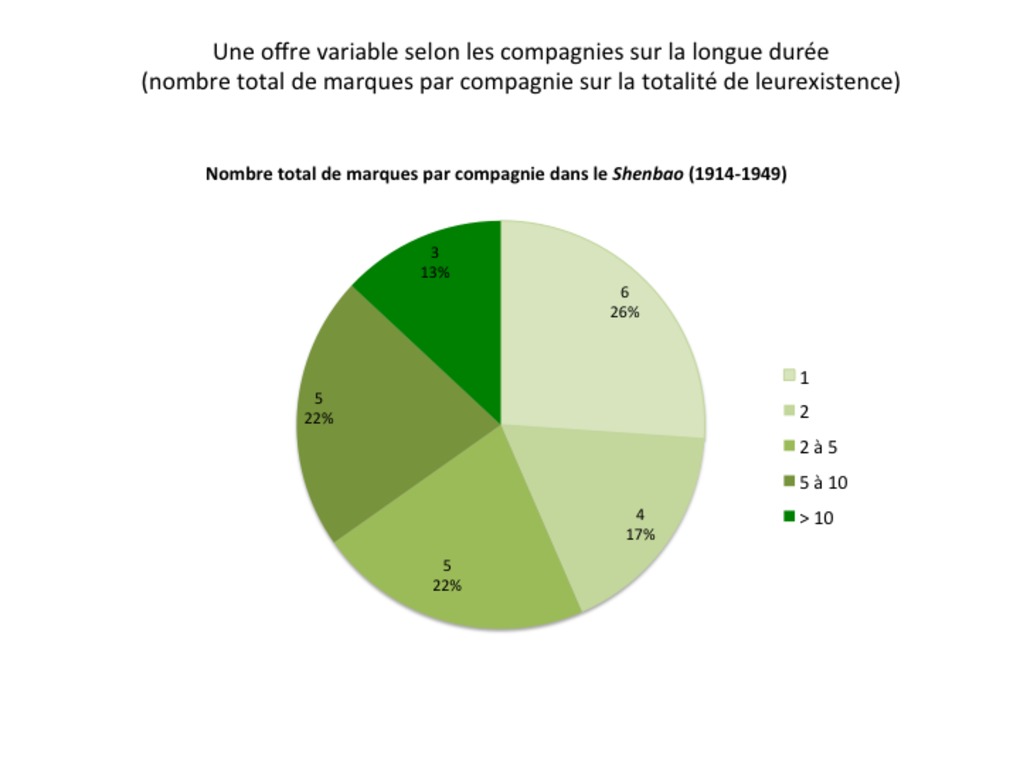 | 109 | Total number of medicines brands offered by each pharmaceutical company in the Shenbao (1914-1949) | Ce camembert mesure le nombre total de marques offertes par les compagnies pharmaceutiques présentes dans le Shenbao entre 1914 et 1949 sur toute la durée de leur existence. On constate de fortes inégalités de l'offre entre compagnies. |
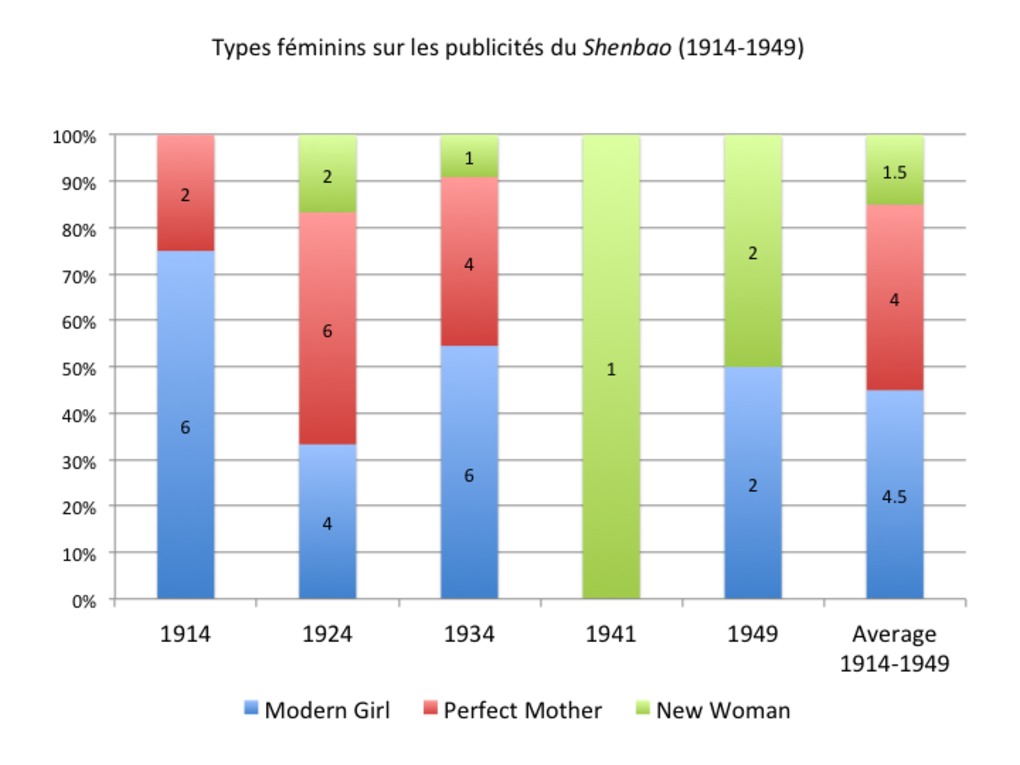 | 122 | Types féminins représentés sur les publicités du Shenbao (1914-1949) | Etude de la répartition entre les types féminins (Modern Girl, Perfect Mother and Housewife, New Woman) représentés sur les images publicitaires dans le Shenbao (1914-1949). Mesures réalisées à partir de nos cinq échantillons de référence du quotidien chinois Shenbao : 1er-30 Janvier 1914 (échantillon volontairement élargi à un mois en raison du faible nombre d'images par numéro), 3 janvier 1924, 5 janvier 1934, 1er février 1941 et 1er janvier 1949. |
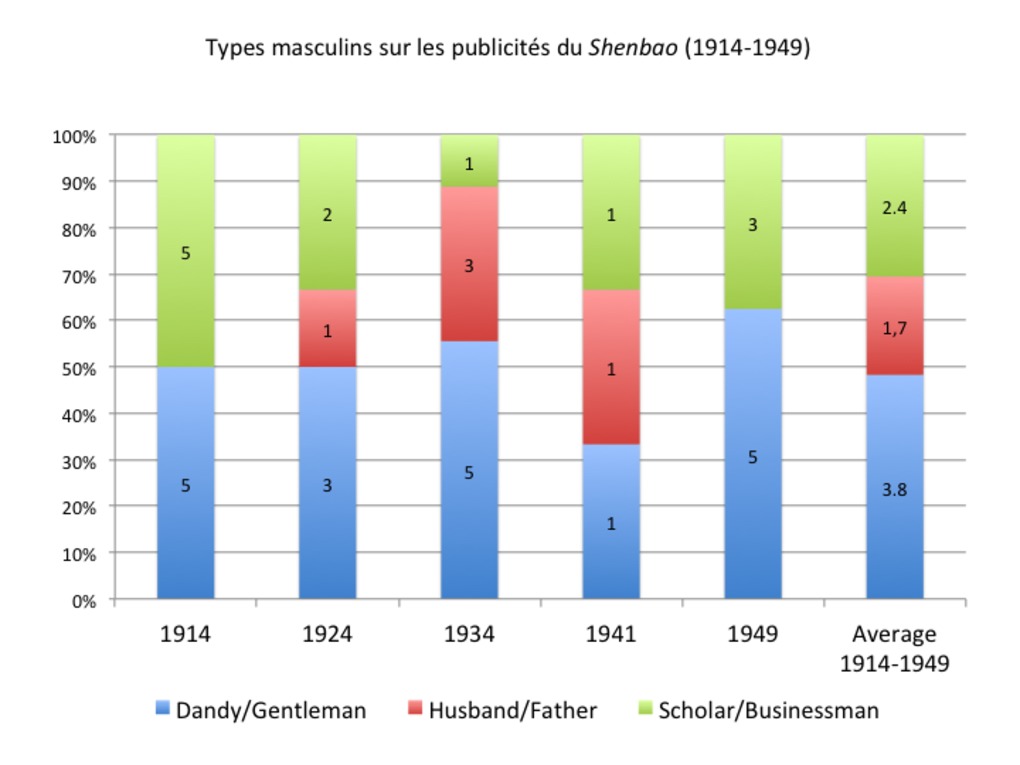 | 123 | Types masculins représentés sur les publicités du Shenbao (1914-1949) | Etude de la répartition entre les types masculins (Dandy/Gentleman, Husband/Father, Scholar/Businessman) représentés sur les images publicitaires dans le Shenbao (1914-1949). Mesures réalisées à partir de nos cinq échantillons de référence du quotidien chinois Shenbao : 1er-30 Janvier 1914 (échantillon volontairement élargi à un mois en raison du faible nombre d'images par numéro), 3 janvier 1924, 5 janvier 1934, 1er février 1941 et 1er janvier 1949. |
 | 129 | Types of products and business sectors advertised in the Chinese newspaper Shenbao (in terms of population/number of ads) (1914-1949) | Répartition démographique des secteurs productifs dans le quotidien chinois Shenbao (1914-1949) Proportion de produits/secteurs productifs exposés dans le quotidien britannique Shenbao (1914-1949). Cette répartition est mesurée en termes de population (nombre de publicités). Les mesures ont été réalisées à partir de nos cinq échantillons habituels du Shenbao : 7 janvier 1914, 3 janvier 1924, 5 janvier 1934, 1er fevrier 1941, 1er janver 1949. On a appliqué avec cohérence le code des lettres et des couleurs associé à notre typologie (http://madspace.org/cooked/Drawings?ID=114 ; http://madspace.org/cooked/Trees?ID=101). Proportion of products and business sectors advertised in the Chinese newspaper Shenbao (1914-1949) Types of products and business sectors advertised in the Chinese newspaper Shenbao (in terms of population/number of ads). The measurements were made after our five usual samples of the newspaper Shenbao (Jan 7, 1914; Jan 3, 1924; Jan 5, 1934; Feb 1, 1941; Jan 1, 1949). Each type of product is associated to a letter/number and color code, according to the following typology: http://madspace.org/cooked/Drawings?ID=114 ; http://madspace.org/cooked/Trees?ID=101.
|
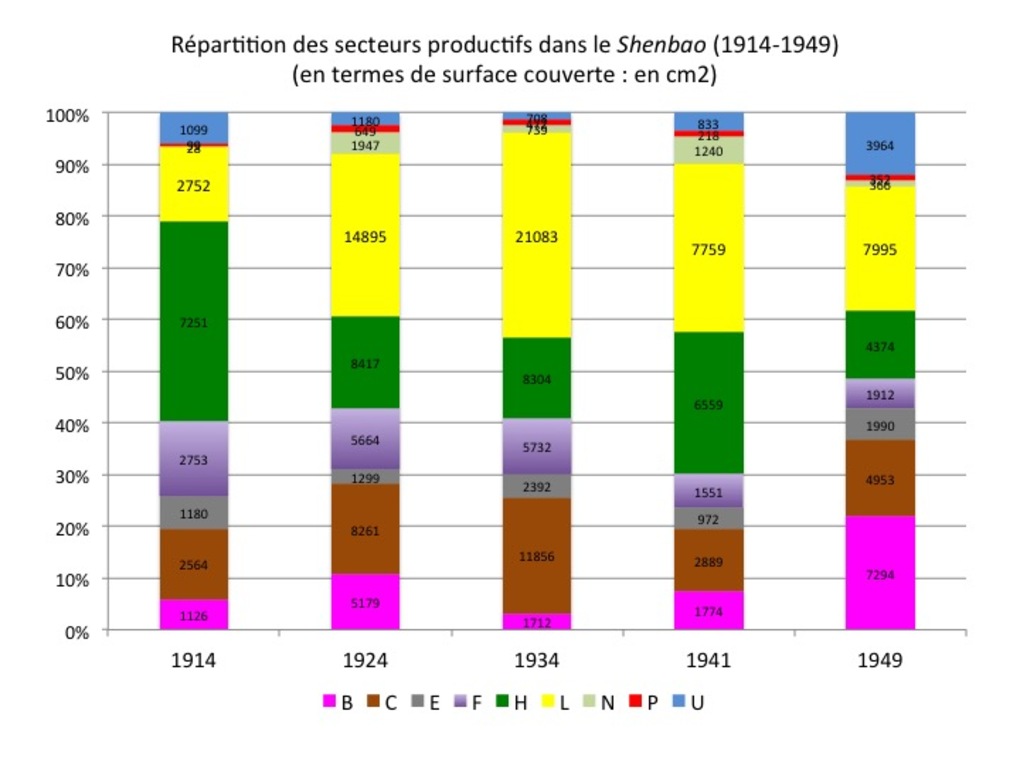 | 130 | Types of products and business sectors in the Chinese newspaper Shenbao (in spatial terms) (1914-1949) | Répartition de l'espace entre produits/secteurs productifs en termes de surfaces couvertes dans le quotidien chinois Shenbao (1914-1949) Types of produits et secteurs productifs exposés dans le Shenbao (1914-1949). Cette répartition est mesurée en termes d'espace (surface couverte, en cm2). Les mesures ont été réalisées à partir de nos cinq échantillons habituels du Shenbao : 7 janvier 1914, 3 janvier 1924, 5 janvier 1934, 1er fevrier 1941, 1er janver 1949. On a appliqué avec cohérence le code des lettres et des couleurs associé à notre typologie (http://madspace.org/cooked/Drawings?ID=114 ; http://madspace.org/cooked/Trees?ID=101). Types of products and business sectors advertised in the Chinese newspaper Shenbao (in terms of areas/surfaces) Types of products and business sectors advertised in the Chinese newspaper Shenbao (in terms of areas, that is the surface covered by advertisements). The measurements were made after our five usual samples of the newspaper Shenbao (Jan 7, 1914; Jan 3, 1924; Jan 5, 1934; Feb 1, 1941; Jan 1, 1949). Each type of product is associated to a letter/number and color code, according to the following typology: http://madspace.org/cooked/Drawings?ID=114 ; http://madspace.org/cooked/Trees?ID=101. |
 | 138 | Types de produits vendus dans le Shenbao d’après l’enquête de l’université Qinghua (1er décembre 1923) | Ce camembert visualise les résultats de l'étude rapprochée des chercheurs de Qinghua : il montre la répartition de l'espace du journal Shenbao entre les différents types de produits dans un numéro donné, le 1er décembre 1923, d'abord globalement (en termes de secteurs), puis plus finement (en termes de produits au sein de chaque secteur, à raison d'un camembert par secteur). |
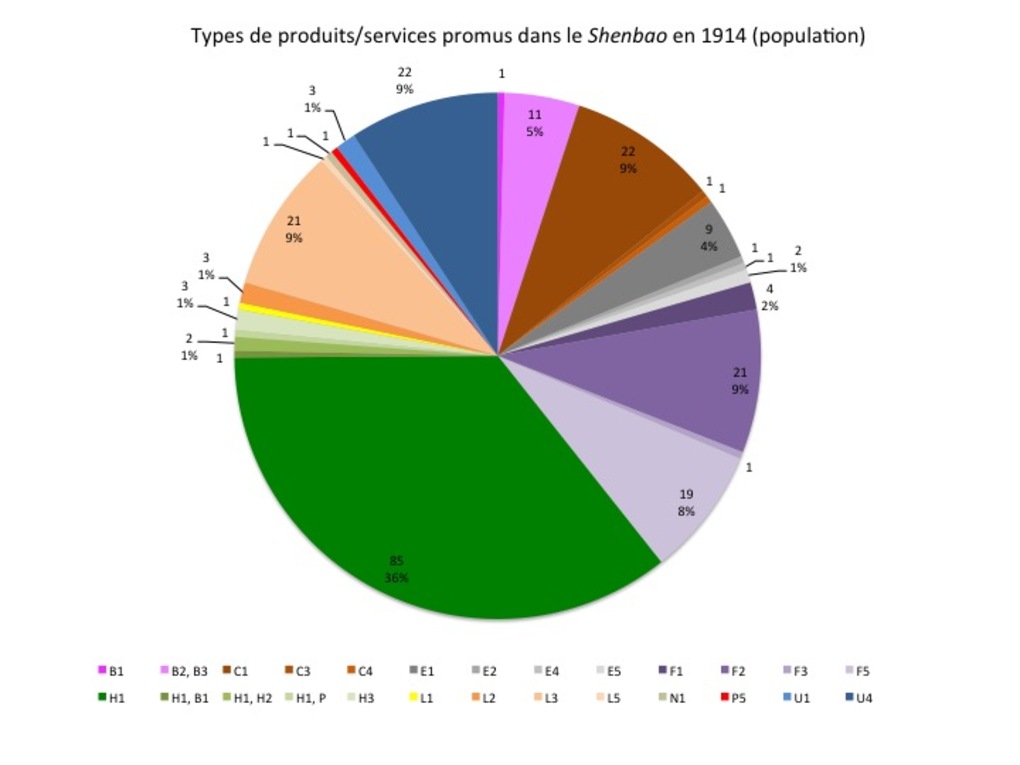 | 139 | Types de produits ou services promus dans le Shenbao entre 1914 et 1949 (en termes de population) | Cette série de cinq camemberts visualise l'importance relative des produits vendus dans le Shenbao entre 1914 et 1949, mesurée en termes de poulation (nombre de publicités) dans chaque numéro. Les mesures ont été réalisées à partir de nos cinq échantillons habituels (7 janvier 1914, 3 janvier 1924, 5 janvier 1934, 1er février 1941, 1er janvier 1949 ), à raison d'un camembert par échantillon. Ils proposent une approche plus fine que l'approche "sectorielle" visualisée sous forme d'histogrammes (voir documents liés). Pour suivre les évolutions, on s'est efforcé de suivre le code des lettres et des couleurs associé à notre typologie des produits. |
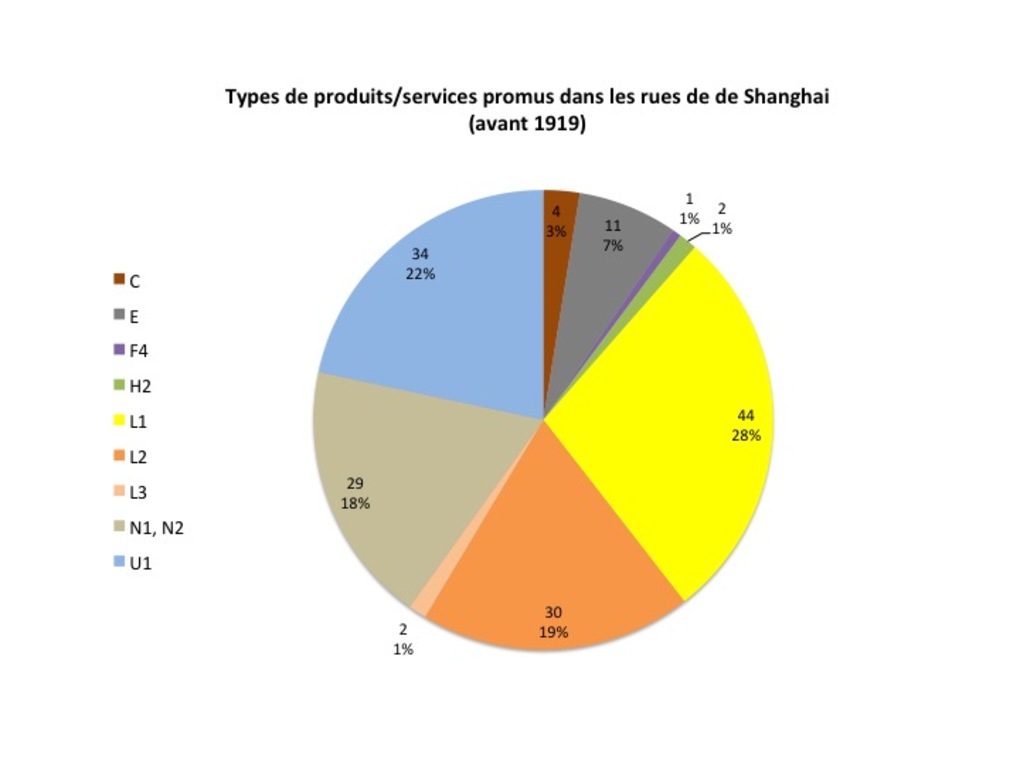 | 144 | Types de produits ou services promus dans les rues de Shanghai (concessions étrangères) (1905-1943) | Cette série de cinq camemberts visualise l'importance relative des produits vendus dans les concessions étrangères à Shanghai entre 1905 et 1943, mesurée en termes de poulation (nombre de publicités). Les mesures ont été réalisées à partir des archives municipales : enquêtes de 1914 et 1943 dans la concession internationale, relevés semi-annuels des néons de Claude Neon Light dans la concession française en 1933-1937 et relevés épars à partir des demandes de permis. On a réalisé un camembert par tranche périodique : pour des raisons documentaires, le premier et le dernier présentent les résultats les plus fiables. Ces camemberts proposent une approche plus fine que l'approche "sectorielle" visualisée sous forme d'histogrammes (voir documents liés). Pour suivre les évolutions, on s'est efforcé de suivre le code des lettres et des couleurs associé à notre typologie des produits. |
 | 191 | Types of page-landscapes in the Chinese newspaper Shenbao (1914-1949) | Evolution des paysages (types de pages) dans le Shenbao entre 1914 et 1949 Cette succession d'histogramme mesurent l'importance relative de chaque type de page dans le Shenbao, et leur évolution au cours du temps entre 1914 et 1949. Les mesures ont été réalisées à partir des cinq échantillons habituels du Shenbao : 7 janvier 1914 (14p), 3 janvier 1924 (22p), 5 janvier 1934 (32 p), 1er février 1941 (14p), 1er janvier 1949 (14p). L'axe des ordonnées indique le nombre de pages, l'axe des abscisses sert de ligne du temps. A chaque type est associée une couleur : rouge pour la colonne verticale (type A), bleu pour la bande horizontale (B), vert pour la grille/quadrillage (C), violet pour la mosaïque (D). Types of page-landscapes in the Chinese newspaper Shenbao (1914-1949) This set of bar charts aims to measure the proportion of the various types of pages in the five usual samples of the Chinese newspaper Shenbao (January 7, 1914; January 3, 1924; January 5, 1934; February 1, 1941; January 1, 1949), according to the same following typology and color code; vertical column-style (A, red), horizontal stripe-style (B, blue), grid (C, green), mosaïc/patchwork (D, purple). |
 | 196 | The unequal adoption of the "ideal copy" by the various types of products in the Shenbao (1914-1949) | Ce jeu de cinq camembers (à raison d'un par échantillon) révèle l'adoption inégale de la "copy" idéale selon les types de produits. Les médicaments sont les premiers et les plus enclins à suivre le modèle, même si cette part décline progressivement sous la concurrence de nouveaux produits (de 55% en 1914 à 13% en 1949). En 1914, ils sont suivis par l'industrie (23%), l'alcool (9%), la nutrition (5%), les cigarettes et la culture des apparences (4% chacun). En 1924, ces secteurs ne s'écartent pas de la norme et de nouveaux l'adoptent à leur tour ; culture (8%), divertissements (5%) et dans une moindre mesure, services (finance et transport, 3% chacun). Ces secteurs maintiennent leur attachement au modèle : les cosmétiques (9% en 1934, 7% en 1941, 41% en 1949), les divertissements (23% en 1934, 43% en 1941, 18% en 1949), les cigarettes (8% en 1934, 3% en 1941, 10% en 1949) et la nutrition (6% en 1934, 8% en 1941) se montrant les plus fidèles. Les mesures ont été réalisées à partir de nos échantillons habituels du Shenbao : 7 janvier 1914, 3 janvier 1924, 5 janvier 1934, 1er février 1941, 1er janvier 1949. *Par "copy" idéale, il faut entendre toute publicité composée d'au moins deux des élement textuels et un des éléments visuels définis dans les manuels publicitaires (cf. chapitre 5 et échelle graduée de la visualité/écarts à la norme) Rough translation This set of five pie charts (one per sample) reveals the uneven adoption of the "copy" ideal by the various types of products. Health products were the first and most likely to follow the pattern, although their share gradually declined under competition from new products (55% in 1914 to 13% in 1949). In 1914, medicines are followed by industrial products/services (23%), alcoholic drinks (9%), foodstuff (5%), cigarette and beauty products (4% each). In 1924, the pionneering products do not deviate from the norm and new ones started to follow the trend: culture (8%), entertainments (5%) and to a lesser extent, services (finance and transportation, 3% each). Until the end of the period, those sectors maintained their conformity to the model: cosmetics (9% in 1934, 7% in 1941, 41% in 1949), entertainments (23% in 1934, 43% in 1941, 18% in 1949), cigarettes (8 % in 1934, 3% in 1941, 10% in 1949) and foodstuff (6% in 1934, 8% in 1941) proved the closest to the ideal copy. These measurements were made from our usual samples of the Shenbao: January 7, 1914; January 3, 1924; January 5, 1934; February 1, 1941; January 1, 1949. * By "ideal copy", I mean any advertising composed of at least two of the textual elements and one of the visual elements identified by contemporary handbooks (see Chapter 5 and my own scale of visuality/deviations from the ideal copy). |
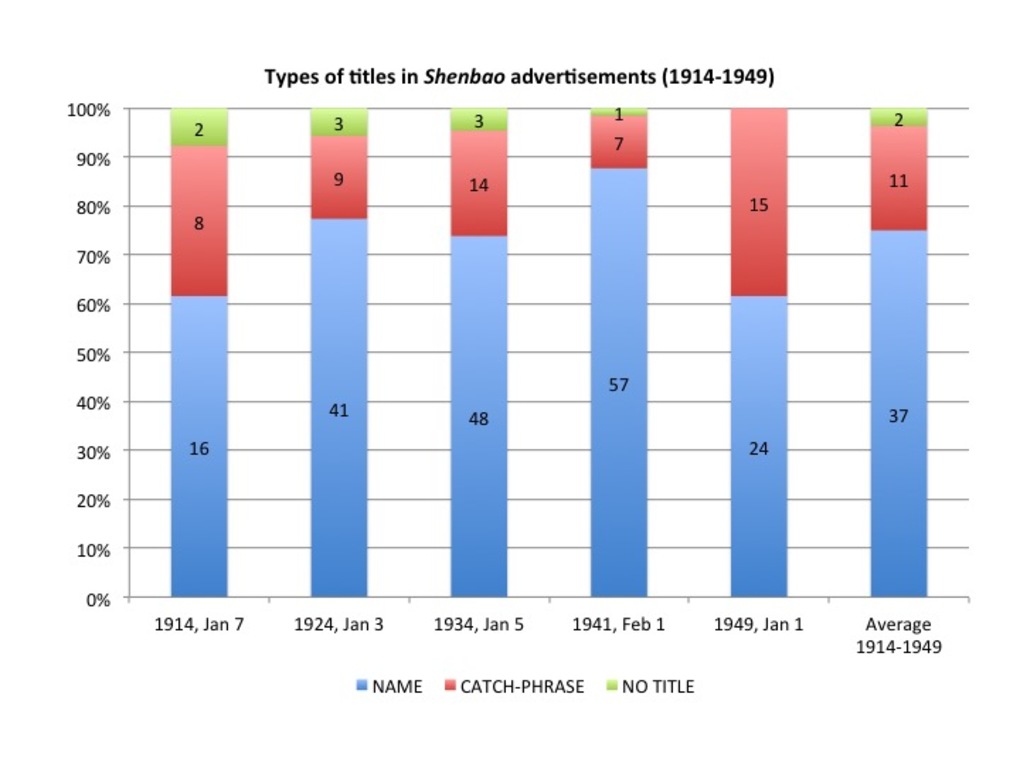 | 197 | Types of titles in Shenbao advertisements (1914-1949) | This set of six bar charts measures the relative importance of the various types of advertisement titles in our usual samples of the Shenbao (January 7, 1914; January 3, 1924; January 5, 1934; February 1, 1941; January 1, 1949). The figures show that the "name" type (name of either the company or the product/brand) predomines during the whole period (between 60% in 1914/1949 to 90% in 1941, average: 75%). This preference for title-names (mingcheng) was also noticed by contemporary handbooks (Su, 1929: 43). |
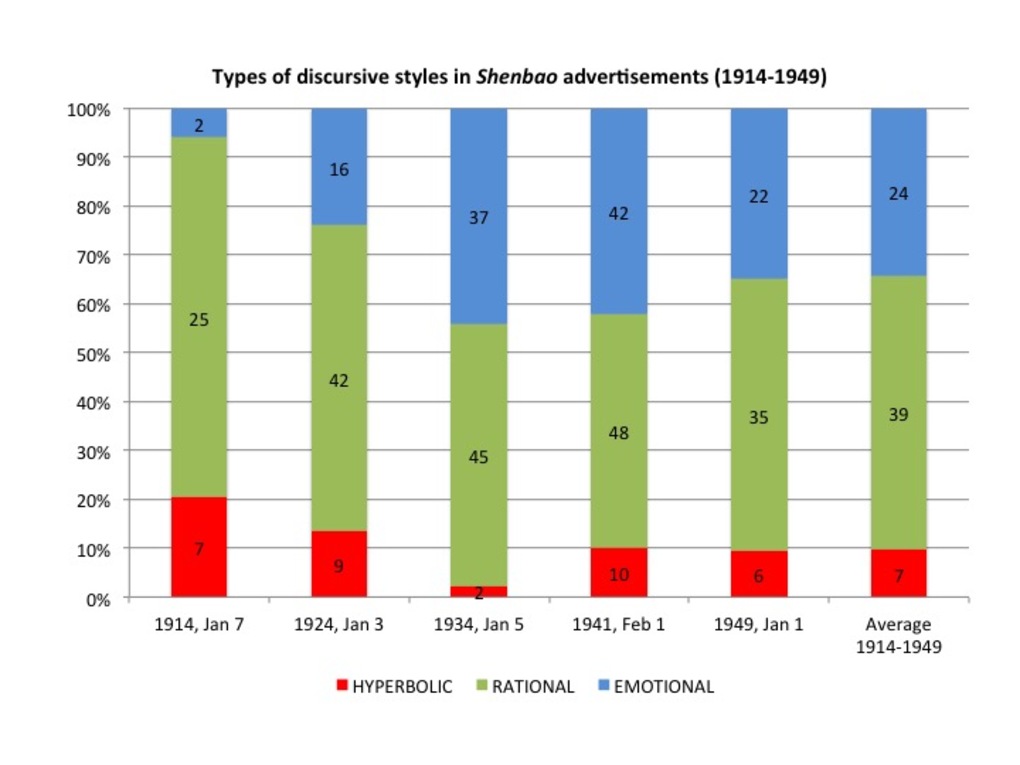 | 198 | Types of discursive styles in the Chinese newspaper Shenbao advertisements (1914-1949) | This set of six bar charts measure the relative importance of the three main types of discursive styles (or "ages") in our usual samples of the Shenbao: January 7, 1914; January 3, 1924; January 5, 1934; February 1, 1941; January 1, 1949. The figures show that the "rational" style prevailed during the whole period (average: 60%). Yet it tends to decline between 1914 (75%) and 1934-1949 (50%), gradually competed by the emotional/suggestive style (from 5% in 1914 to 45% in 1934, average 25%). The hyperbolic (exaggeration) remained marginal (less than 10%): pertaining to the age of "quack advertising", it was above all represented at the beginning of the period (20% in 1914). However, the three styles continued to cohabit on the pages of the same newspaper issue, and even on the same advertisement. The hyperbolic style was never eradicated by the rational or emotional styles asosicated with "modern" advertising, nor did the emotional tone replace reason-why copies. |
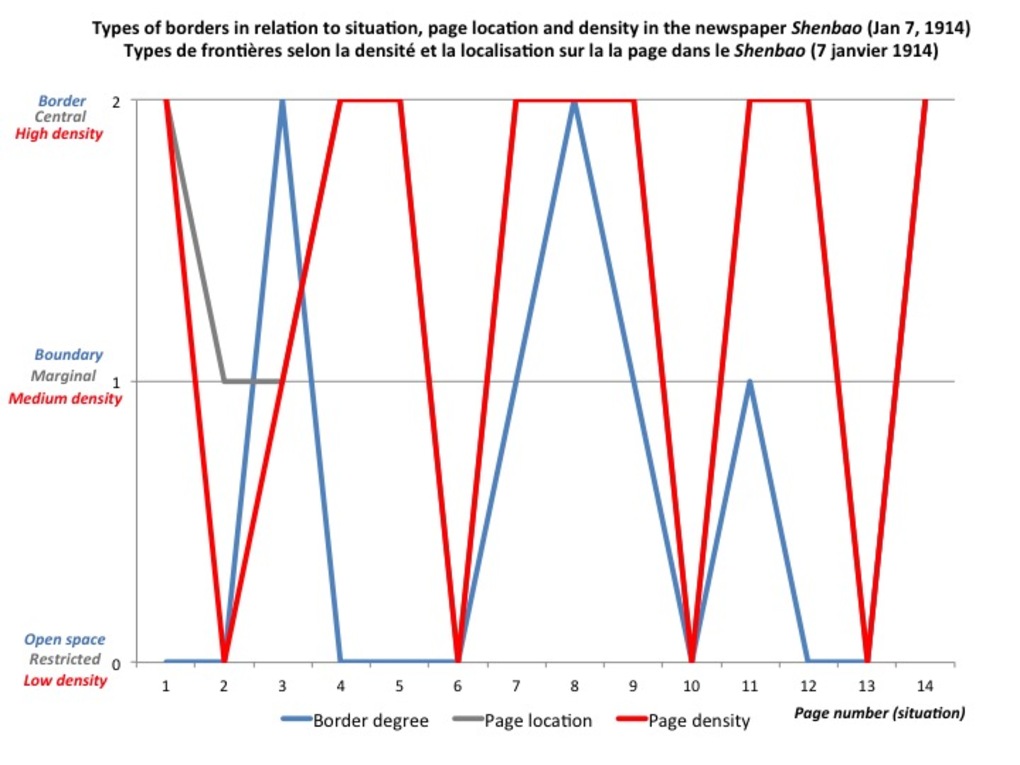 | 217 | Types of advertisement borders correlated to situation, page location and density in the newspaper Shenbao (1914-1949) | This triple line graph aims to correlate types of borders to their situation (page number), page location and to the density of advertisements on each page in our usual samples of the newspaper Shenbao (Jan 7, 1914 ; Jan 3, 1924 ; Jan 5, 1934 ; Feb 1, 1941 ; Jan 1, 1949). The blue line stands for border types, the red line for page density and the grey line for page location. The "X" axis indicates page numbers. The "Y" axis measures either the type of border (0 for open space, 1 for boundary, 2 for border), the density of advertisements on each page (from 0 : < 5 ads/page; 1: between 5 and 10 ads; 2 : > 10 ads/page) or the page location (0 for maginal, 1 for central).
|
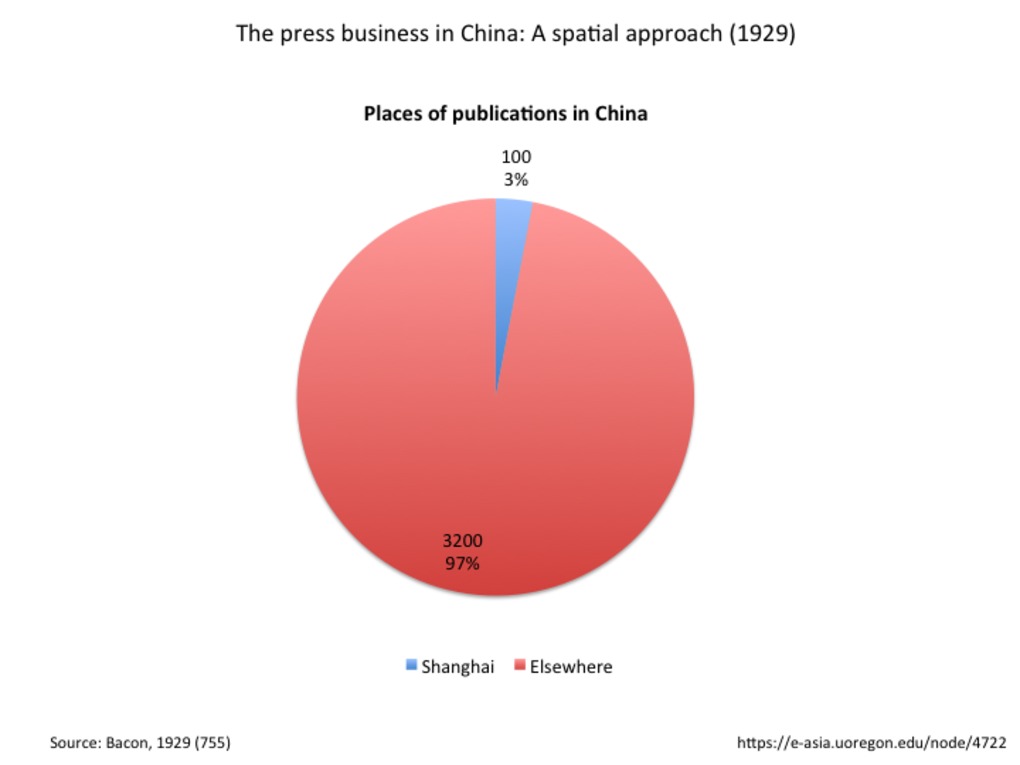 | 235 | The press business in China: A spatial approach (1929) | This pie charts shows the distribution of publications between Shanghai (said to be the center for the press and puslishing business in China at the time) and elsewhere in China. Surprisingly, Shanghai represents only 3% of all publications in China at the time. Yet these figures did not take into account other criteria measuring the qualitative importance of each publication (in terms of readership, spatial coverage, longevity or advertising value). Source: Bacon, 1929 (755) |
 | 238 | Time variations in the recorded advertising population in Shanghai foreign settlements (1905-1943) | This timeline-style bar chart reveals the uneven distribution of recorded advertisements in Shanghai foreign settlements between 1905-1943, in terms of temporal coverage (variations across time). This graph has been established after the Shanghai municipal archives. The last years (1938-1943) are the most well-documented (65% of the recorded population during the entire period), due a huge inventory of the advertising hoardings existing in the International settlement in may 1943 commanded by the Shanghai Municipal. The 1930s are quite well-documented, thanks to the semi-annual lists of neon lights provided to the French Municipal Council by the compagnie Claude Neon Light, Fed. Inc. The 1920s are the least documented years, based on scattered applications for permits. Considering that the advertising business and measuring instruments were are their early stage, the first période (before 1919) is relatively quite well documented. Data for this early period mainly came from the first major census commanded by the Shanghai Municipal Council in 1914, with a view to tax advertising hoardings existing in the International Settlement, based on their surface. |
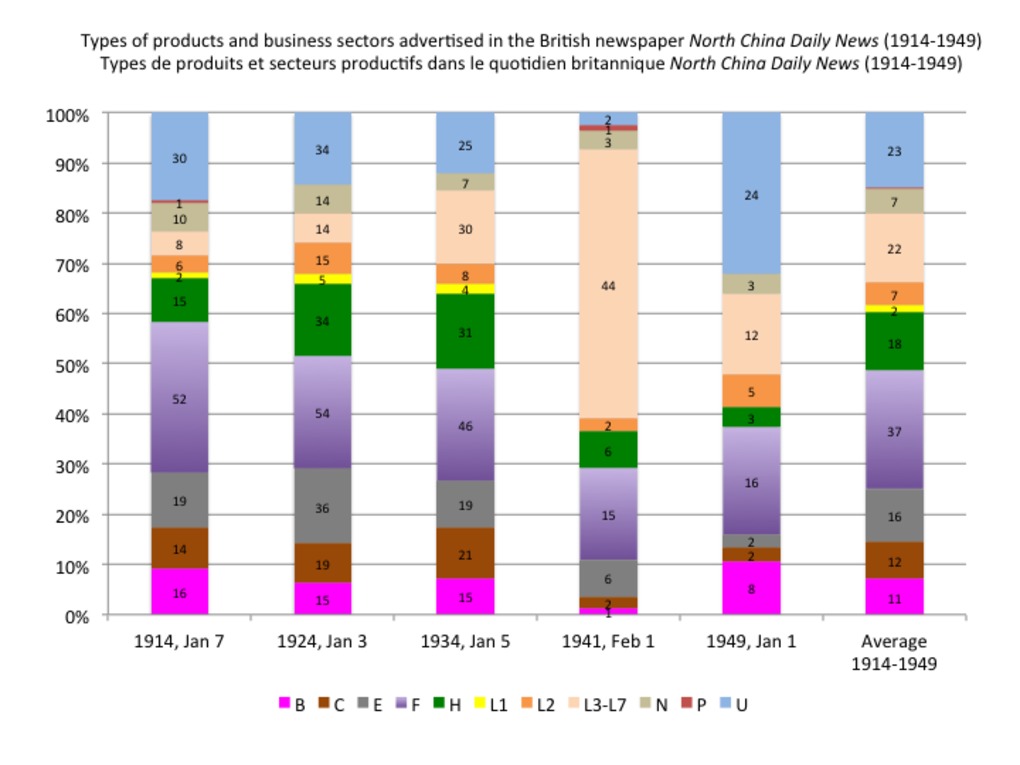 | 244 | Types of products and business sectors advertised in the British newspaper North China Daily News (1914-1949) | Répartition démographique des secteurs productifs dans le North China Daily News (1914-1949) Proportion de produits/secteurs productifs exposés dans le quotidien britannique North China Daily News (1914-1949). Cette répartition est mesurée en termes de population (nombre de publicités). Par cohérence, les mesures ont été réalisées à partir des cinq mêmes échantillons que pour le quotidien chinois Shenbao : 7 janvier 1914, 3 janvier 1924, 5 janvier 1934, 1er fevrier 1941, 1er janver 1949. On a appliqué avec cohérence le code des lettres et des couleurs associé à notre typologie (http://madspace.org/cooked/Drawings?ID=114 ; http://madspace.org/cooked/Trees?ID=101). Proportion of products and business sectors advertised in the British newspaper North China Daily News (1914-1949) Types of products and business sectors advertised in the Shanghai-based British newspaper North China Daily News (in terms of population/number of ads). For consistency reasons, the measurements were made after the same five samples as those used for the Chinese newspaper Shenbao (Jan 7, 1914; Jan 3, 1924; Jan 5, 1934; Feb 1, 1941; Jan 1, 1949). Each type of product is associated to a letter/number and a color code, according to the following typology: http://madspace.org/cooked/Drawings?ID=114 ; http://madspace.org/cooked/Trees?ID=101. |
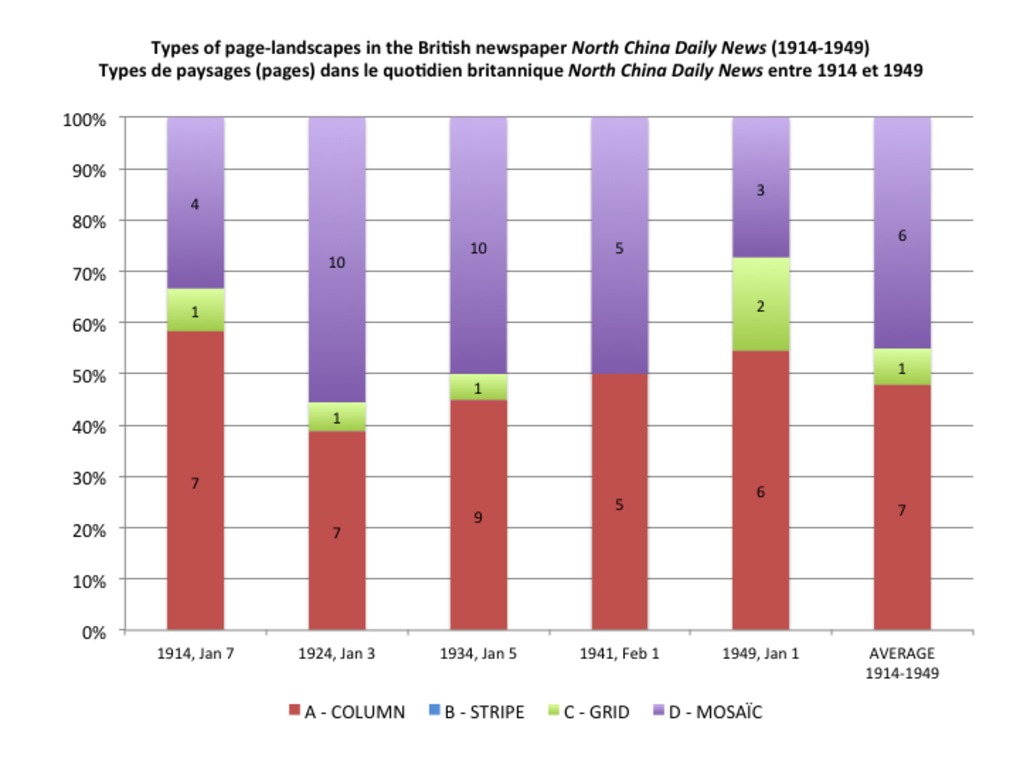 | 247 | Types of page-landscapes in the British newspaper North China Daily News (1914-1949) | Evolution des paysages (types de pages) dans le quotidien britannique North China Daily News entre 1914 et 1949 Cette succession d'histogramme mesurent l'importance relative de chaque type de page dans le quotidien britannique North China Daily News, et leur évolution au cours du temps entre 1914 et 1949. Les mesures ont été réalisées à partir des cinq mêmes échantillons que pour le quotidien chinois Shenbao : 7 janvier 1914 (14p), 3 janvier 1924 (22p), 5 janvier 1934 (32 p), 1er février 1941 (14p), 1er janvier 1949 (14p). L'axe des ordonnées indique le nombre de pages, l'axe des abscisses sert de ligne du temps. A chaque type est associée une couleur : rouge pour la colonne verticale (type A), bleu pour la bande horizontale (B), vert pour la grille/quadrillage (C), violet pour la mosaïque (D). Types of page-landscapes in the British newspaper North China Daily News (1914-1949) This set of bar charts aims to measure the proportion of the various types of pages in the five usual samples of the Shanghai-based British newspaper North China Daily News (January 7, 1914; January 3, 1924; January 5, 1934; February 1, 1941; January 1, 1949), according to the same typology and color code as used for the Chinese newspaper Shenbao: vertical column-style (A), horizontal stripe-style (B), grid (C), mosaïc/atchwork (D). In order to facilitate comparisons, we have used the same typology and color code as for the Chinese newspaper Shenbao: vertical column-style (A, red), horizontal stripe-style (B, blue), grid (C, green), mosaïc/patchwork (D, purple).
|
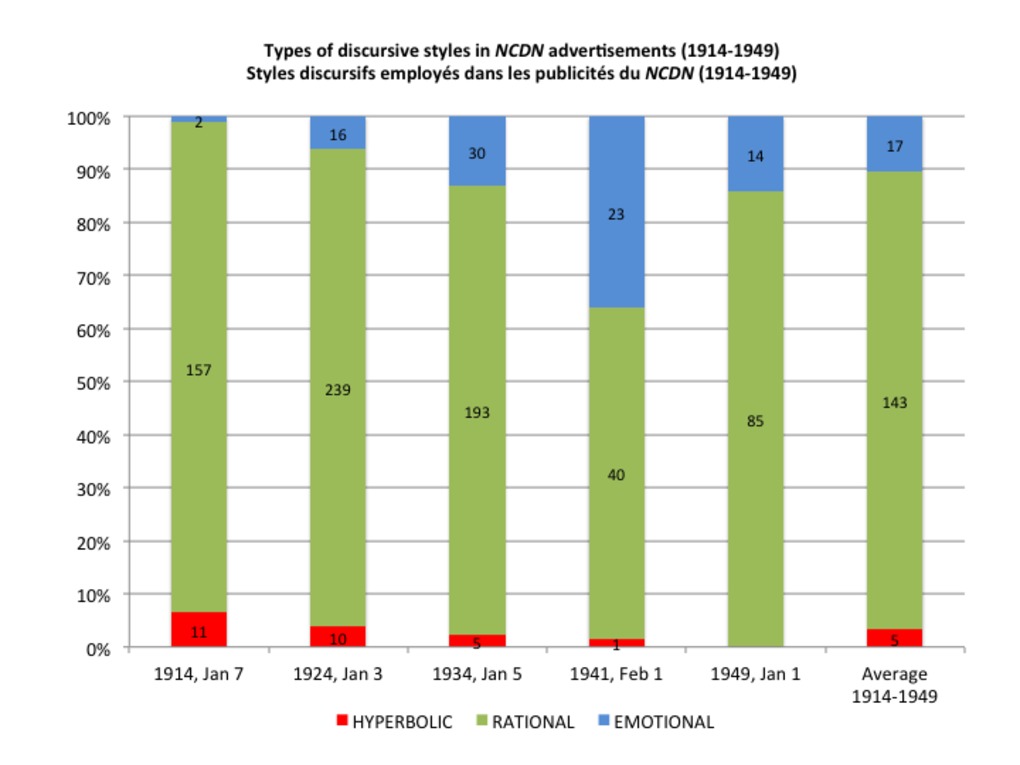 | 249 | Types of discursive styles in the British newspaper North China Daily News advertisements (1914-1949) | This set of six bar charts measure the relative importance of the three main types of discursive styles (or "ages") used in the advertisements published in the Shanghai-based British newspaper North China Daily News. For consistency reasons, the measurements have been made in the samples as used for the Chinese newspaper Shenbao: January 7, 1914; January 3, 1924; January 5, 1934; February 1, 1941; January 1, 1949. In order to facilitate comparisons, we have also used the same typology and color color as for the Shenbao. |
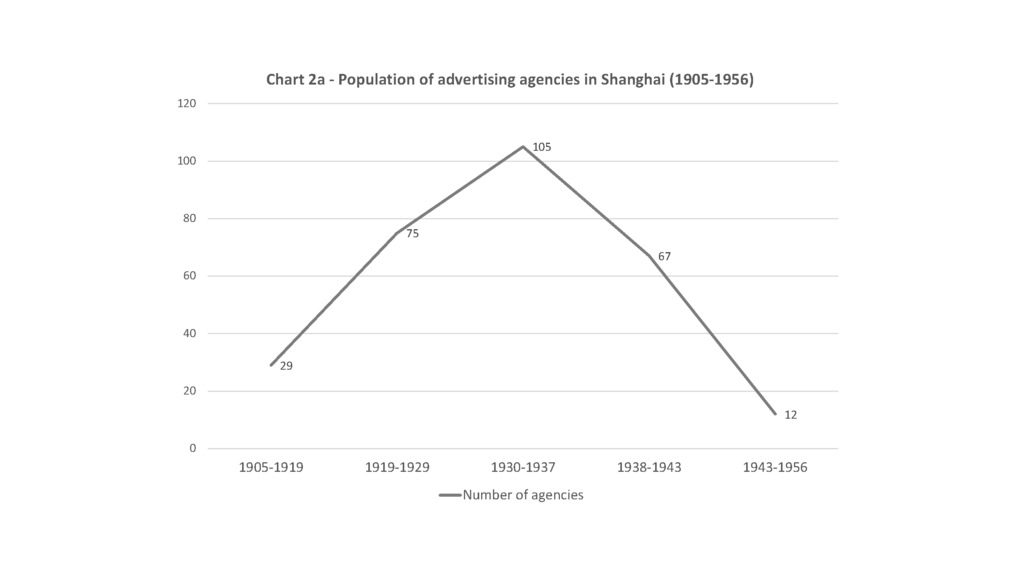 | 316 | Total population of advertising agencies in modern Shanghai | Graph showing the general increase in the total population of advertising agencies in Shanghai, especially during the 1930s decade. Source: Banker’s Directory (1935), Hong List (1941), SMA. |
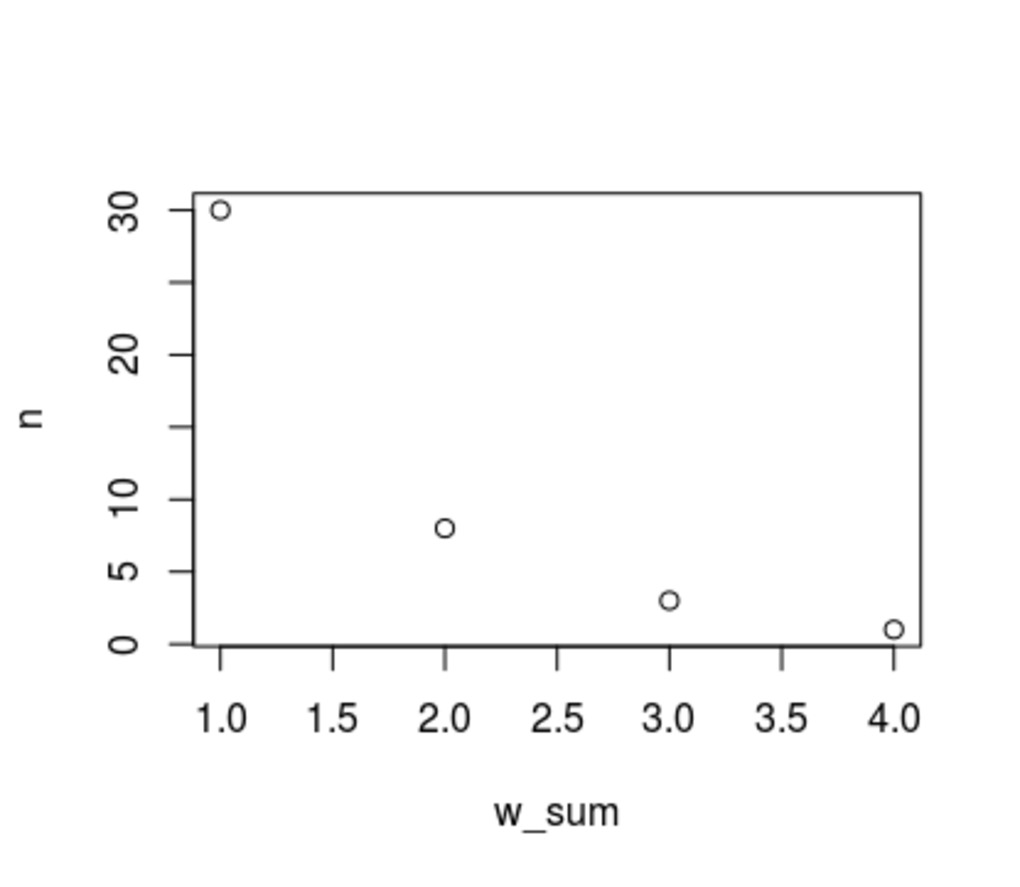
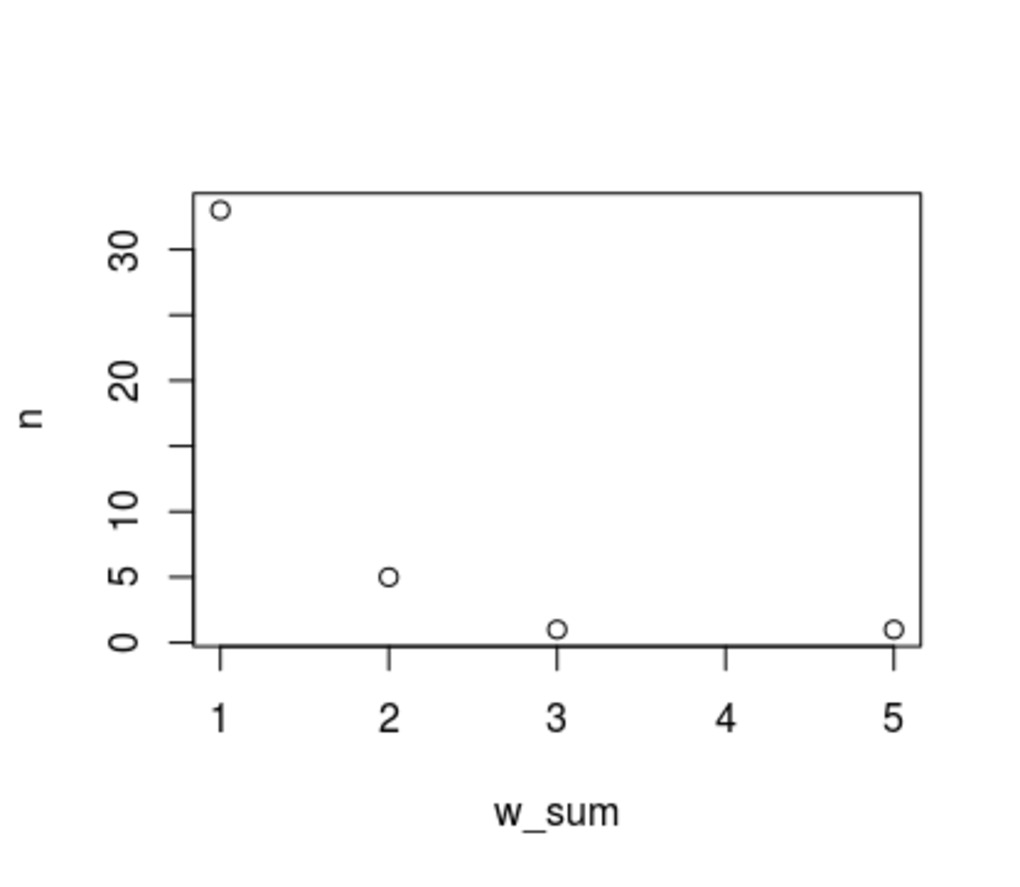
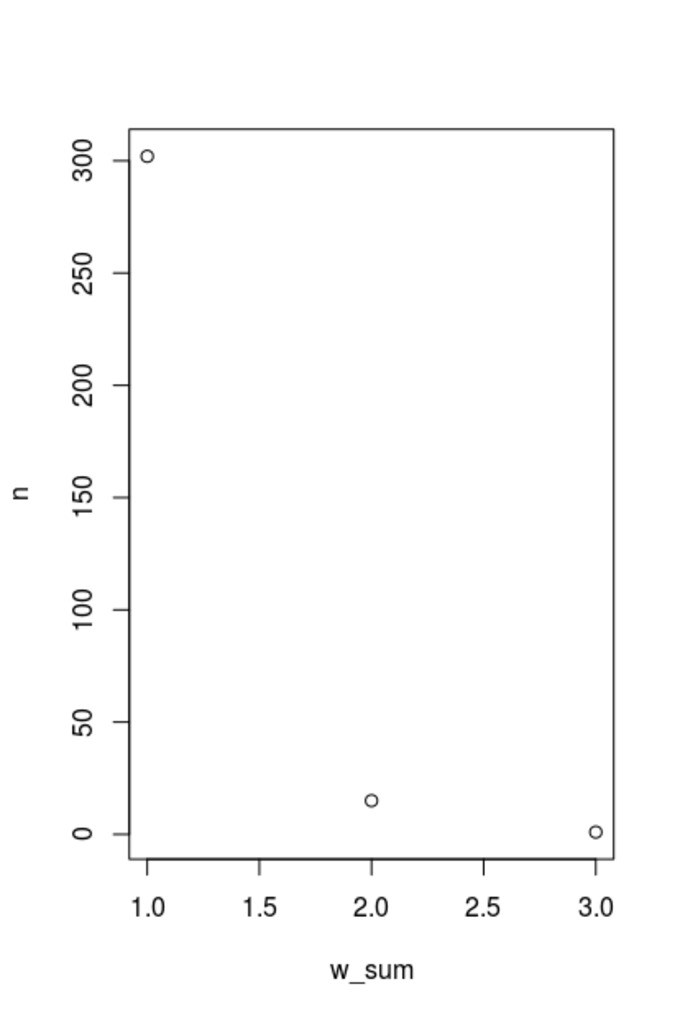 | 338 | Tie weight distribution in one-mode networks of co-attendance at meetings of the Shanghai Rotary Club ("sum" method) | This sets of three graphs compare tie weight distribution in the three one-mode networks of co-attendance at the meetings of the Shanghai Rotary Club under President Petit's (1919-20), Fitch's (1930-1) and Harkson's (1938-9) terms. In this network, nodes represent participants (persons who attended meetings), whereas edges represents events. Any edge links two persons who participate in the same events. Tie weight measures how frequently two persons co-participate in meetings. This series of graphs is based on the “sum” method. 1 means that persons met only once, 2 that they attend twice the same meeting, 3 three times, and so on. Unsurprisingly, there is a reversely proportional relation between tie weight (number of events co-attended) and number of dyads (co-attending pairs). Those who met regularly are the least frequent. Conversely, pairs who met only once are the most frequent. The first graph refers to Petit's network, the second to Fitch's and the last one to Harkson's. The original datasets and the resulting graphs are available in the "Tables" and "Trees" section, respectively. We used the R package "dplyr" to make these graphs.
|
 | 339 | Tie weight distribution in one-mode networks of multiple role-holding at meetings of the Shanghai Rotary Club | This sets of three graphs compare tie weight distribution in the three one-mode networks of multiple attendance at the meetings of the Shanghai Rotary Club under President Petit's (1919-20), Fitch's (1930-1) and Harkson's (1938-9) terms. In this network, nodes represent social roles (role types) performed by participants during club meetings, whereas edges represent persons holding multiple roles. Any edge links two roles performed by the same person. The absence of ties reflects incompatible roles. Tie weight expresses the most frequent combinations of roles (using the “sum” method). The original datasets and the resulting graphs are available in the "Tables" and "Trees" section, respectively. We used the R package "dplyr" to make these graphs.
|
 | 340 | Tie weight distribution in one-mode networks of multiple attendance at meetings of the Shanghai Rotary Club | This sets of three graphs compare tie weight distribution in the three one-mode networks of multiple attendance at the meetings of the Shanghai Rotary Club under President Petit's (1919-20), Fitch's (1930-1) and Harkson's (1938-9) terms. In this network, nodes represent events (club meetings), whereas edges represents the attendees they have in common. Any edge links two events who share participants. The absence of ties reflects events that have no participants in common. Tie weight expresses the number of multiple participants (using the “sum” method). The original datasets and the resulting graphs are available in the "Tables" and "Trees" section, respectively. We used the R package "dplyr" to make these graphs. Unsurprisingly, there is a reversely proportional relation between tie weight (number of shared participants) and number of dyads (events that share participants). Those who shared many participants are the least frequent. Conversely, events that have only one participant in common are the most frequent. |
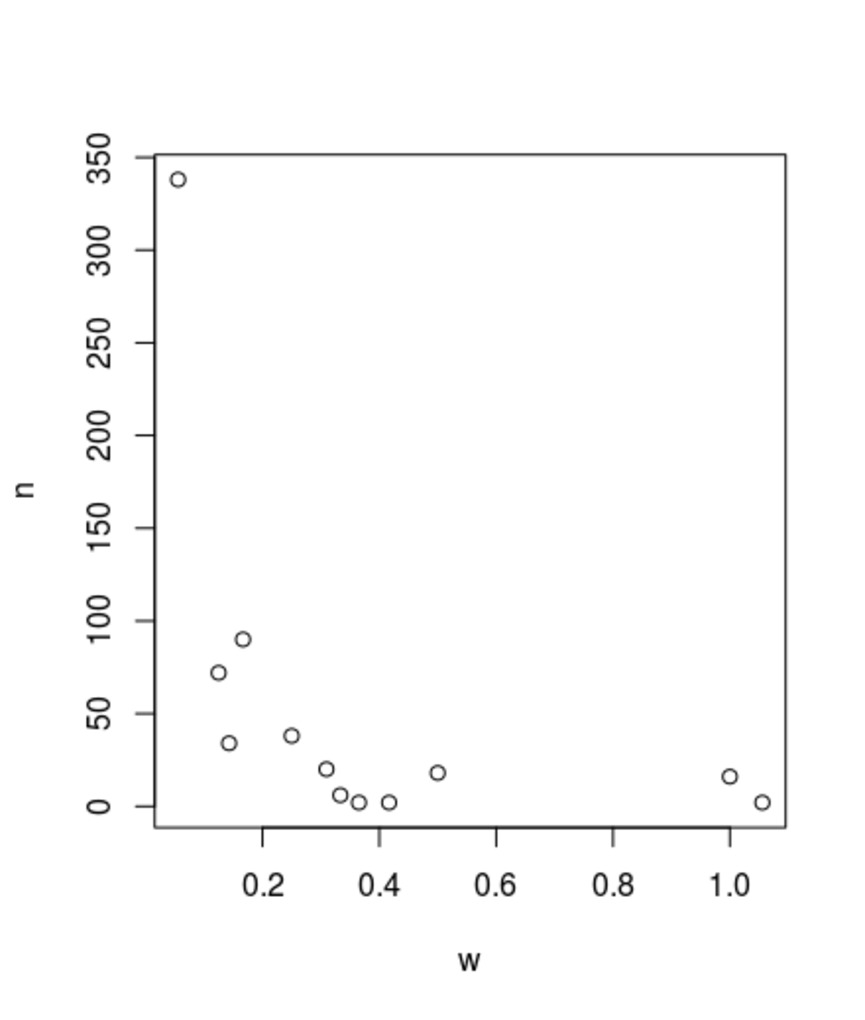 | 341 | Tie weight distribution in one-mode networks of co-attendance at meetings of the Shanghai Rotary Club (Newman's method) | This sets of three graphs compare tie weight distribution in the three one-mode networks of co-attendance at the meetings of the Shanghai Rotary Club under President Petit's (1919-20), Fitch's (1930-1) and Harkson's (1938-9) terms. In this network, nodes represent participants (persons who attended meetings), whereas edges represents events. Any edge links two persons who participate in the same events. Tie weight measures how frequently two persons co-participate in meetings. This series of three graphs is based on Newman's method, which presents the advantage of rectifying the negative effects of size variation – by discounting most important events that are more likely to be attended than smaller events, and key officers that are more likely to attend compared to less active members, occasional guests and visitors. The first graph refers to Petit's network, the second to Fitch's and the last one to Harkson's. The original datasets and the resulting graphs are available in the "Tables" and "Trees" section, respectively. We used the R package "dplyr" to make these graphs.
|
 | 380 | Time series of membership at the Shanghai Rotary Club | Based on the following dataset, the attached time series trace the evolution of membership at the Rotary Club of Shanghai over the period May 1920-September 1935 (inclusive).
|
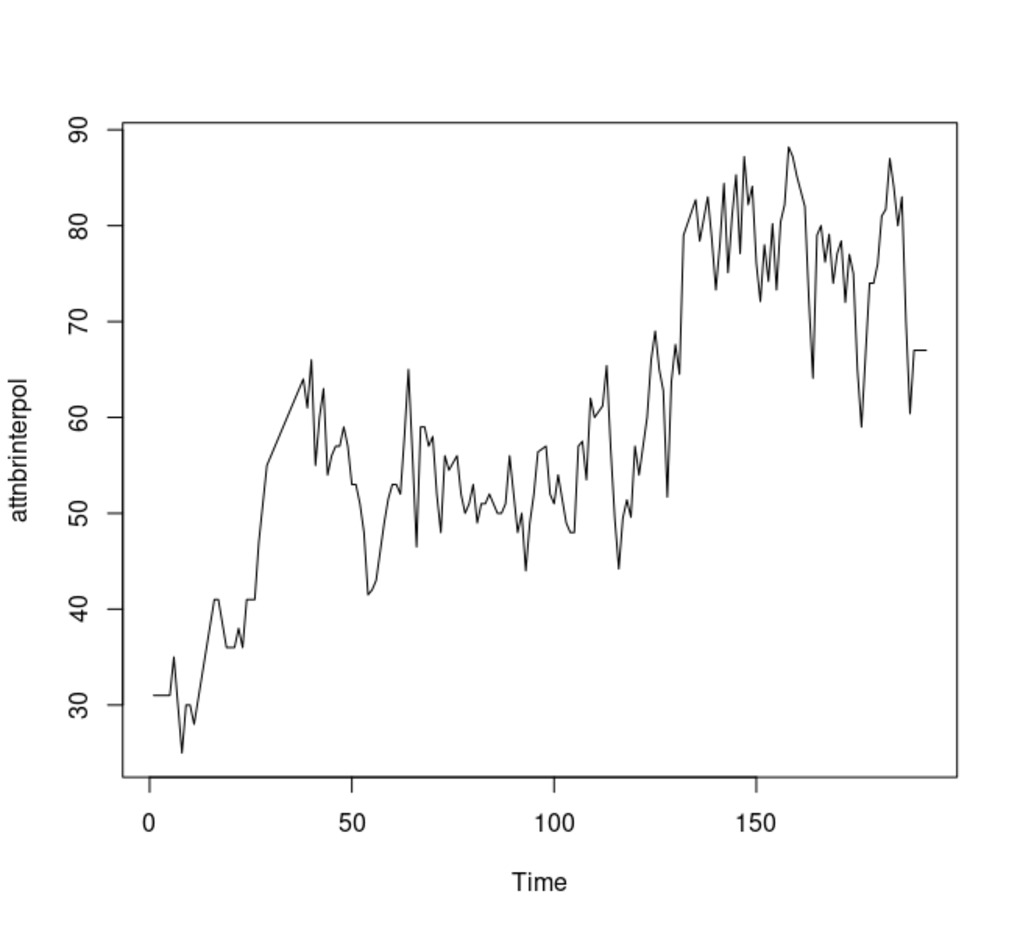
 | 381 | Time series of attendance percentage at the Shanghai Rotary Club | Based on the following dataset, the attached time series trace the evolution of attendance percentage at the Rotary Club of Shanghai over the period May 1920-September 1935 (inclusive).
NB Since the attendance time series cannot be described as an additive model, it was not possible to decompose it. |
 | 382 | Time series of attendance at the Shanghai Rotary Club | Based on the following dataset, the attached time series trace the evolution of attendance (number of attendees) at the Rotary Club of Shanghai over the period May 1920-September 1935 (inclusive).
NB Since the attendance time series cannot be described as an additive model, it was not possible to decompose it. |
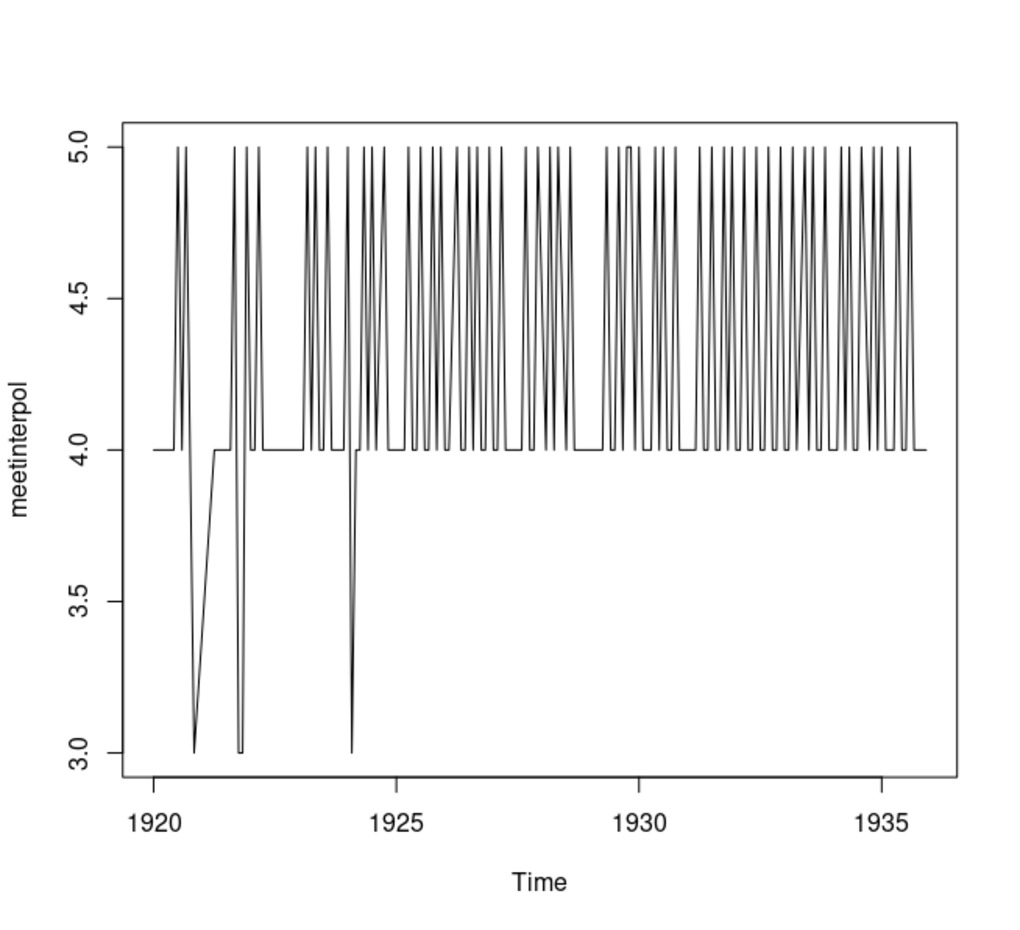 | 383 | Time series of meetings at the Shanghai Rotary Club | Based on the following dataset, the attached time series trace the evolution of meetings (monthly number of meetings per year) at the Rotary Club of Shanghai over the period May 1920-September 1935 (inclusive).
|
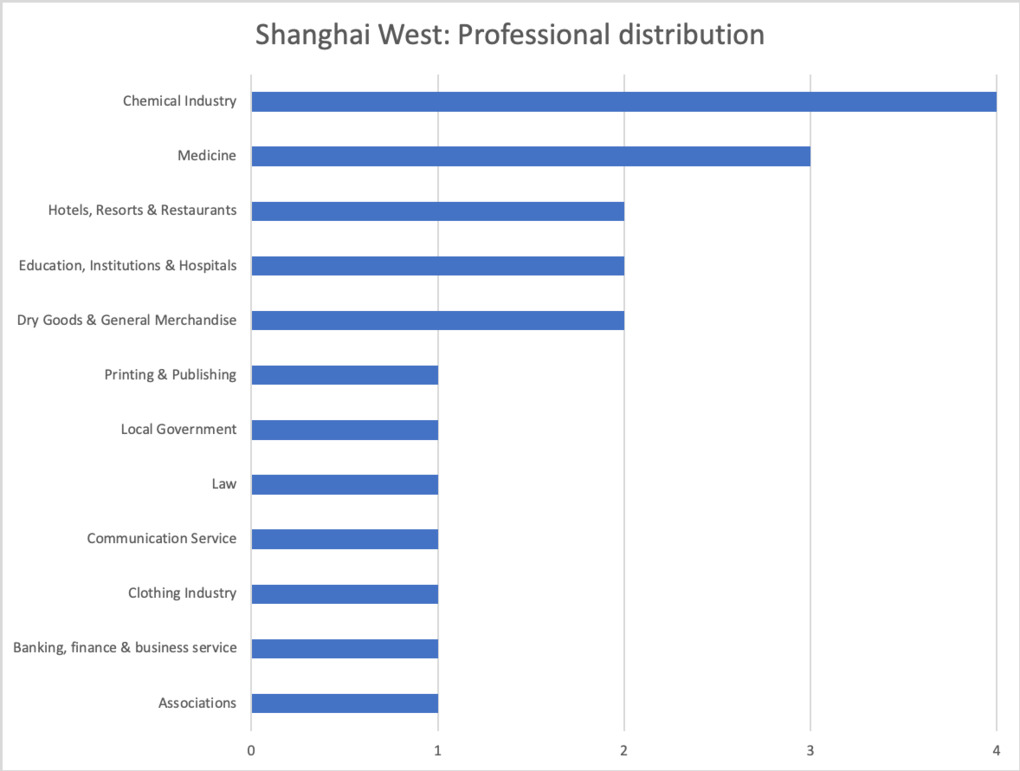 | 388 | The Rotary Club of Shanghai West: Classification of members | The attached graphs offer various ways of visualizing the professional distribution of Chinese members of the Rotary Club of Shanghai West (Chinese speaking-speaking club established in 1948 in parallel to the original Rotary Club of Shanghai). Our analysis is based on a simplified version of the standard classification of professions devised by Rotary International in the early 1920s. Data comes from the membership lists available in the Archives of Rotary International, Evanston, Ill. The tables used for building the graphs are available in the "Tables" Section. The graphs reveals that the professional distribution of members was very similar to that of the Rotary Club of Shanghai. Chemical industry and medicine ranked first, followed by general merchandising, education, and tourism, also important sectors in the English-speaking club. Some professional groups that were prominent among Shanghai Rotarians, however, went missing in the Chinese-speaking club, namely cotton and silk industries, building and construction, machinery equipment and recreational services. Despite these slight differences, however, the postwar club of Shanghai West did not differ much from its foreign counterpart. |
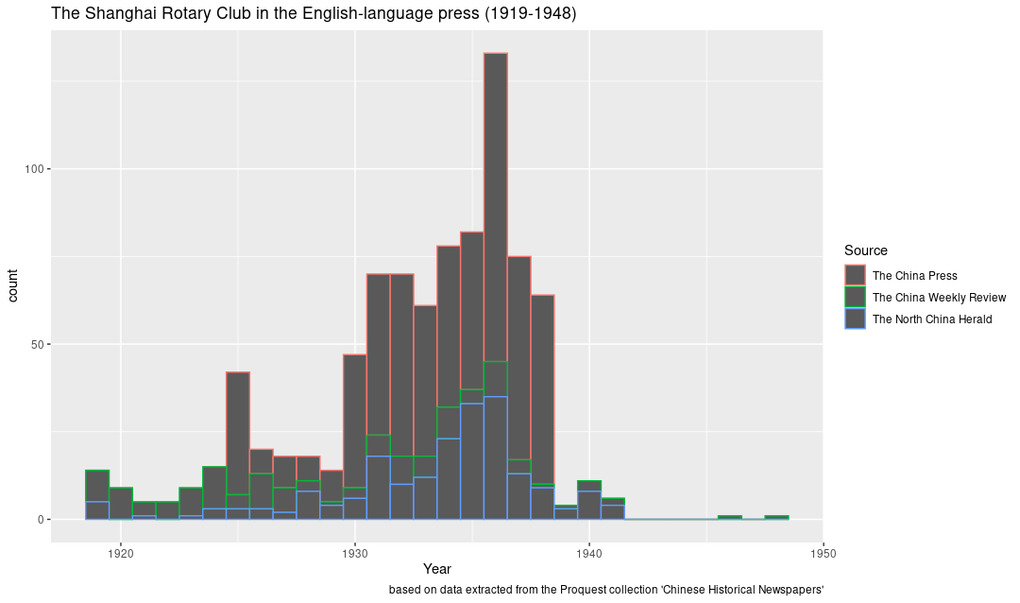 | 403 | The Shanghai Rotary Club in the press | The following graphs provides basic information on the press corpus we built for analyzing the presence of the Rotary Club of Shanghai in the local press. The tabulated data we used for building the graphs is available in the "Tables" section. The first bar chart summarizes the most important information related to the corpus (documents and distribution across newspapers over time). The two next graphs show the number of occurrences (words or bags of words) and documents (articles) that mention the Rotary Club of Shanghai in the press, while the remaining ones examine in more detail the distribution of ocurrences and documents (articles) across the three major English-language newspapers. Built by combining two sets of keywords ("Shanghai Rotary Club" and "The Rotary Club of Shanghai"), this corpus contains all the press articles that mention the Rotary Club of Shanghai in three major English-language newspapers: North-China Herald, Millard's Review (and its successor China Weekly/Monthly Review), and China Press. We selected these newspapers because they are the ones that best publicized the activities of the club and enjoyed an appreciable continuity of publication. We also selected them because they are easily accessible in digital format on the ProQuest collection of Chinese newspapers, which makes them processable for large-scale analyses. For building the corpus, we used the R Studio package “enpchina” developed by Pierre Magistry, our computational linguist in the European Research Council (ERC) Project “Elites, networks and power modern China". This package was specifically tailored for the ProQuest collection of Chinese newspapers. Drawing on Natural Language Processing (NLP) techniques, this package offers a set of advanced tools for exploring large corpora of historical newspapers, especially complex queries, statistical analysis, extraction of name entities, network analysis and graph visualization. The keywords were carefully selected so as to reduce noise deriving from the fuzzy meaning of the word “rotary” (which literally means “wheel” or “mill”) and to remove articles dealing with Rotary clubs outside of Shanghai. Based on this query, we obtained a corpus of 949 occurrences distributed across 865 documents (articles) and six different publications (mostly three: China Press, China Weekly Review, North-China Herald), ranging from 1919 to 1948, with a peak in 1936.
|
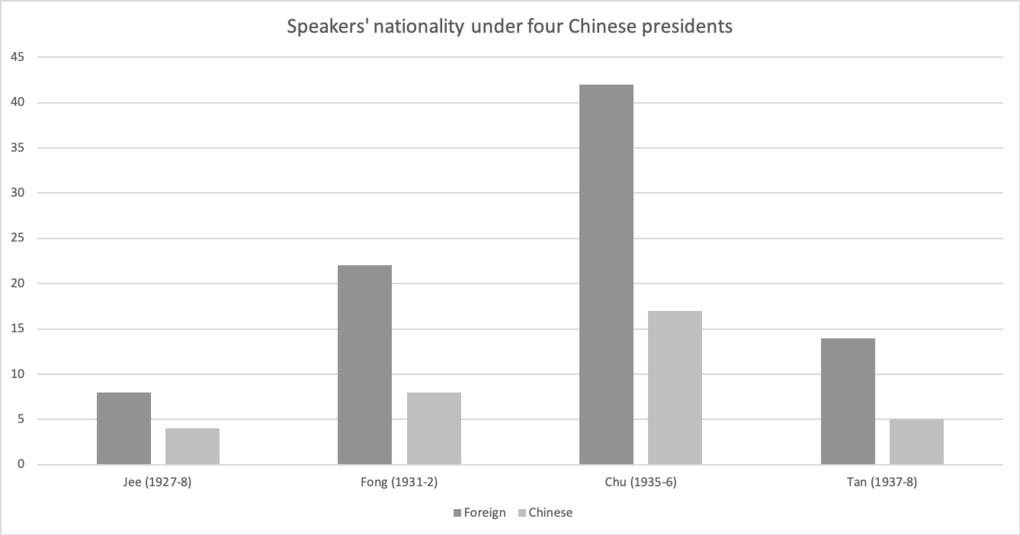 | 405 | The Rotary Club of Shanghai: Program of meetings under Chinese leadership | The following graphs aim to examine whether the program of the Rotary Club of Shanghai was given more "Chinese flavor" while Chinese members took leadership positions in the club. We defined two main criteria for gauging the "Chineseness" of the program: the nature of events and the nationality of speakers invited at regular meetings. We also analyzed the topic of lectures in connection with speakers’ nationality and affiliation. We extracted the original information from press reports of meetings in three major local newspapers (North-China Herald, China Weekly Review, China Press). The tabulated data we used for conducting these analyses are available in the "Tables" Section. The two first graphs show the distribution between Chinese and foreign speakers under four Chinese presidents - L.M. Jee (1927-8), Fong Sec (1931-2), Percy Chu (1934-5), and W.H. Tan (1937-8) - and under Lee's chairmanship of the program committee (1934-6), respectively. The third graph shows the distribution of topics among Chinese and foreign speakers, while the last one examines their institutional affiliation. From these analyses we can draw four major conclusions:
In the end, efforts to sinicize the club program proved insufficient as long as English remained the dominant language and as organizers continued to rely on their network of overwhelming foreign connections. |


- RAW DATA
- COOKED DATA
- NARRATIVES
- REFERENCES
- DATABASES
31 documents
return to data set
Contact us
Cécile Armand Institut d'Asie Orientale ENS de Lyon, Site Descartes 15 Parvis René Descartes 69341 Lyon Cedex 07 France Email: cecile.armand@gmail.com
Around the Web
![]()
![]()
![]()