


| ID | Title | Description | |
|---|---|---|---|
 | 203 | Measuring the “visual turn” in Shenbao advertising (1914-1949) | This set of pie charts is an attempt to evaluate the so-called "visual turn" which obsesses quite a number of scholars dealing with advertising today. Though such a "visual turn" was in a way advocated by professionals at the time, it should not be over estimated, and above all, it should not be used to support anachronistic assumptions. To evaluate the actual importance of the "visual turn" in Shenbao advertisements from 1914 to 1949, it is first necessary to define precisely what we mean by "visual". Thus seven "visual devices" have been identified, each one associated to a given color: image of the product/package (red), illustrated situation/life scene (green), trademark/logo (yellow), border/frame (blue), typography/punctuation, line/orientation/composition (orange) and colors/contrasts (grey). The proportion of each device was then measured in the "model" advertisements extracted from our usual five samples of the Shenbao (January 7, 1914; January 3, 1924; January 5, 1934; February 1, 1941; January 1, 1949). The fifth pie charts reveal that paradoxically, the share of figurative images (package or situation) tend to stagnate or even decline across time, at least until 1941 : from 23% in 1914 to 9% in 1941 for images of the package, from 10% in 1914 to 15% (1949) for illustrations. The costs of production of sophisticated images may have forced advertisers to turn towards cheaper visual devices, such as plays on typography (32-34% in 1914-1924, 19% in 1934 and still 10% in 1949), black/white contrasts (from 5% in 1914 to 34% in 1941, still 18% in 1949), borders/frames (from 15% in 1914 to about 30% in 1949, which also reveals an increased competition) and to a lesser extent, lines and composition (average of 5%). The use of trademarks/logos remains quite stable during the whole period (around 10%, after falling to 2% in 1934). |
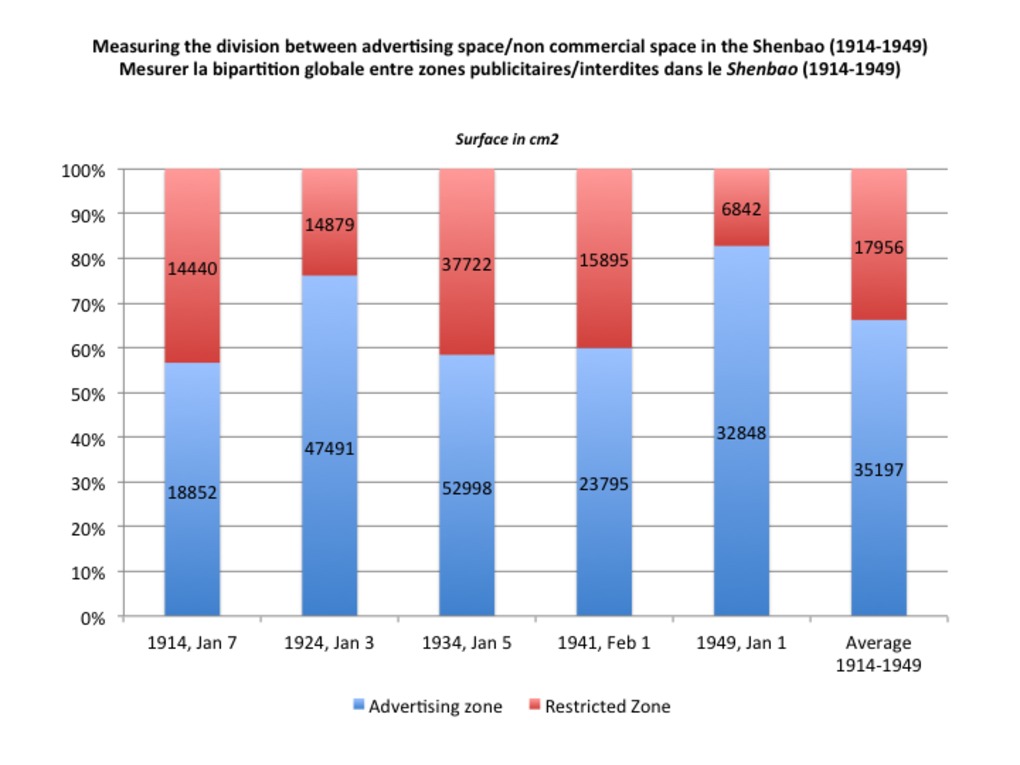 | 207 | Measuring the division between advertising space/non commercial space in the Chinese newspaper Shenbao between 1914 and 1949 (close reading/quantitative approach) | Ces histogrammes montrent la répartition de l'espace du journal entre espace publicitaire/zone autorisée (en bleu) et contenus non commerciaux/zone interdite de publicité (en rouge) dans nos cinq échantillons habituels du Shenbao : 7 janvier 1914, 3 janvier 1924, 5 janvier 1934, 1er février 1941, 1er janvier 1949. La démarche s'inspire directement de l'étude conduite par deux chercheurs de Qinghua dans cinq quotidiens chinois en décembre 1923 (Source: “An Analytical Study of Advertisements in Chinese Newspapers”. Chinese Economic Monthly (CEM). April 1926. Vol. III, No. 4, p.139-143). Bénéficiant du cumul d’expériences, on s’est appuyé sur les modèles d’aires publicitaires élaborés dans le premier chapitre : la somme des surfaces publicitaires individuelles sur une page donnée ou dans un numéro donné permet ainsi d’obtenir facilement la surface publicitaire totale sur la page ou dans le numéro en question. On rappelle qu'à défaut d’avoir accès aux originaux, les mesures ont été réalisées à partir des numérisations, toutes placées à la même échelle. On a ensuite calculé la surface effectivement occupée en rapportant ces chiffres fictifs aux données dont on dispose sur les dimensions réelles du journal entre 1872 et 1949 : http://madspace.org/cooked/Tables?ID=108, http://madspace.org/cooked/Drawings?ID=101, http://madspace.org/cooked/Drawings?ID=102. Rough English translation These bar charts measure the division between advertising space (blue)/non commercial space (red) in the newspaper Shenbao between 1914 and 1949. The measurements were made from our usual samples of the Shenbao: January 7, 1914; January 3, 1924; January 5, 1934; February 1, 1941; January 1, 1949. The method was inspired by a contemporary study of newspaper advertising conducted in 1923 and published in the Chinese Economic Monthly in 1926 (source: “An Analytical Study of Advertisements in Chinese Newspapers”. Chinese Economic Monthly (CEM). April 1926. Vol. III, No. 4, p.139-143). |
 | 209 | Measuring advertising areas in the newspaper Shenbao (1914-1949) | Rough English translation This bar charts charts aim to measure the relative importance of various advertising areas in our five usual samples of the newspaper Shenbao: Jan 7, 1914 ; Jan 3, 1924 ; Jan 5, 1934 ; Feb 1, 1941 ; Jan 1, 1949. Borrowing the vocabulary from urban/political geography, four types of advertising areas has been identified, from the smallest to the largest, each one associated to a distinct color and number :
By juxtaposing the five bar charts, one can trace the changes in the sizes of advertising areas between 1914 and 1949. |
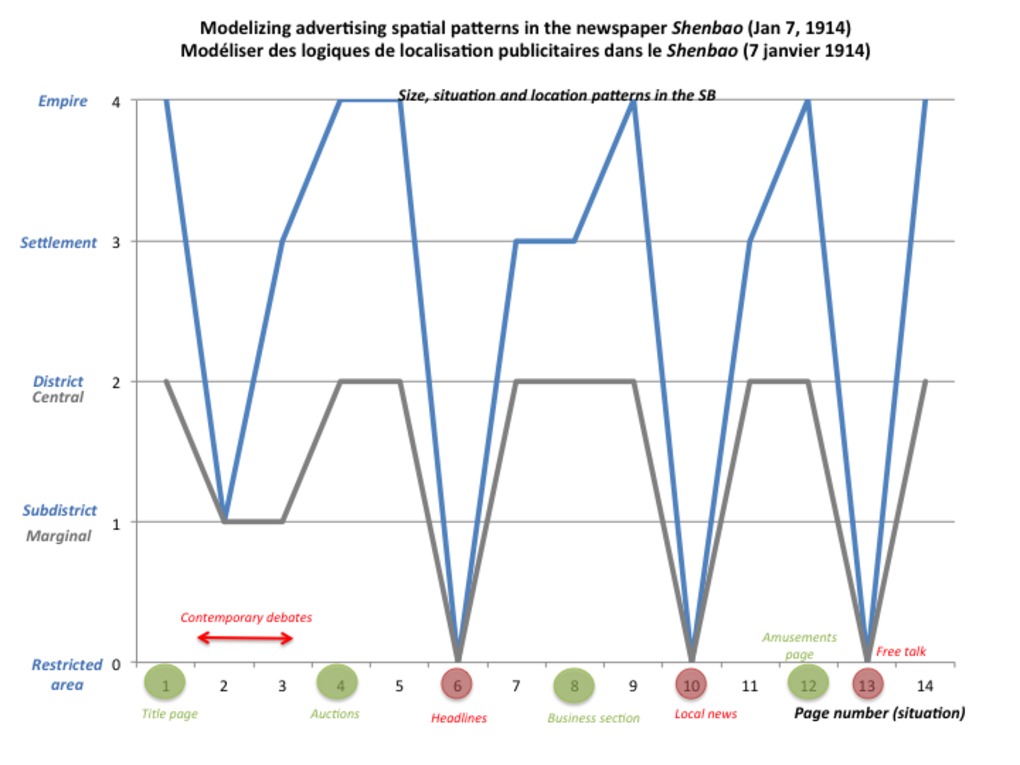 | 215 | Modelizing advertising spatial patterns in the newspaper Shenbao: an essay to correlate area, situation and page location in the newspaper Shenbao (1914-1949) | This set of five graphs offers a synthetical view of the previous analyses made from our five usual samples of the newspaper Shenbao (Jan 7, 1914 ; Jan 3, 1924 ; Jan 5, 1934 ; Feb 1, 1941 ; Jan 1, 1949). Each graph aims to modelize advertising zones in each sample issue by correlating the three criteria previously measured (area, situation, page location). For that very purpose, we have recycled the number and color code used for previous analyses. The "X" axis indicates page numbers (situation), while the "Y axis" is used to measure areas as well as page location. The ultimate goal of this modelizing essay is to reveal spatio-temporal patterns and to re-conciliate quantitative/qualitatve approaches of advertising spaces in the newspaper Shenbao. By juxtaposing the five graphs, one can trace changes in the newspaper advertising geography between 1914-1949.
|
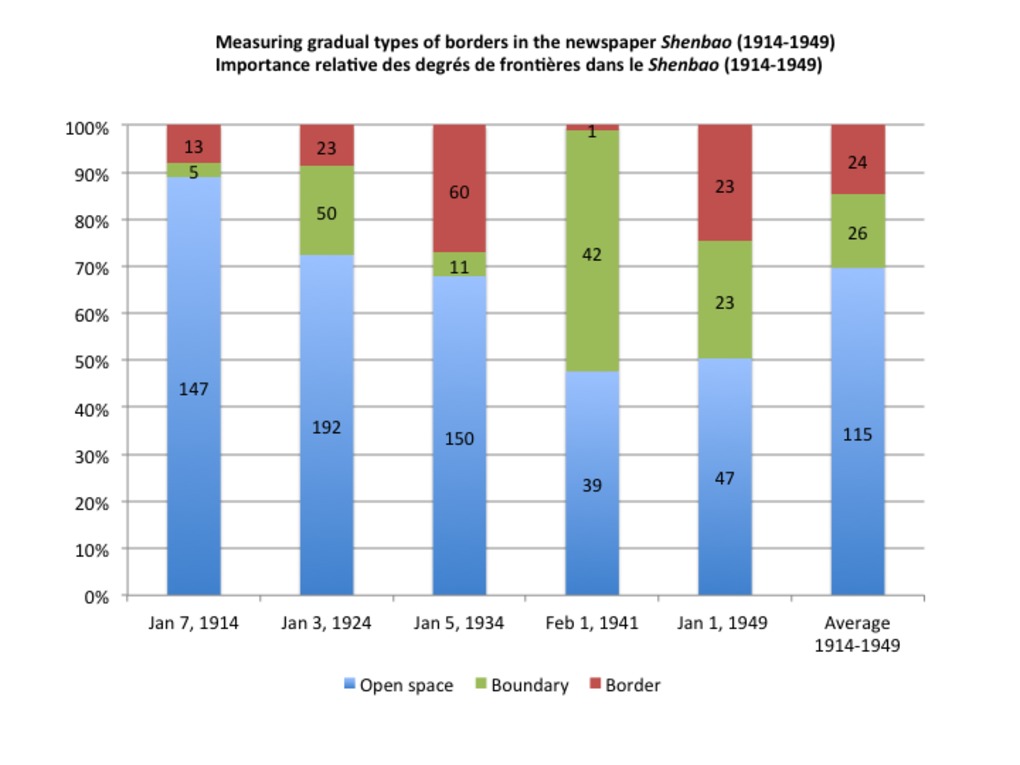
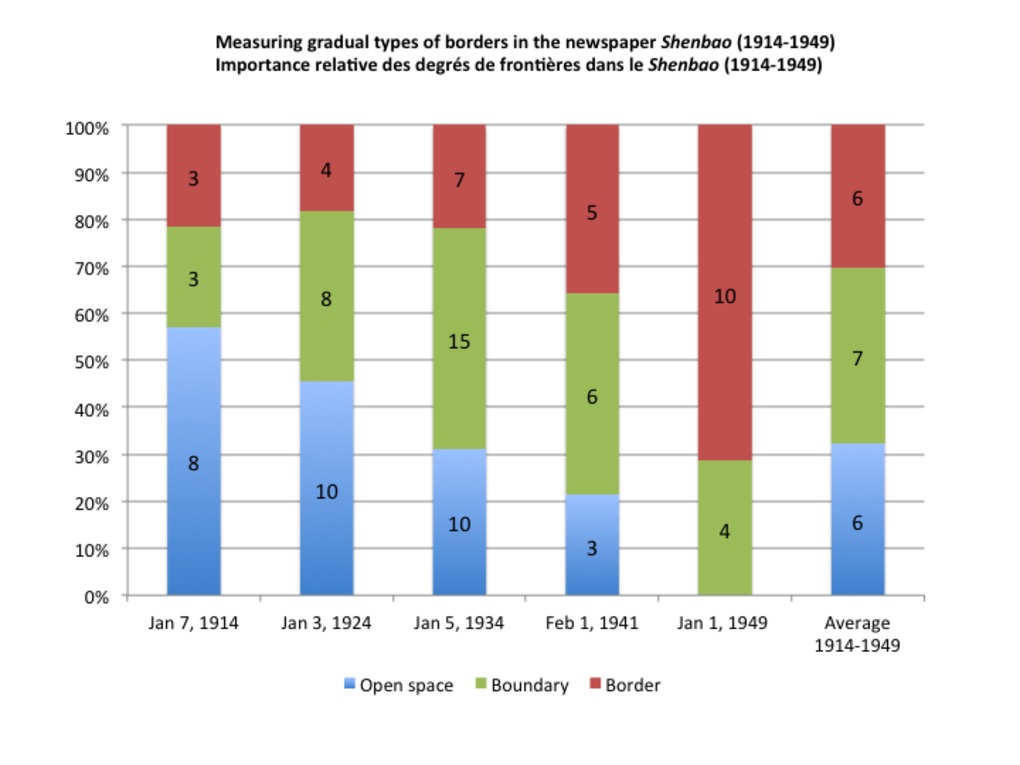 | 216 | Measuring the relative importance of gradual types of borders in the newspaper Shenbao (1914-1949) | This set of bar charts aims to measure the relative importance of the three main types of borders identified in the newspaper Shenbao between 1914-1949, each one associated to a given number and color:
This gradual typology was freely inspired by E. Casey in his reply to P. Ethington's project of "Placing history". Source: Casey, Edward, ‘Boundary, Place, and Event in the Spatiality of History’, Rethinking History, 11 (2007), 507–12. We have only counted the dominant type of border on each page. For an illustrated or more embodied version of this typology, see: http://madspace.org/cooked/Drawings?ID=119. The measurements were made in our five usual samples of the newspaper Shenbao (Jan 7, 1914 ; Jan 3, 1924 ; Jan 5, 1934 ; Feb 1, 1941 ; Jan 1, 1949). |
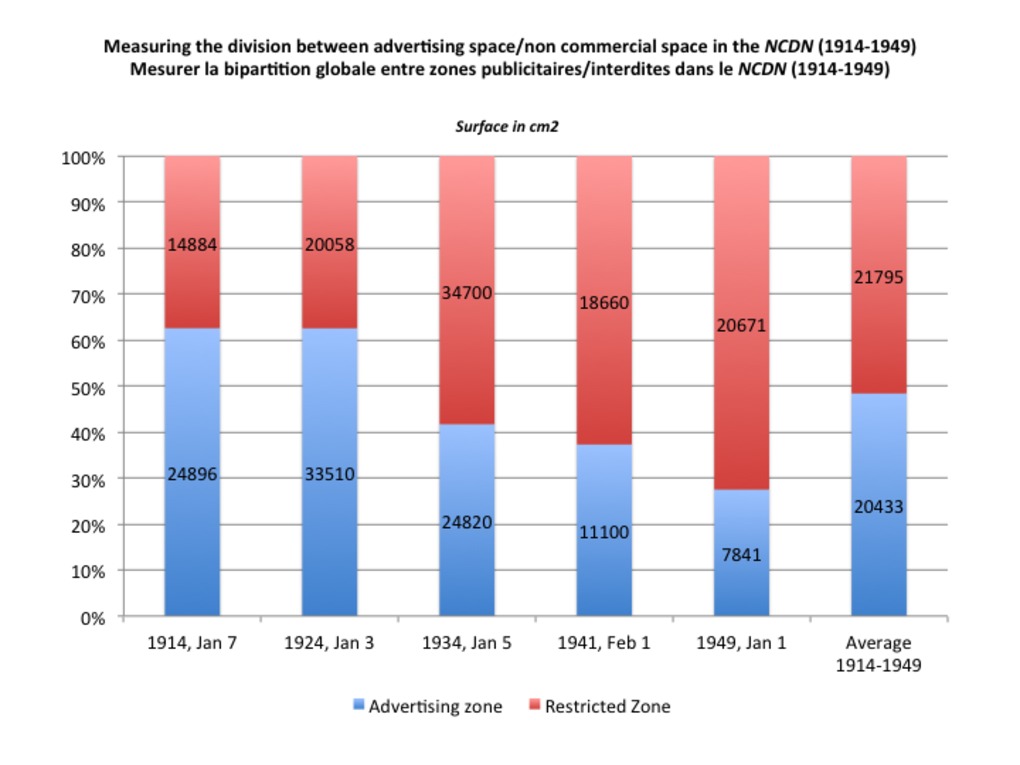 | 242 | Measuring the division between advertising space/non commercial space in the British newspaper North China Daily News between 1914 and 1949 (close reading/quantitative approach) | Ces histogrammes montrent la répartition de l'espace du journal entre espace publicitaire/zone autorisée (en bleu) et contenus non commerciaux/zone interdite de publicité (en rouge) dans le quotidien britannique North China Daily News. Par souci de cohérence, on s'est appuyé sur les cinq mêmes échantillons que pour le Shenbao : 7 janvier 1914, 3 janvier 1924, 5 janvier 1934, 1er février 1941, 1er janvier 1949. La démarche s'inspire directement de l'étude conduite par deux chercheurs de Qinghua dans cinq quotidiens chinois en décembre 1923 (Source: “An Analytical Study of Advertisements in Chinese Newspapers”. Chinese Economic Monthly (CEM). April 1926. Vol. III, No. 4, p.139-143). La structure relativement stable et "rationnelle" du quotidien britannique a simplifié la démarche par rapport au quotidien chinois. En effet, le groupement quasi géométrique des publicités permet d'évaluer facilement la surface publicitaire couverte sur chaque page, sans qu'il soit nécessaire d'additionner les surfaces individuelles. Rough English translation These bar charts measure the division between advertising space (blue)/non commercial space (red) in the Shanghai-based British newspaper North China Daily News between 1914 and 1949. For consistency reasons, the measurements were made after the same five samples as used for the Chinese newspaper Shenbao: January 7, 1914; January 3, 1924; January 5, 1934; February 1, 1941; January 1, 1949. The method was inspired by a contemporary study of newspaper advertising conducted in 1923 and published in the Chinese Economic Monthly in 1926 (source: “An Analytical Study of Advertisements in Chinese Newspapers”. Chinese Economic Monthly (CEM). April 1926. Vol. III, No. 4, p.139-143). |
 | 243 | Measuring the relative importance of gradual types of borders in the British newspaper North China Daily News (1914-1949) | This set of bar charts aims to measure the relative importance of the three main types of borders identified in the newspaper North China Daily News between 1914-1949, each one associated to a given number and color:
This gradual typology was freely inspired by E. Casey in his reply to P. Ethington's project of "Placing history". Source: Casey, Edward, ‘Boundary, Place, and Event in the Spatiality of History’, Rethinking History, 11 (2007), 507–12. We have only counted the dominant type of border on each page. For an illustrated or more embodied version of this typology, see: http://madspace.org/cooked/Drawings?ID=124. For consistency reasons, the measurements were made in the same five samples as used for the newspaper Shenbao (Jan 7, 1914 ; Jan 3, 1924 ; Jan 5, 1934 ; Feb 1, 1941 ; Jan 1, 1949). |
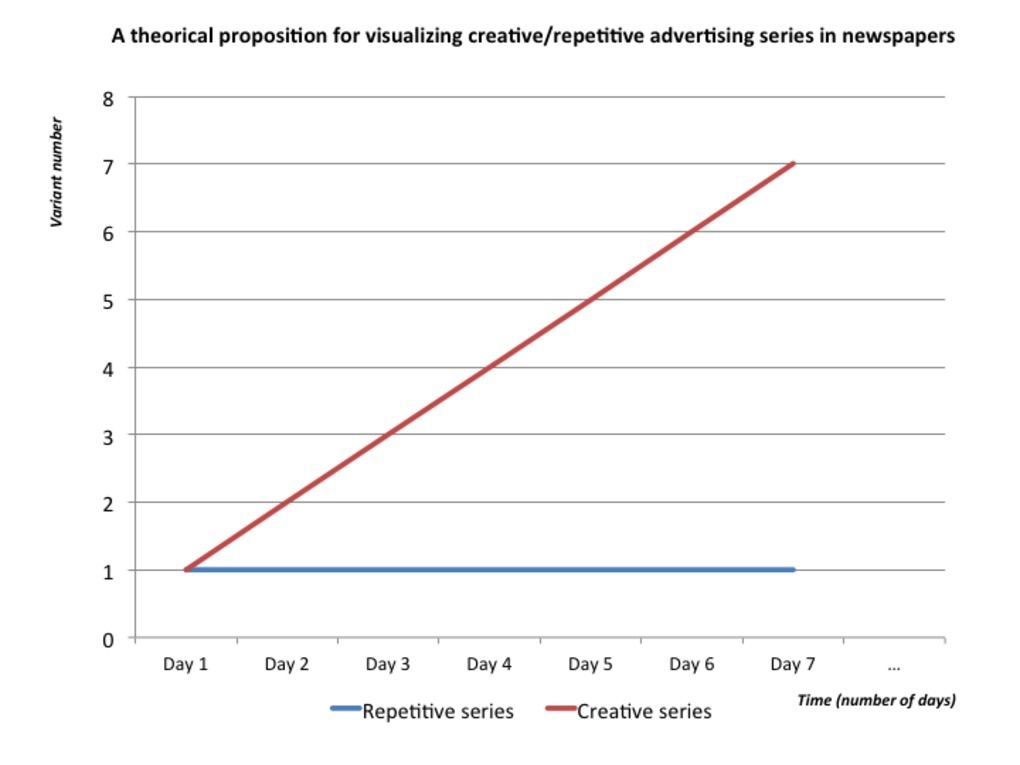 | 261 | Modelizing repetitive/creative advertising series in newspapers | This graph line offers a theoretical model for visualizing creative/repetitive advertising series in any newspaper - in Shanghai-based newspapers in particular. The model is quite simple. The "X" axis indicates time (numbers of day/day number), while the "Y" axis measures the number of variants in a given series of advertisements. Repetitive series are materialized by the blue flat line (only 1 variant during the entire period under consideration). Creative series may be materialized by the red ascending line. The most creative the series, the most numerous the variants, and the most dramatically climbing the line.
|
 | 266 | Millington, Ltd: Profit and loss accounts (1927-1941) | This graph shows the fluctuations of profits and loss accounts of one of the main Shanghai-based advertising agency Millington, Ltd from its founding in 1927 until 1941. The figures are based on reports from boards of directors and annual general meetings either published in the local press (China Press, North China Herald), or hold in the Shanghai Municipal Archives (SMA_Q275-1-1840). The graph reveals that after a period of rapid and spectacular growth (1927-1931), the company suffered from serious losses between 1932-1935), probably due to the war in Shanghai in 1932-1933 and the economic depression that followed. The firm's situation shortly improved in Spring 1935, at the cost of a drastic reduction of its capital. Millington, Ltd. went through hard times again in the wake the bombing of Shanghai in August 1937. The first semester of the year 1938 was said to be the worst time experienced by the company during its entire life. Yet it prompty recovered and eventually recorded the best profits ever known in its history at the last annual general meeting in 1941. This case study suggests that even the strongest companies in Shanghai might suffer from political and economic troubles at various scales - not only in Shanghai, but in China and the world, especially in the case of a worldwide-connected agency like Millington, Ltd. Yet, the impacts of political events and economic conjoncture on advertising business are far from being clear and simple to reveal and interpret. The impacts of events or crisis may be postponed and experienced at a more or less later time by the company. Moreover, other internal factors, related to the specific history of the company, may interefere. As far as Millington is concerned, the crisis in Shanghai may have been either counterbalanced, either aggravated, by the profits or losses made by other branches in Hongkong and Singapore. This graph finally suggests that war is not always or necessarily detrimental to the advertising business - quite the contrary. Although Millington Ltd seemed to suffer from the first war in Shanghai in 1932-1933, and immediately after the bombing in August 1937, the war period between 1938-1940 appeared to be the most profitable time for the company in its entire history. |
 | 268 | Millington’s investments in outdoor and indoor advertising (in $) (1929-1930) | This set of two graphs (pie charts and surface graph lines) shows the distribution and growth of Millington's investments in "indoor" (printed) and outdoor advertising (in $). The pie charts reveal a quite equal distribution between both types of advertising media. Though indoor advertising slighly dominated over outdoor advertising in 1929 (53%, almost 62000 $), outdoor advertising tended to take the advantage in 1930, both in ratio and amounts of money invested (52%, more than 100 000 $). |
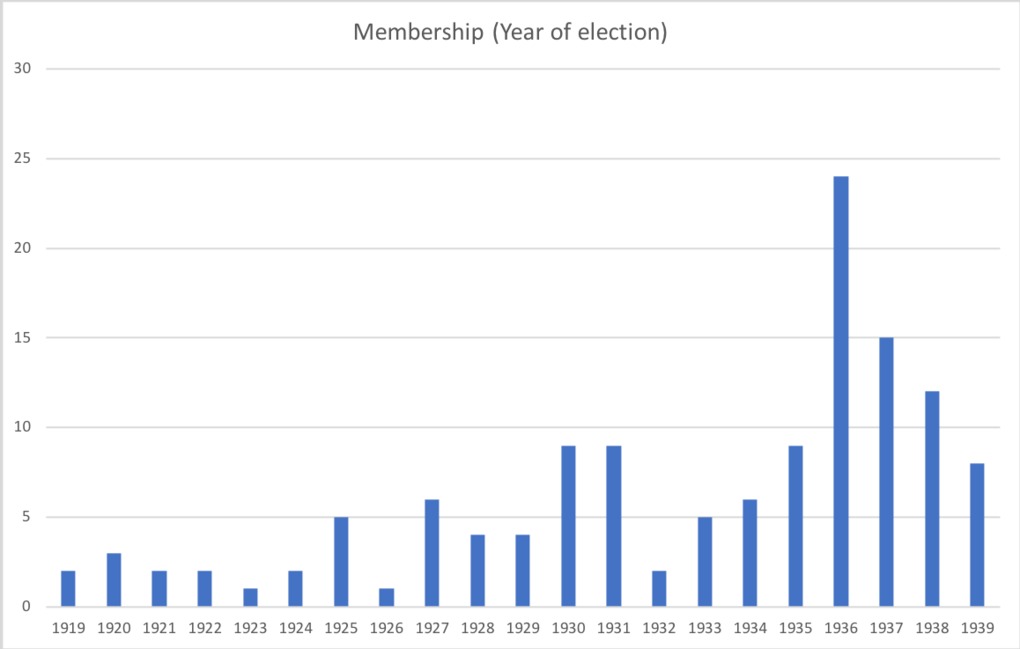 | 320 | Members of the Shanghai Rotary Club (year of election and nationality) | The following graphs shows the number and nationality of new members elected at the Shanghai Rotary Club each year between 1919 and 1939. They derive from the list of Rotarian members drawn after the Shanghai Rotary Club handbook (see table: http://madspace.org/cooked/Tables?ID=198). The first graph reveals a general increase in membership especially at the end of the period, with a peak in 1936 (almost three times the figure of 1935 and more than ten times that of 1919). The second graphs shows the distribution of members according to their nationality. It reveals that the Chinese form the most important group in the Club,(46, 38%), followed by Americans (31, 24%), British (15, 19%), French (6, 4,7%), Japanese and German (4 each) and other European minorities. The third graph shows the date of election by nationality. Originally new members were mostly American and British. Yet Chinese members were elected at a very early time (1920). Chinese membership reached a turning point after 1927 (coinciding with the integration of Chinese representatives within the Shanghai Municipal Council). The Rotary Club started to include German, Japanese, Russian and French members in 1927, 1929, 1930 and 1931, respectively. Then we observe a trend towards a diversification of membership. New European minorities (Swiss, Netherlands, Norwegian) became members only at the end of the period (after 1935). |
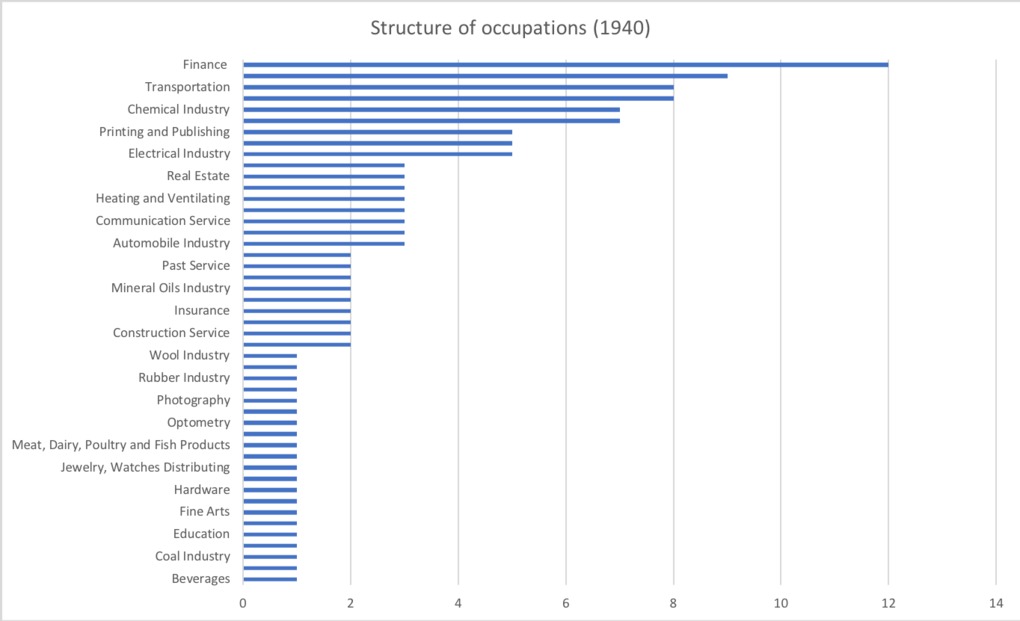 | 321 | Members of the Shanghai Rotary Club (occupations and socio-professional categories) | The following graphs shows the structure of occupations and socio-professional categories of Shanghai Rotarians between 1919 and 1939. They derive from the original list of members drawn after the Shanghai Rotary Club handbook (see table: http://madspace.org/cooked/Tables?ID=198).
|
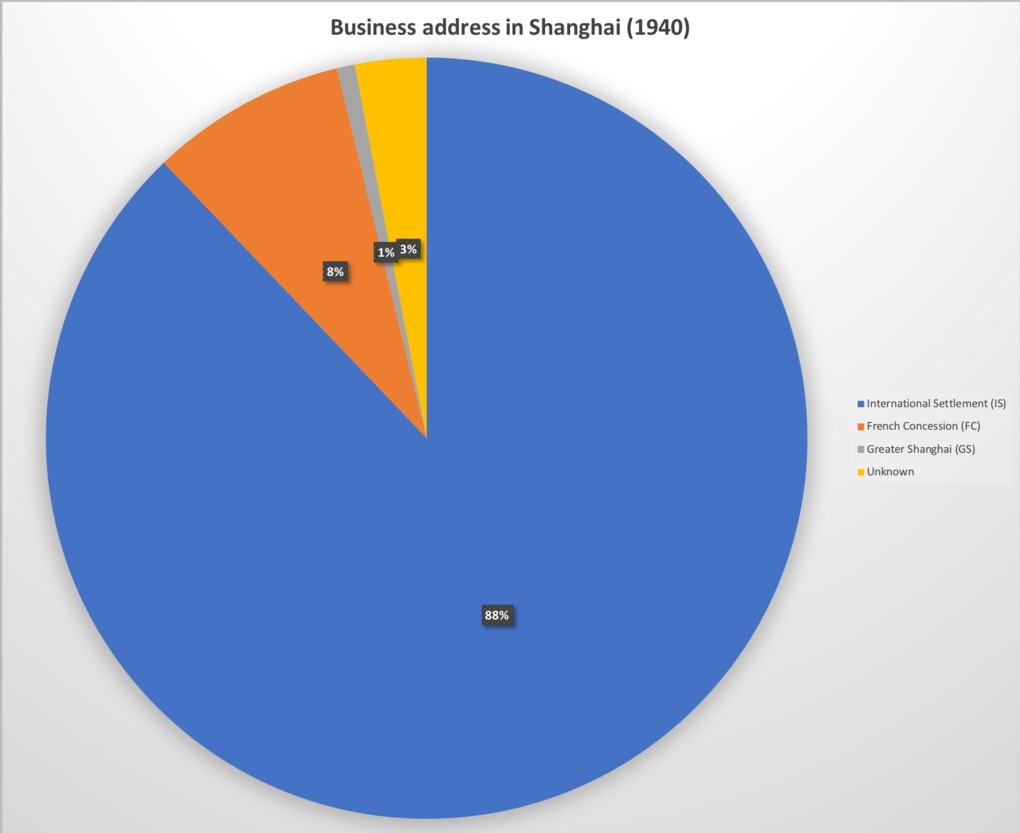 | 322 | Members of the Shanghai Rotary Club (business address and residence in Shanghai) | The following graphs shows the Rotarians' business address and residence in Shanghai, according to their class of occupations and nationality, respectively. They derive from the original list of members drawn after the Shanghai Rotary Club handbook (see table: http://madspace.org/cooked/Tables?ID=198).
|
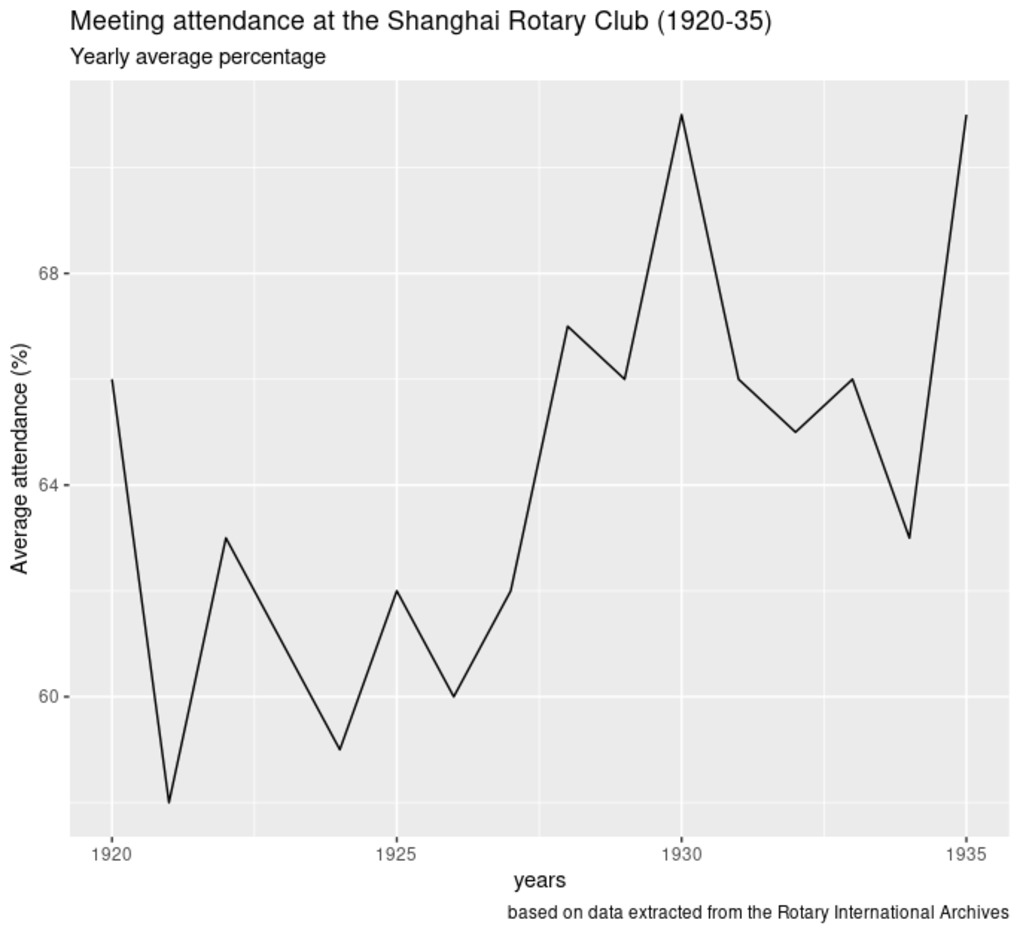 | 378 | Meeting attendance at the Shanghai Rotary Club | Based on data extracted from Rotary International Archives (record of club memberships gains and losses, meeting attendance, membership attendance card). The first graph is based on the average monthly attendance, whereas the second graph is based on the actual number of attendees. The original dataset is avaialble here. We used R package "ggplot2" to build these graphs. |
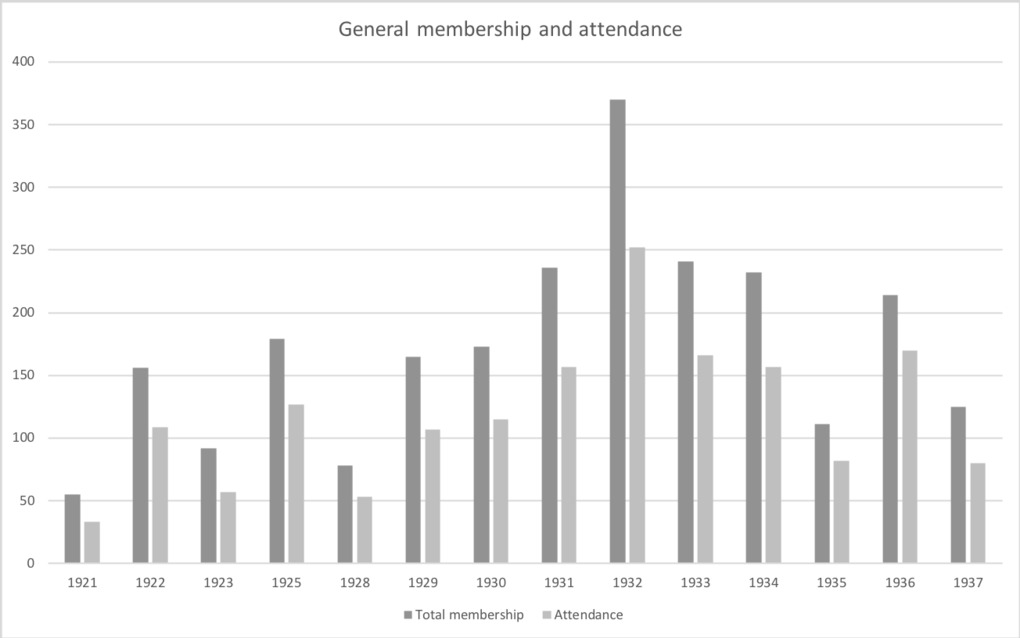 | 402 | Membership, Attendance and Absence at Rotary meetings (after "The Pagoda") | The following graphs shows the evolution of attendance at regular meetings of the Rotary Club of Shanghai. The first graph compares the general attendance with the total membership (all nationalities included). The two other graphs examines Chinese absence at meetings (absence without excuse) in relation to the total number of absentees. Data comes from the corpus of Pagoda we were able to reconstruct from Rotary International archives. The tabulated data we used for conducting our analyses is available in the "Tables" section. The first graph reveals that general attendance was rather irregular over time. In terms of percentage of total membership, attendance never exceeded 70% prior to 1930, with a several drop in 1928 (46%). It rose in the 1930s and peaked in 1935-1936 (74%), while Yinson Lee was chairman of the Programme committee. No data was available for the war and postwar years. Symmetrically, absence without excuse was very irregular over time, with a remarkable drop in 1925 and a severe peak in 1932. As shown on the second and third graphs, Chinese absentees followed the general trend, except in the early years, since the club included very few Chinese members at the time. Their absence peaked in 1925, which suggests that Chinese Rotarians were largely responsible for the general drop in attendance that year. There was second peak of absence in 1934 (46%) and a third, the most important, in 1937 (50%). |


- RAW DATA
- COOKED DATA
- NARRATIVES
- REFERENCES
- DATABASES
15 documents
return to data set
Contact us
Cécile Armand Institut d'Asie Orientale ENS de Lyon, Site Descartes 15 Parvis René Descartes 69341 Lyon Cedex 07 France Email: cecile.armand@gmail.com
Around the Web
![]()
![]()
![]()