


 12345
12345 

filter by Title A B C D E F G H I J K L M N O P Q R S T U V W X Y Z [all]
| ID | Title | Description | |
|---|---|---|---|
 | 234 | Advertising press media in China: distribution between daily and non daily publications (1929) | This pie chart shows the distribution of press advertising media between daily newspapers and non daily publications (periodicals, magazines) in China before 1929. Source: Bacon, 1929 (755). Daily papers are obviously overwhelming the press business in China before the 1930s (89%). |
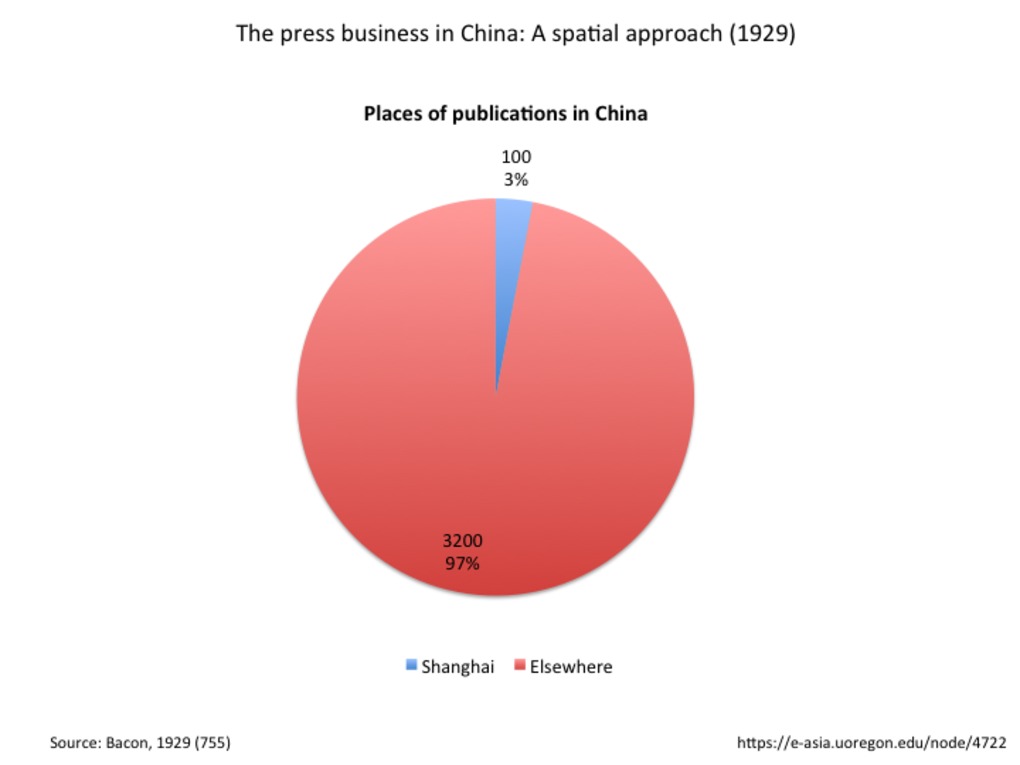 | 235 | The press business in China: A spatial approach (1929) | This pie charts shows the distribution of publications between Shanghai (said to be the center for the press and puslishing business in China at the time) and elsewhere in China. Surprisingly, Shanghai represents only 3% of all publications in China at the time. Yet these figures did not take into account other criteria measuring the qualitative importance of each publication (in terms of readership, spatial coverage, longevity or advertising value). Source: Bacon, 1929 (755) |
 | 236 | Number of daily newspapers in Shanghai and China (1929) | This pie charts shows the distribution of daily newspapers published in China between Shanghai and other places in China. Shanghai represents only 4% of daily publications. Yet these figures did not take into account the qualitative importance of the publication (in terms of readership, spatial coverage, longevity or advertising value). Source: Bacon, 1929 (755) |
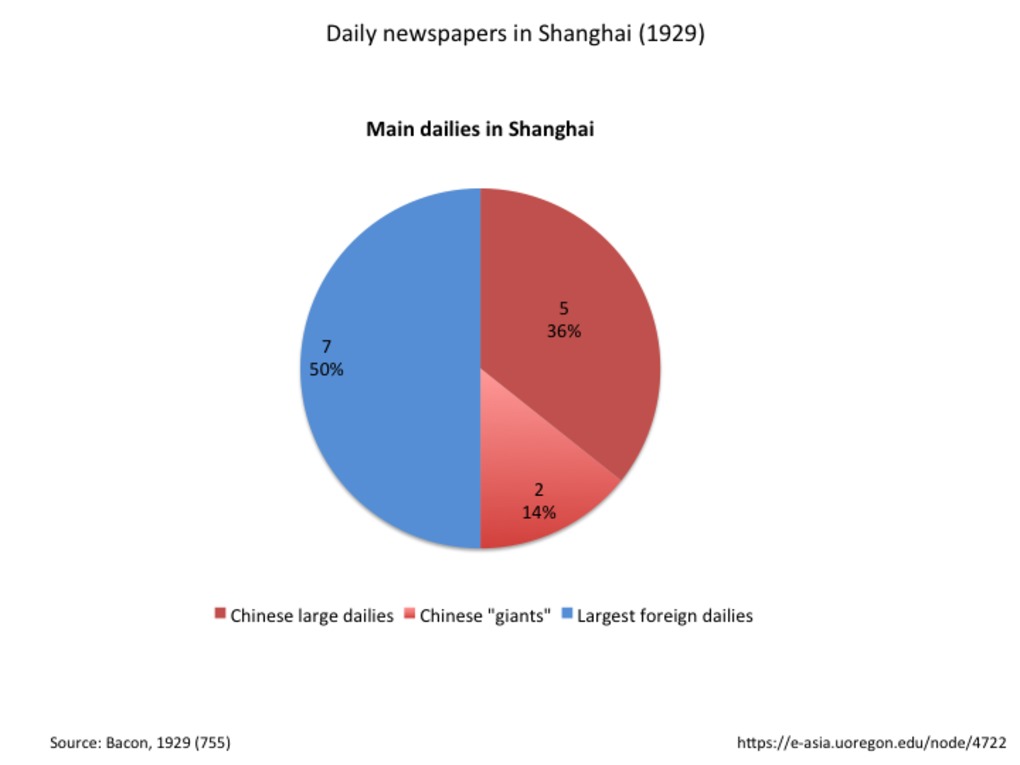 | 237 | Importance of daily newspapers published in Shanghai (1929) | This pie charts shows the distribution of the main daily newspapers published in Shanghai according to their size and importance. Three main types have been identified: Chinese giants (14%), Chinese large dailies (36%) and large foreign dailies (50%). Source: Bacon, 1929 (755) |
 | 238 | Time variations in the recorded advertising population in Shanghai foreign settlements (1905-1943) | This timeline-style bar chart reveals the uneven distribution of recorded advertisements in Shanghai foreign settlements between 1905-1943, in terms of temporal coverage (variations across time). This graph has been established after the Shanghai municipal archives. The last years (1938-1943) are the most well-documented (65% of the recorded population during the entire period), due a huge inventory of the advertising hoardings existing in the International settlement in may 1943 commanded by the Shanghai Municipal. The 1930s are quite well-documented, thanks to the semi-annual lists of neon lights provided to the French Municipal Council by the compagnie Claude Neon Light, Fed. Inc. The 1920s are the least documented years, based on scattered applications for permits. Considering that the advertising business and measuring instruments were are their early stage, the first période (before 1919) is relatively quite well documented. Data for this early period mainly came from the first major census commanded by the Shanghai Municipal Council in 1914, with a view to tax advertising hoardings existing in the International Settlement, based on their surface. |
 | 239 | Advertising population in the newspaper North China Daily News (1914-1949) | This set of three curves traces the evolutions of advertising population and density in the Shanghai-based British newspaper North China Daily News between 1914 and 1949. The green curve stands for the total number of advertisements (in each sample issue), the grey line indicates the total number of pages in each sample issue, the purple line indicates the average density of ads (number of ads/number of pages) in each sample issue). For consistency reasons, the measurements were made after the same five samples as for the Chinese newspaper Shenbao (January 7, 1914; January 3, 1924; January 5, 1934; February 1, 1941; January 1, 1949). *** Le jeu des trois courbes ci-joint retrace les tendances démographiques globales dans le quotidien britannique North China Daily News entre 1914 et 1949 : l’évolution la population totale par numéro (courbe verte), évolution du nombre de pages (en gris), ainsi que l’évolution de la densité moyenne (c’est-à-dire le rapport entre nombre de publicités totale et nombre de pages, en violet). Par souci de cohérence, les mesures ont été réalisées à partir des mêmes cinq échantillons que pour le Shenbao (7 janvier 1914, 3 janvier 1924, 5 janvier 1934, 1er février 1941, 1er janvier 1949) |
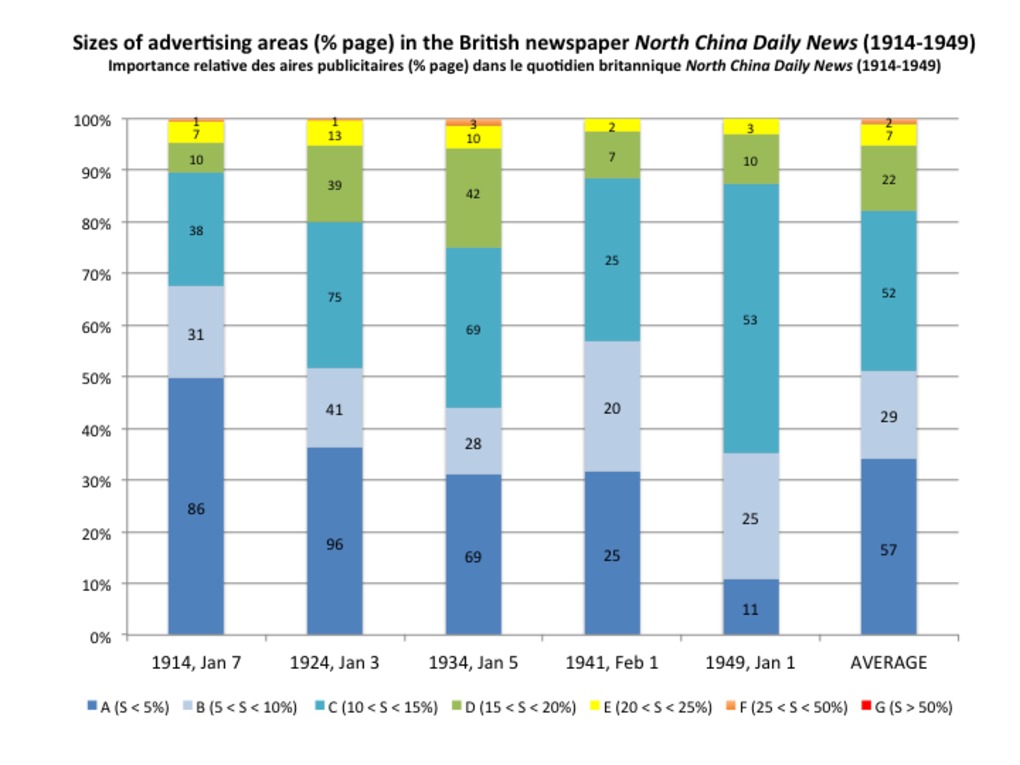 | 240 | Advertising-populated regions in the British newspaper North China Daily News (1914-1949) | This set of bar charts aims to measure the surfaces covered by advertisements in the Shanghai-based British newspaper North China Daily News, according to the following gradual scale of areas*:
*For visibility and convenience reasons, each type has been associated with a letter and a color ("S" standing for "surface"). For consistency reasons, measurements have been made after the same five samples as for the Chinese newspaper Shenbao (Jan 9, 1914; Jan 3, 1924; Jan 5, 1934; Feb 1, 1941; Jan 1, 1949). *** Les histogrammes ci-joint mesurent en termes numériques (nombre d’aires relevant de chaque catégorie) : l’importance relative des aires publicitaires dans le Shenbao, selon l'échelle graduée établie par ailleurs :
Par commoditité et par souci de lisibiité, une lettre et un code couleur a été associé à chaque catégorie. Plus la couleur est « froide » (bleu), plus les aires sont petites (types A, B, C : moins de 15% de la page). Inversement, plus les couleurs sont « chaudes » (du jaune au rouge), plus les surfaces sont étendues (type F et G : plus de 25% de la page). Le vert signale finalement les surface intermédiaires (D et E : entre 15 et 25%). La contance de ce code permet de suivre l’évolution des surfaces au fil des âges et de comparer les deux quotidiens. Par souci de cohérence, les mesures qui suivent ont été réalisées à partir des mêmes échantillons que pour le Shenbao (7 janvier 1914, 3 janvier 1924, 5 janvier 1934, 1er février 1941, 1er janvier 1949). |
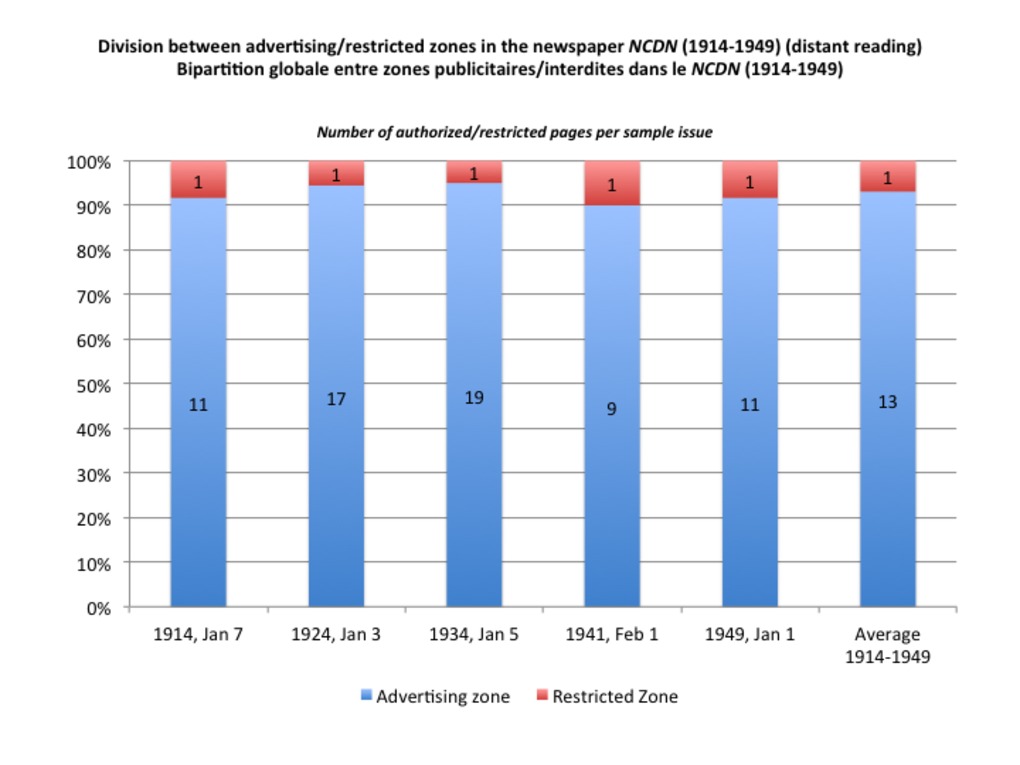 | 241 | Division between advertising space/non commercial space (restricted zone) in the British newspaper North China Daily News between 1914 and 1949 (distant reading) | Ces histogrammes mesurent à distance ou "à vue de nez" (en nombre de pages) la répartition de l'espace du journal entre espace publicitaire/zone autorisée (en bleu) et contenus non commerciaux/zone interdite de publicité (en rouge). Par souci de cohérence, on s'est appuyé sur les cinq mêmes échantillons que pour le Shenbao : 7 janvier 1914, 3 janvier 1924, 5 janvier 1934, 1er février 1941, 1er janvier 1949. Dans un premier temps, on s'est contenté de recenser et départager les pages qui étaient occupées par des publicités (pages autorisées) de celles qui en étaient dépourvues (zones interdites). Cette approche sera affinée par des mesures rigoureuses de la surface effectivement occupée par chaque type de zone. Rough English translation These bar charts offer a distant measuring (by counting the number of pages) of the division between advertising space (blue)/non commercial space (red) in the Shanghai-based British newspaper North China Daily News between 1914 and 1949. For consistency reasons, the measurements were made after the same five samples as used for the Chinese newspaper Shenbao: January 7, 1914; January 3, 1924; January 5, 1934; February 1, 1941; January 1, 1949. In this preliminary approach, the method simply consists in counting the numbers of pages occupied by advertisements (authorized pages/zones), and separating them from the pages strictly deprived from advertisements (restricted zones/pages). This "distant approach" will be refined by a close and precise measuring of the surfaces actually occupied by each type of zone.
|
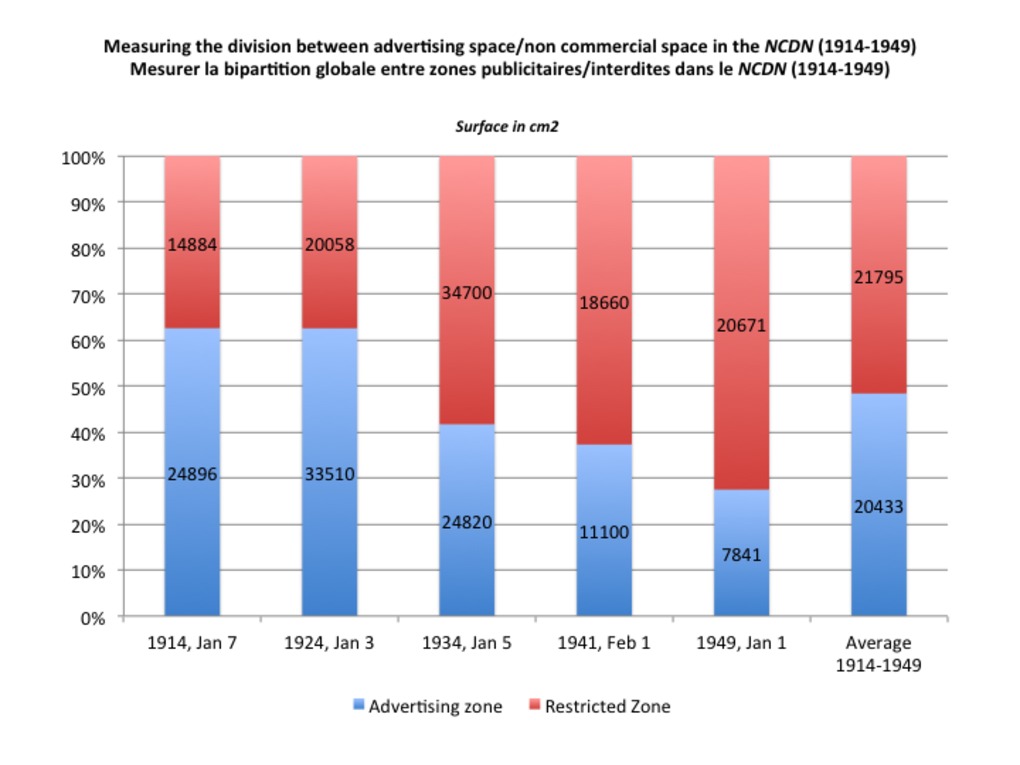 | 242 | Measuring the division between advertising space/non commercial space in the British newspaper North China Daily News between 1914 and 1949 (close reading/quantitative approach) | Ces histogrammes montrent la répartition de l'espace du journal entre espace publicitaire/zone autorisée (en bleu) et contenus non commerciaux/zone interdite de publicité (en rouge) dans le quotidien britannique North China Daily News. Par souci de cohérence, on s'est appuyé sur les cinq mêmes échantillons que pour le Shenbao : 7 janvier 1914, 3 janvier 1924, 5 janvier 1934, 1er février 1941, 1er janvier 1949. La démarche s'inspire directement de l'étude conduite par deux chercheurs de Qinghua dans cinq quotidiens chinois en décembre 1923 (Source: “An Analytical Study of Advertisements in Chinese Newspapers”. Chinese Economic Monthly (CEM). April 1926. Vol. III, No. 4, p.139-143). La structure relativement stable et "rationnelle" du quotidien britannique a simplifié la démarche par rapport au quotidien chinois. En effet, le groupement quasi géométrique des publicités permet d'évaluer facilement la surface publicitaire couverte sur chaque page, sans qu'il soit nécessaire d'additionner les surfaces individuelles. Rough English translation These bar charts measure the division between advertising space (blue)/non commercial space (red) in the Shanghai-based British newspaper North China Daily News between 1914 and 1949. For consistency reasons, the measurements were made after the same five samples as used for the Chinese newspaper Shenbao: January 7, 1914; January 3, 1924; January 5, 1934; February 1, 1941; January 1, 1949. The method was inspired by a contemporary study of newspaper advertising conducted in 1923 and published in the Chinese Economic Monthly in 1926 (source: “An Analytical Study of Advertisements in Chinese Newspapers”. Chinese Economic Monthly (CEM). April 1926. Vol. III, No. 4, p.139-143). |
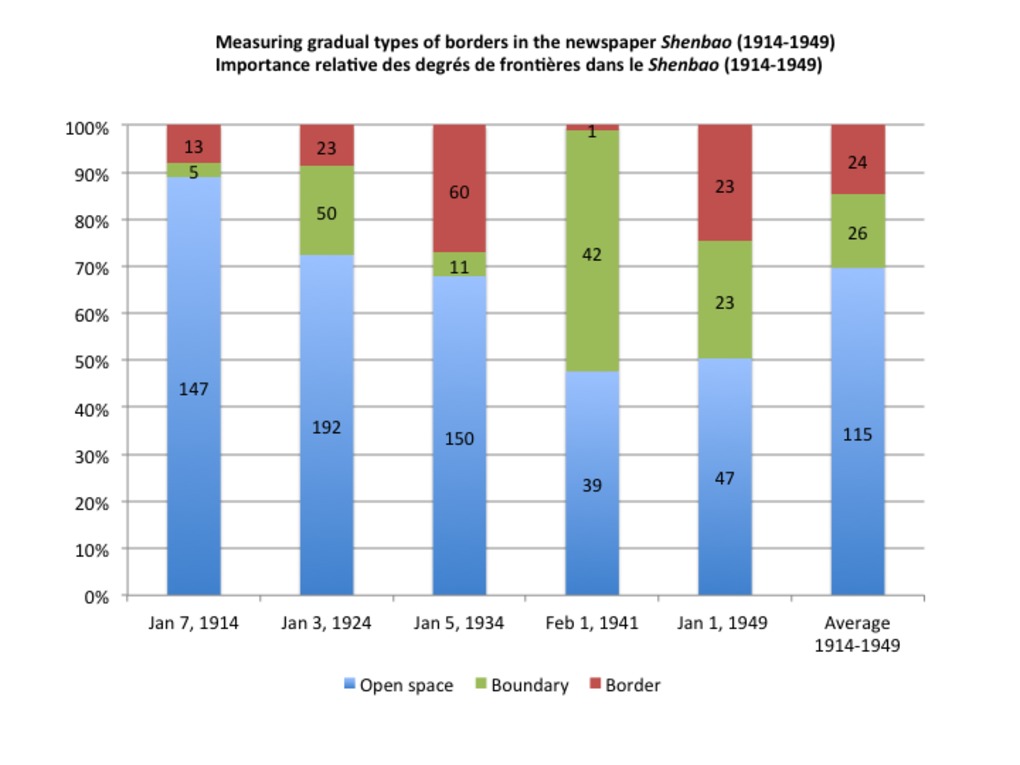 | 243 | Measuring the relative importance of gradual types of borders in the British newspaper North China Daily News (1914-1949) | This set of bar charts aims to measure the relative importance of the three main types of borders identified in the newspaper North China Daily News between 1914-1949, each one associated to a given number and color:
This gradual typology was freely inspired by E. Casey in his reply to P. Ethington's project of "Placing history". Source: Casey, Edward, ‘Boundary, Place, and Event in the Spatiality of History’, Rethinking History, 11 (2007), 507–12. We have only counted the dominant type of border on each page. For an illustrated or more embodied version of this typology, see: http://madspace.org/cooked/Drawings?ID=124. For consistency reasons, the measurements were made in the same five samples as used for the newspaper Shenbao (Jan 7, 1914 ; Jan 3, 1924 ; Jan 5, 1934 ; Feb 1, 1941 ; Jan 1, 1949). |
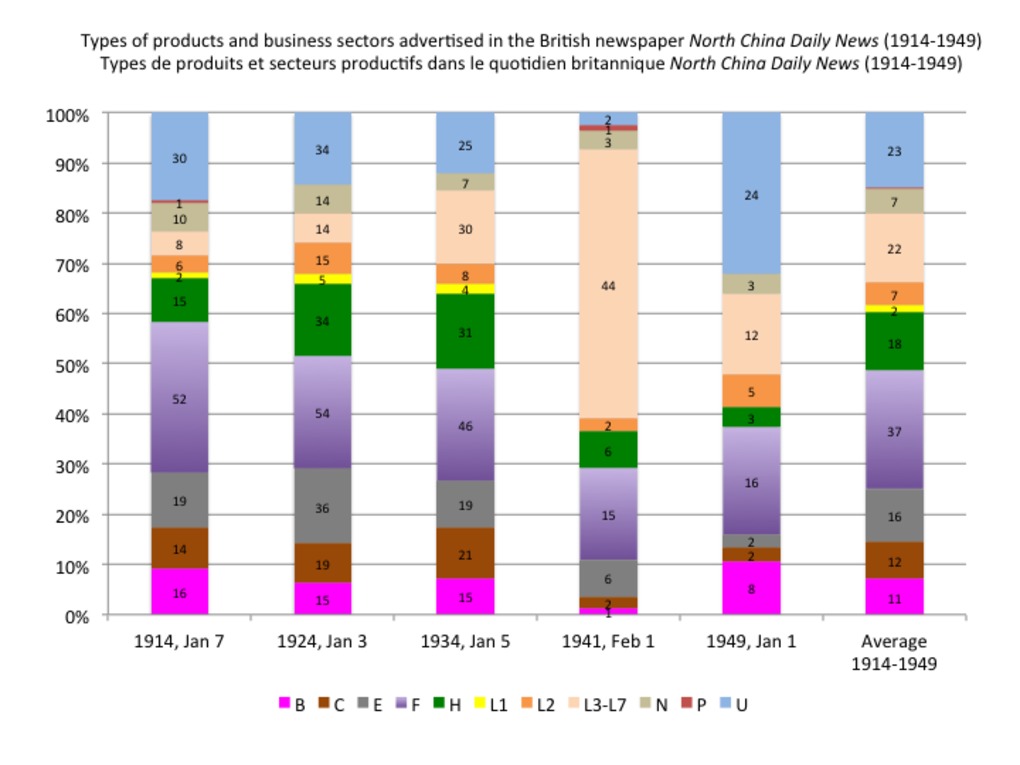 | 244 | Types of products and business sectors advertised in the British newspaper North China Daily News (1914-1949) | Répartition démographique des secteurs productifs dans le North China Daily News (1914-1949) Proportion de produits/secteurs productifs exposés dans le quotidien britannique North China Daily News (1914-1949). Cette répartition est mesurée en termes de population (nombre de publicités). Par cohérence, les mesures ont été réalisées à partir des cinq mêmes échantillons que pour le quotidien chinois Shenbao : 7 janvier 1914, 3 janvier 1924, 5 janvier 1934, 1er fevrier 1941, 1er janver 1949. On a appliqué avec cohérence le code des lettres et des couleurs associé à notre typologie (http://madspace.org/cooked/Drawings?ID=114 ; http://madspace.org/cooked/Trees?ID=101). Proportion of products and business sectors advertised in the British newspaper North China Daily News (1914-1949) Types of products and business sectors advertised in the Shanghai-based British newspaper North China Daily News (in terms of population/number of ads). For consistency reasons, the measurements were made after the same five samples as those used for the Chinese newspaper Shenbao (Jan 7, 1914; Jan 3, 1924; Jan 5, 1934; Feb 1, 1941; Jan 1, 1949). Each type of product is associated to a letter/number and a color code, according to the following typology: http://madspace.org/cooked/Drawings?ID=114 ; http://madspace.org/cooked/Trees?ID=101. |
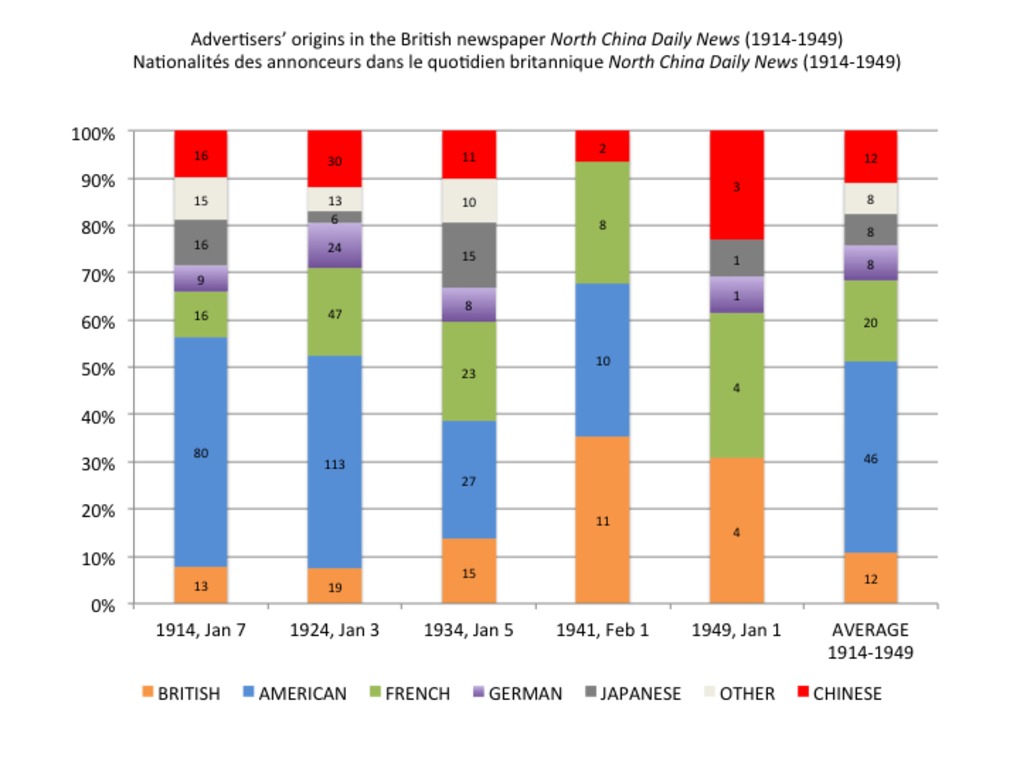 | 245 | Origin of advertisers in the British newspaper North China Daily News (1914-1949) | Nationalités des annonceurs dans le quotidien britannique North China Daily News (1914-1949) Par cohérence, les mesures ont été réalisées à partir des cinq mêmes échantillons que pour le quotidien chinois Shenbao : 7 janvier 1914, 3 janvier 1924, 5 janvier 1934, 1er fevrier 1941, 1er janver 1949. Pour facliter les comparaisons, on a appliqué la même typologie et le même code couleur que pour le Shenbao. Origin/Nationality of advertisers in the British newspaper North China Daily News (1914-1949) For consistency reasons, the measurements were made after the same five samples as those used for the Chinese newspaper Shenbao (Jan 7, 1914; Jan 3, 1924; Jan 5, 1934; Feb 1, 1941; Jan 1, 1949). In order to facilitate comparisons, we have applied the same typology and color code as used for the Chinese newspaper Shenbao. |
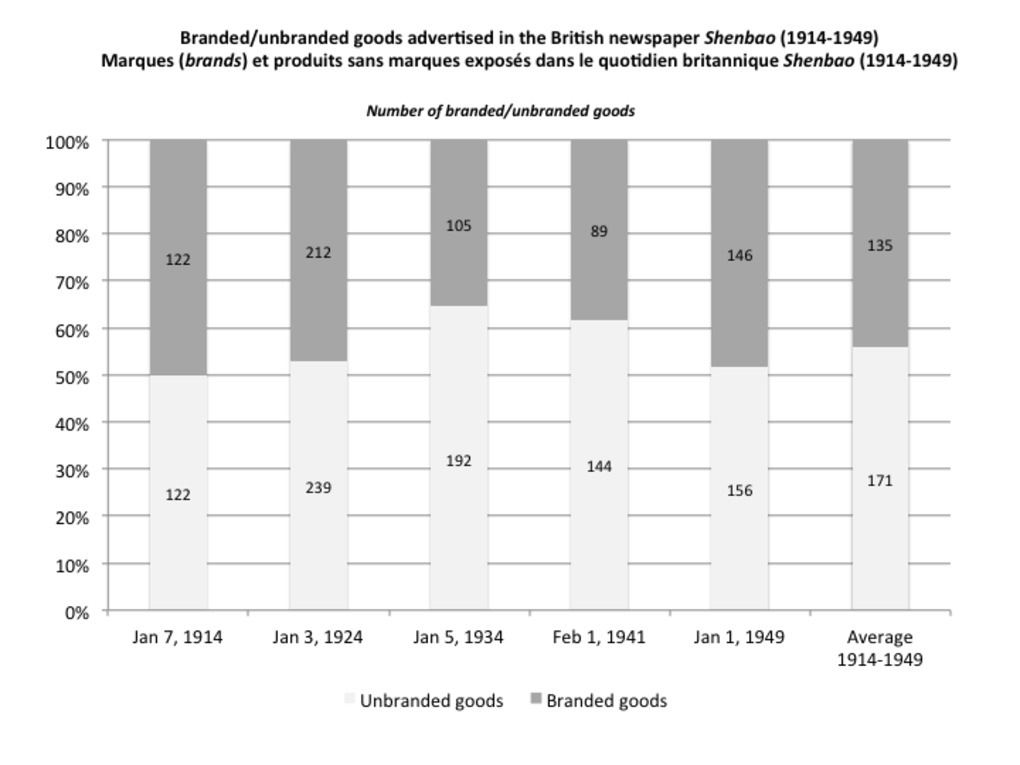
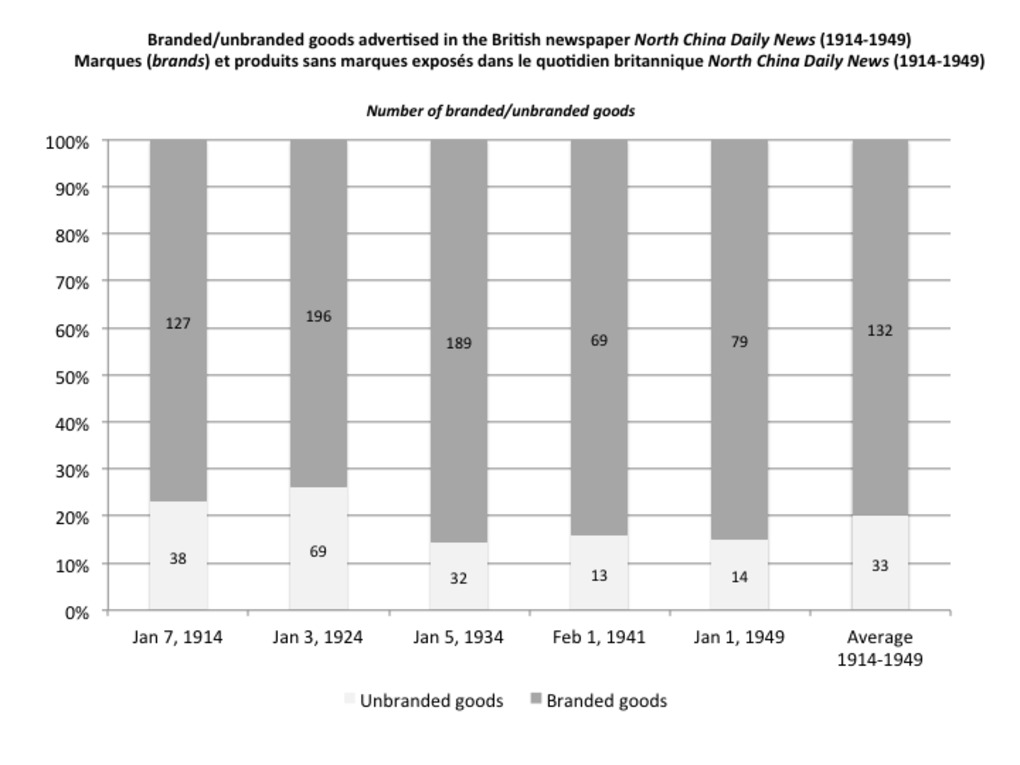 | 246 | Branded/unbranded goods in the British newspaper North China Daily News (1914-1949) | This set of bar charts aims to trace the emergence of branding and measure the proportion of branded (grey)/unbranded goods (white) advertised in the Shanghai-based British newspaper North China Daily News between 1914 and 1949. For consistency reasons, the measurements were made after the same five samples as those used for the Chinese newspaper Shenbao (Jan 7, 1914; Jan 3, 1924; Jan 5, 1934; Feb 1, 1941; Jan 1, 1949). |
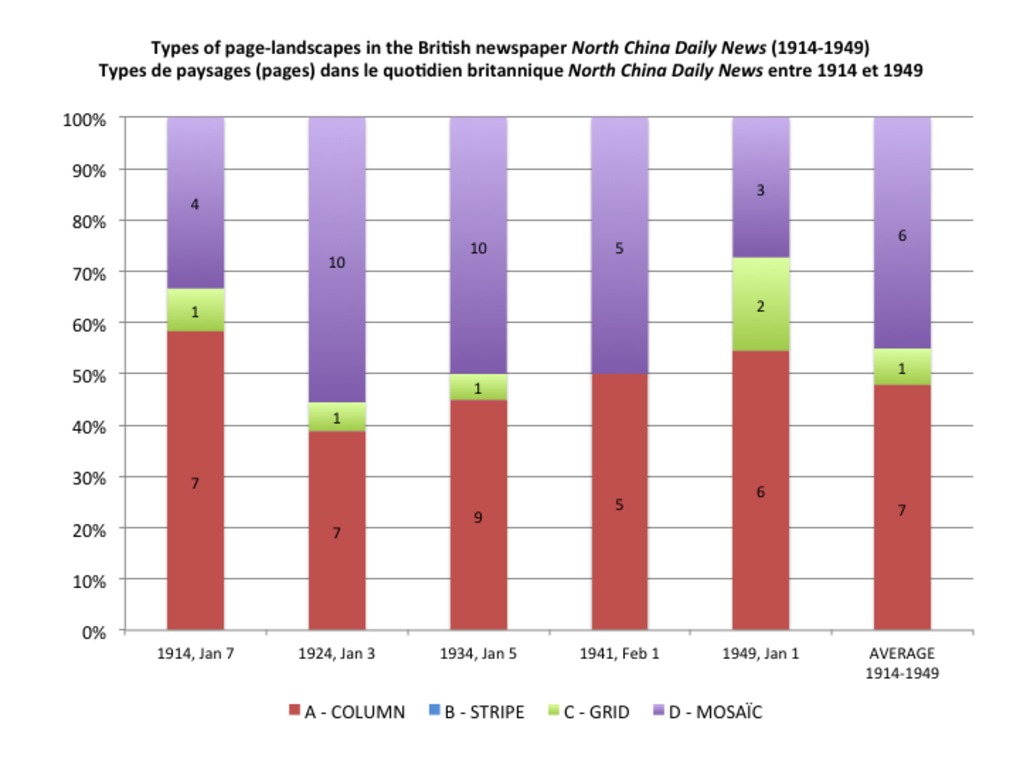 | 247 | Types of page-landscapes in the British newspaper North China Daily News (1914-1949) | Evolution des paysages (types de pages) dans le quotidien britannique North China Daily News entre 1914 et 1949 Cette succession d'histogramme mesurent l'importance relative de chaque type de page dans le quotidien britannique North China Daily News, et leur évolution au cours du temps entre 1914 et 1949. Les mesures ont été réalisées à partir des cinq mêmes échantillons que pour le quotidien chinois Shenbao : 7 janvier 1914 (14p), 3 janvier 1924 (22p), 5 janvier 1934 (32 p), 1er février 1941 (14p), 1er janvier 1949 (14p). L'axe des ordonnées indique le nombre de pages, l'axe des abscisses sert de ligne du temps. A chaque type est associée une couleur : rouge pour la colonne verticale (type A), bleu pour la bande horizontale (B), vert pour la grille/quadrillage (C), violet pour la mosaïque (D). Types of page-landscapes in the British newspaper North China Daily News (1914-1949) This set of bar charts aims to measure the proportion of the various types of pages in the five usual samples of the Shanghai-based British newspaper North China Daily News (January 7, 1914; January 3, 1924; January 5, 1934; February 1, 1941; January 1, 1949), according to the same typology and color code as used for the Chinese newspaper Shenbao: vertical column-style (A), horizontal stripe-style (B), grid (C), mosaïc/atchwork (D). In order to facilitate comparisons, we have used the same typology and color code as for the Chinese newspaper Shenbao: vertical column-style (A, red), horizontal stripe-style (B, blue), grid (C, green), mosaïc/patchwork (D, purple).
|
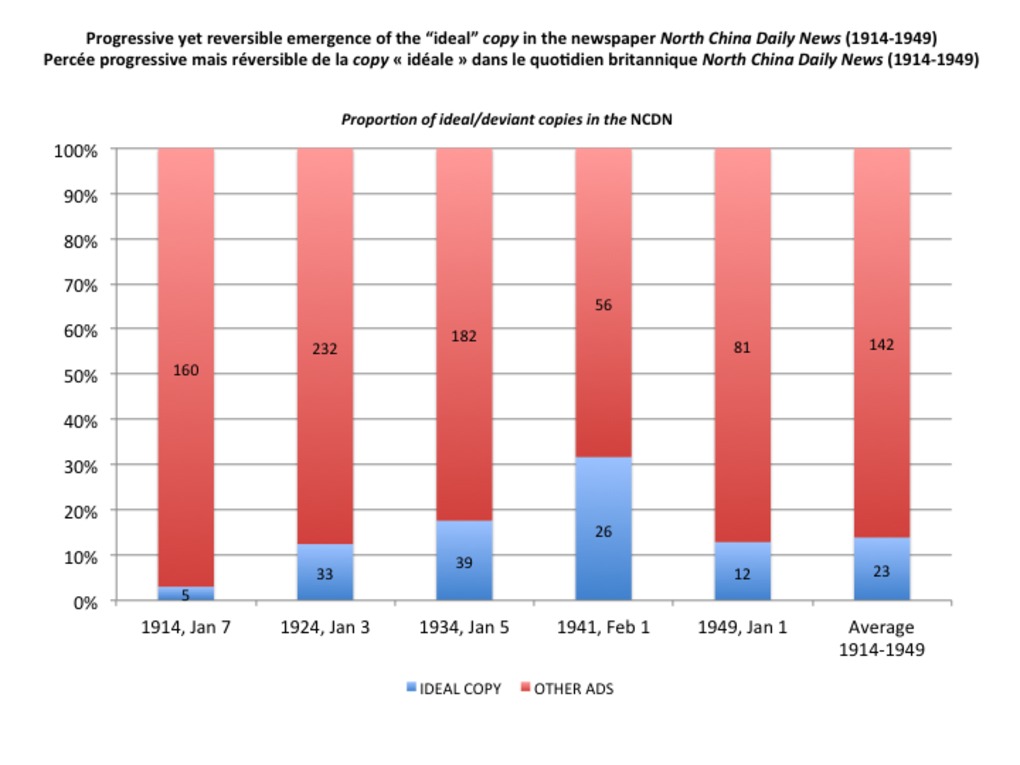 | 248 | Ideal/deviant copies in the British newspaper North China Daily News (1914-1949) | Ces histogrammes mesurent la proportion de publicités conformes à la copy "idéale" (bleu) et de publicités non conformes à la norme (rouge), afin de retracer l'émergence progressive de la "copy" idéale* dans le quotidien britannique North China Daily News entre 1914 et 1949. Par cohérence, les mesures ont été réalisées à partir des mêmes échantillons que pour le quotidien chinois Shenbao : 7 janvier 1914, 3 janvier 1924, 5 janvier 1934, 1er février 1941, 1er janvier 1949. *Par "copy" idéale, il faut entendre toute publicité composée d'au moins deux des élement textuels et un des éléments visuels définis dans les manuels publicitaires (cf. chapitre 5 et échelle graduée de la visualité/écarts à la norme dans la section "Drawings"). Proportion of "ideal/deviant" copies in the British newspaper North China Daily News (1914-1949) The first set of bar charts measures the proportion of "ideal" (blue) and "deviant" (red) copy and traces the gradual emergence of the "ideal copy" * in the Shanghai-based British newspaper North China Daily News between 1914 and 1949. For consistency reasons, the measurements were made after the same five usual samples as used for the Chinese newspaper Shenbao: January 7, 1914; January 3, 1924; January 5, 1934; February 1, 1941; January 1, 1949. * By "ideal copy", I mean any advertising composed of at least two of the textual elements and one of the visual elements identified by contemporary handbooks (see Chapter 5 and my own scale of visuality/deviations from the ideal copy in the "Drawings" section). |
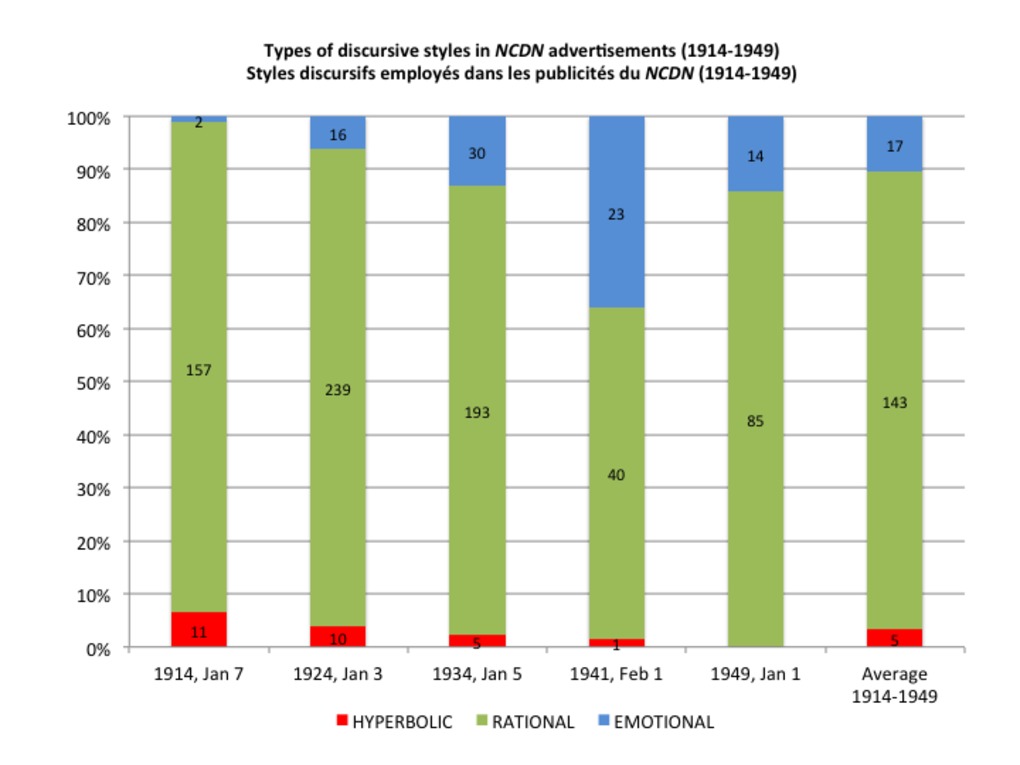 | 249 | Types of discursive styles in the British newspaper North China Daily News advertisements (1914-1949) | This set of six bar charts measure the relative importance of the three main types of discursive styles (or "ages") used in the advertisements published in the Shanghai-based British newspaper North China Daily News. For consistency reasons, the measurements have been made in the samples as used for the Chinese newspaper Shenbao: January 7, 1914; January 3, 1924; January 5, 1934; February 1, 1941; January 1, 1949. In order to facilitate comparisons, we have also used the same typology and color color as for the Shenbao. |
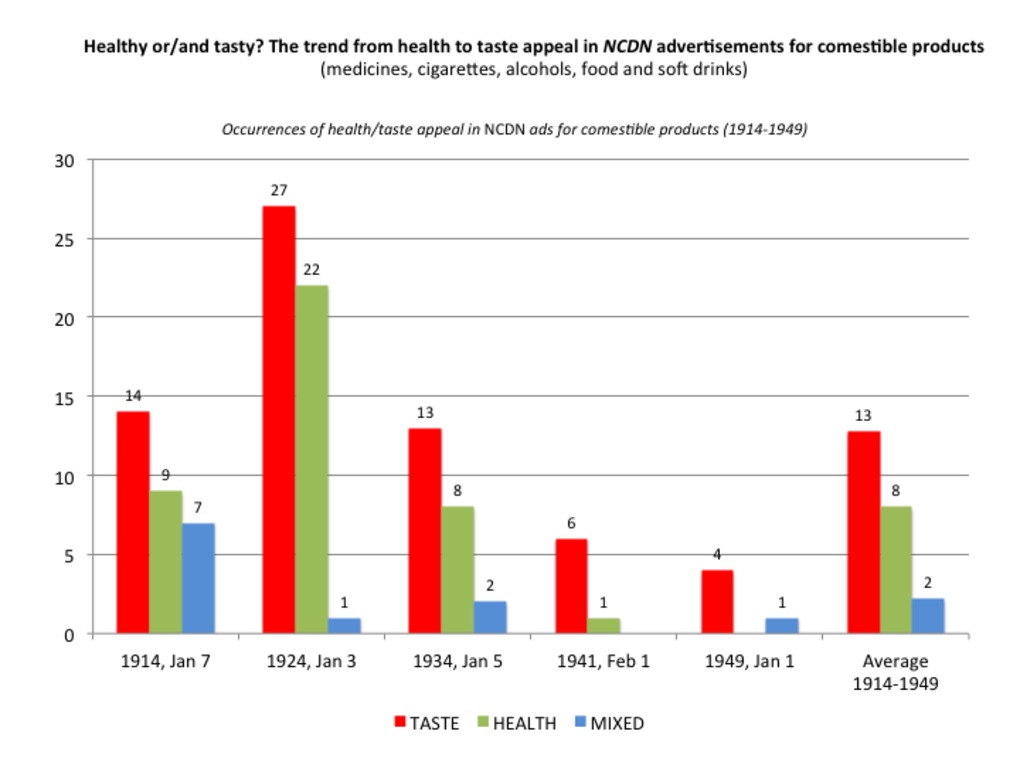 | 250 | Healthy or/and tasty? The trend from health to taste appeal in the North China Daily News advertisements for comestible products (1914-1949) | This set of bar charts measure the relative importance of two major appeals that were used to advertise comestible products at the time: health and taste/appetite, which either compete or complete each other. By "comestible products", we mean medicines, tobacco, alcholic drinks, food and soft drinks. For consistency reasons, the measurements were made from the same five samples as used for the Chinese newspaper Shenbao (January 7, 1914; January 3, 1924; January 5, 1934; February 1, 1941; January 1, 1949). In each sample, we have recorded the occurrences of each appeal: health only (green), taste only (red), or a combination of the two appeals in the same advertisement (blue). |
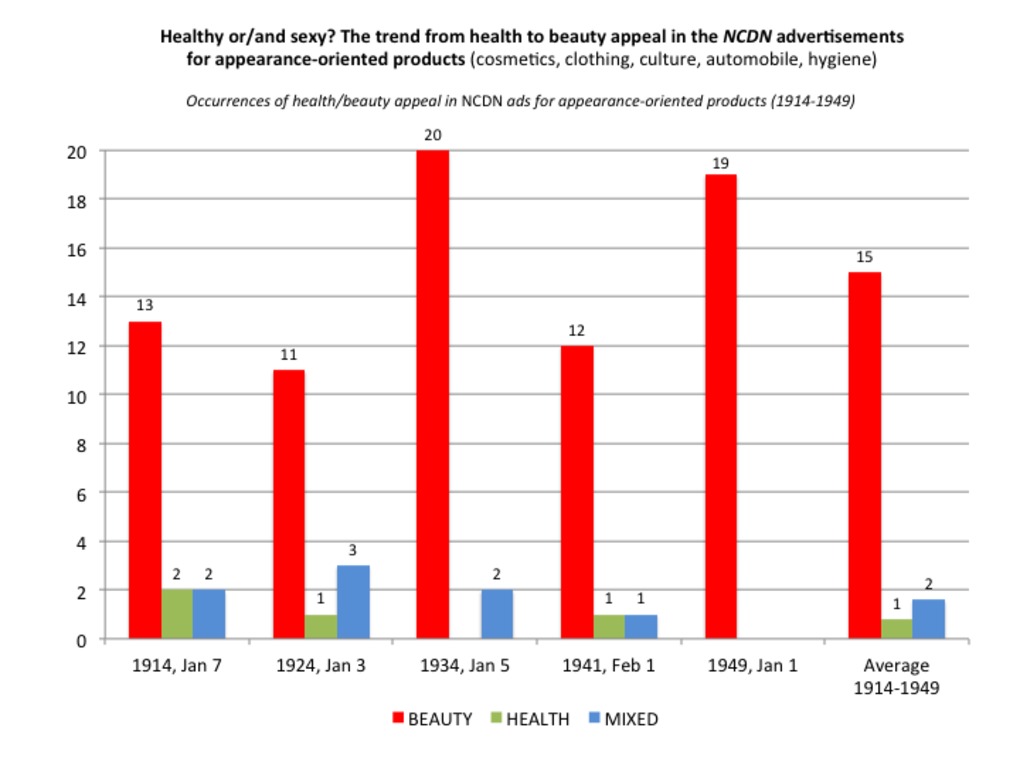 | 251 | Healthy or/and sexy/trendy? The trend from health to beauty/fashion appeal in the North China Daily News advertisements for appearance-oriented products (1914-1949) | This set of bar charts measure the relative importance of two major appeals that were used to advertise appearance-oriented products at the time: health and beauty/sex appeal, which either compete or complete each other. Behind the phrase "appearance products", we mainly include cosmetics, clothing, culture, automobile and hygienic products. For consistency reasons, the measurements were made after the same five samples as used for the Chinese newspaper Shenbao (except for January 7, 1914: January 3, 1924; January 5, 1934; February 1, 1941; January 1, 1949). In each sample, we have recorded the occurrences of each appeal: health only (green), beauty/sex only (red), or a combination of the two appeals in the same advertisement (blue). |
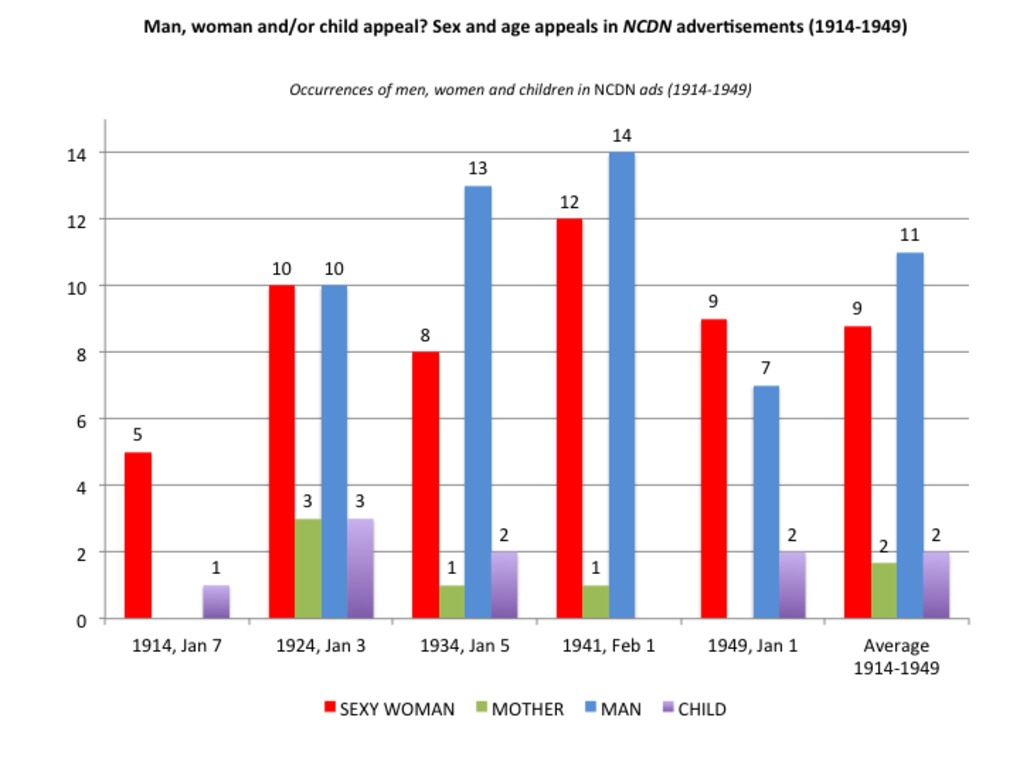 | 252 | Woman, man and child appeals in North China Daily News advertisements (1914-1949) | This set of bar charts measure the relative importance of sex and age appeals in the British newspaper North China Daily News advertisements from 1914 to 1949. Note that these appeals do not exclude each other: children and mothers are often associated on the same picture, as are elegant men and sexy women. The measurements were made from our the same five samples as used for the Chinese newspaper Shenbao (January 7, 1914; January 3, 1924; January 5, 1934; February 1, 1941; January 1, 1949). In each sample, we have recorded the occurrences of each appeal: sexy woman, corresponding to the seducive Modern Girl or independant New Woman (red), the patriotic mother or housewife (green), men (blue) or children (purple). |
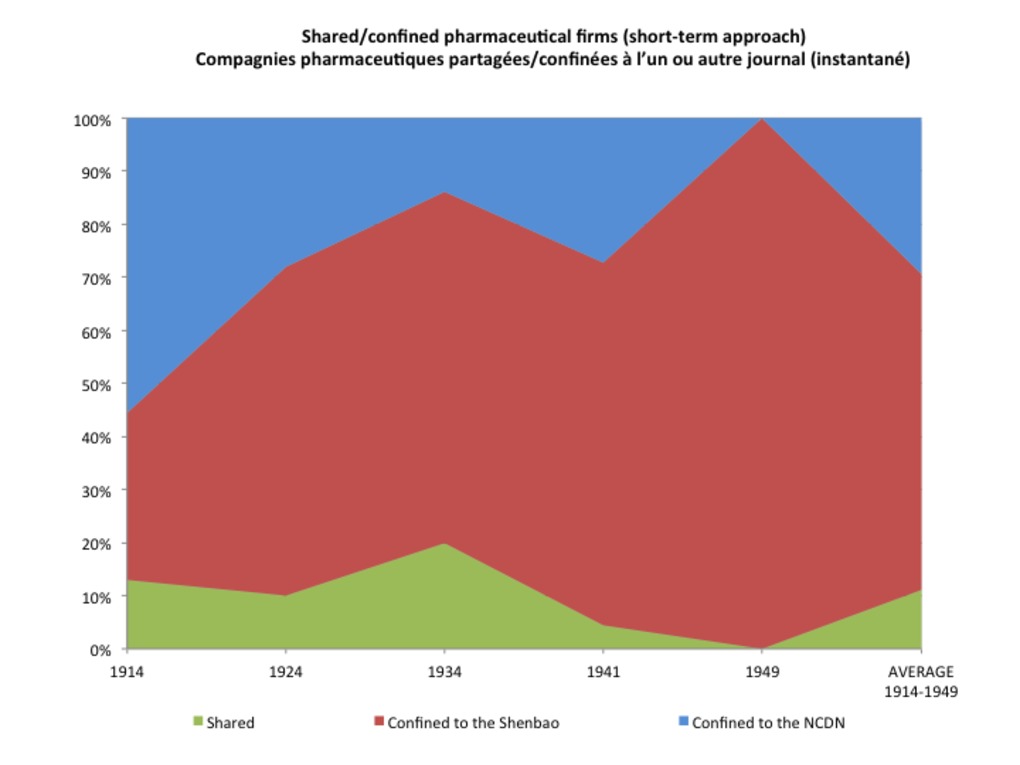 | 253 | Circulations of pharmaceutical brands and firms between the Chinese and British newspapers Shenbao and North China Daily News (1914-1949) | This set of four graphs aims to measure the proportion of pharmaceutical brands and firms, either shared or confined to the Chinese newspaper Shenbao and the Biritish North China Daily News, between 1914-1949. Shared brands or firms are materialized in green, the brands/firms confined to the Shenbao in red, and those confined to the North China Daily News in blue. In order to compensate the restriction of our sampling method, and to take possible time gaps into account, we have measured both short-term/simultaneous circulations (that is, shared brands/firms advertised in a restricted sample, at a given point in time) (first set of graphs) and long-term circulations (shared brands/firms in an enlarged sample, covering the entire period 1914-1949) (second set of graph lines). The measurements were made after extended (weekly) samples of both newspapers (Jan 7-14 1914, Jan 1-8 1924, Jan 1-10 1934, Feb 1-8 1941, Jan 1-8 1949). The related brandstrees have proved powerful tools to fill in this table (see the "Trees" section). This table was then use to build the related graphs (see the "Graphs" section) measuring the number of brands/firms either shared between the Shenbao and North China Daily News, or confined to one or the other newspaper. It was also used to draw the related intertwined circles (see the "Drawings" section). |
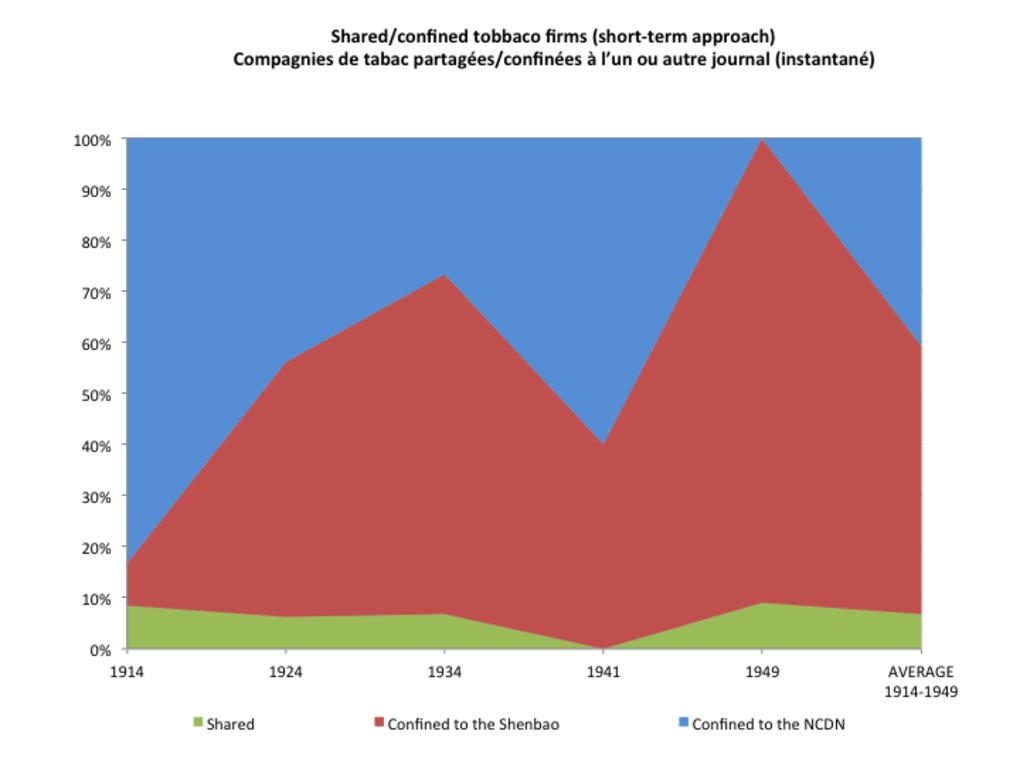 | 254 | Circulations of cigarette brands and firms between the Chinese and British newspapers Shenbao and North China Daily News (1914-1949) | This set of four graphs aims to measure the proportion of cigarette/tobacco brands and firms, either shared or confined to the Chinese newspaper Shenbao and the Biritish North China Daily News, between 1914-1949. In order to compensate the restriction of our sampling method, and to take possible time gaps into account, we have measured both short-term/simultaneous circulations (that is, shared brands/firms advertised in a restricted sample, at a given point in time) (first set of graphs) and long-term circulations (shared brands/firms in an enlarged sample, covering the entire period 1914-1949) (second set of graph lines). The measurements were made after extended (weekly) samples of both newspapers (Jan 7-14 1914, Jan 1-8 1924, Jan 1-10 1934, Feb 1-8 1941, Jan 1-8 1949). The related brandstrees have proved powerful tools to fill in this table (see the "Trees" section). This table was then use to build the related graphs (see the "Graphs" section) measuring the number of brands/firms either shared between the Shenbao and North China Daily News, or confined to one or the other newspaper. It was also used to draw the related intertwined circles (see the "Drawings" section). |
 | 255 | Branded/unbranded goods in the Chinese newspaper Shenbao (1914-1949) | This set of bar charts aims to trace the emergence of branding and measure the proportion of branded (grey)/unbranded goods (white) advertised in the Shanghai-based Chinese newspaper Shenbao between 1914 and 1949. The measurements were made after our five usual samples (Jan 7, 1914; Jan 3, 1924; Jan 5, 1934; Feb 1, 1941; Jan 1, 1949). |
 | 256 | Creativity profiles in Shenbao advertisements (1914) | This graph aims to correlate the number of occurrences (blue line) to the number of variants (red line) in a given series of advertisements extracted from the Chinese newspaper Shenbao in 1914.The measurements have been made after an extended weekly sample of this newspaper (Jan 7-15, 1914). This graph reveals three creativity profiles: the medical brand Scott's Emulsion embodied the maximal creativity (8 variants/8 occurences), while the cigarette brand Three Castles offered the minimal creativity (1 variant/8 occurrences) and Doan Backache & Kidney Pills displayed a medium creativity (1 variant (1 variant/3 occurrences). |
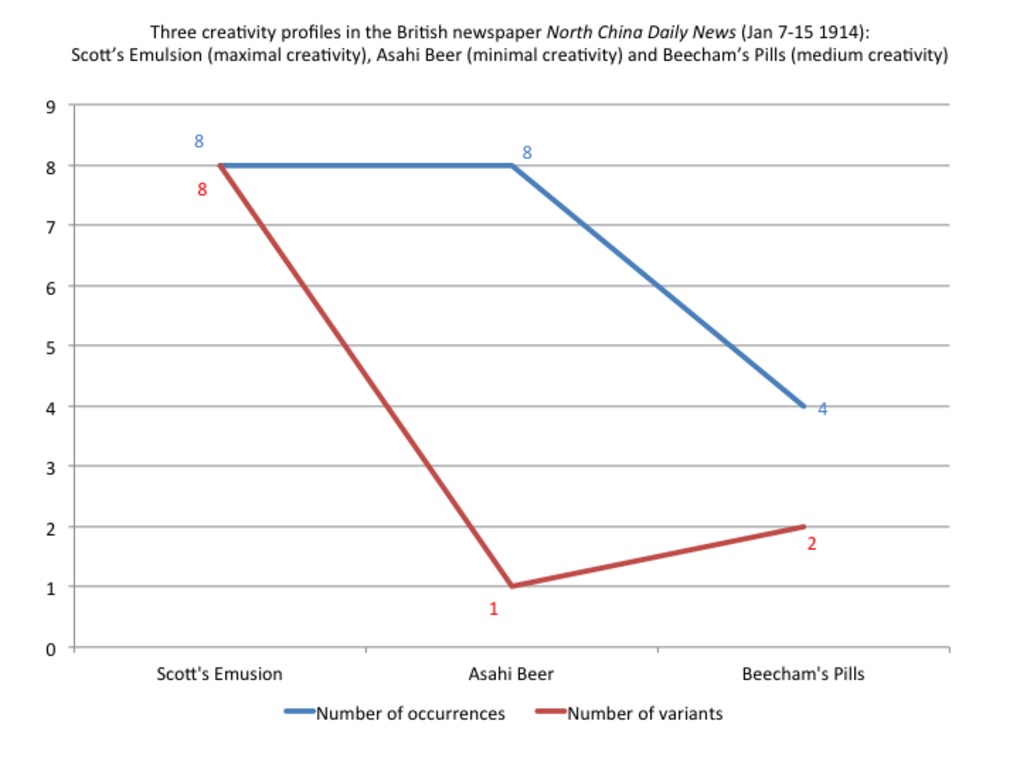 | 257 | Creativity profiles in North China Daily News advertisements (1914) | This graph aims to correlate the number of occurrences (blue line) to the number of variants (red line) in a given series of advertisements extracted from the Shanghai-based British newspaper North China Daily News in 1914. For consistency reasons, the measurements have been made after the same extended weekly sample as that used for the Chinese newspaper Shenbao (Jan 7-15, 1914). This graph reveals three creativity profiles. As in in the Chinese newspaper Shenbao, the medical brand Scott's Emulsion embodied the maximal creativity (8 variants/8 occurences), while the Japanese beer brand Asashi offered the minimal creativity (1 variant/8 occurrences) and Beecham's Pills displayed a medium creativity (1 variant (1 variant/3 occurrences). |
 | 258 | Frequency and creativity in Shenbao advertisements (1914) | This graph aims to correlate creativity (measured by the coefficient of variation) (red line) with frequency (blue line) in a given series of advertisements extracted from the Chinese newspaper Shenbao in 1914.The measurements have been made after an extended weekly sample of this newspaper (Jan 7-15, 1914). Though there is a "logical" relation between high frequency and low creativity (Three Castles), advertising series in the Shenbao offered much more complexity in 1914. In effet, this graph actually reveals eleven correlation profiles. |
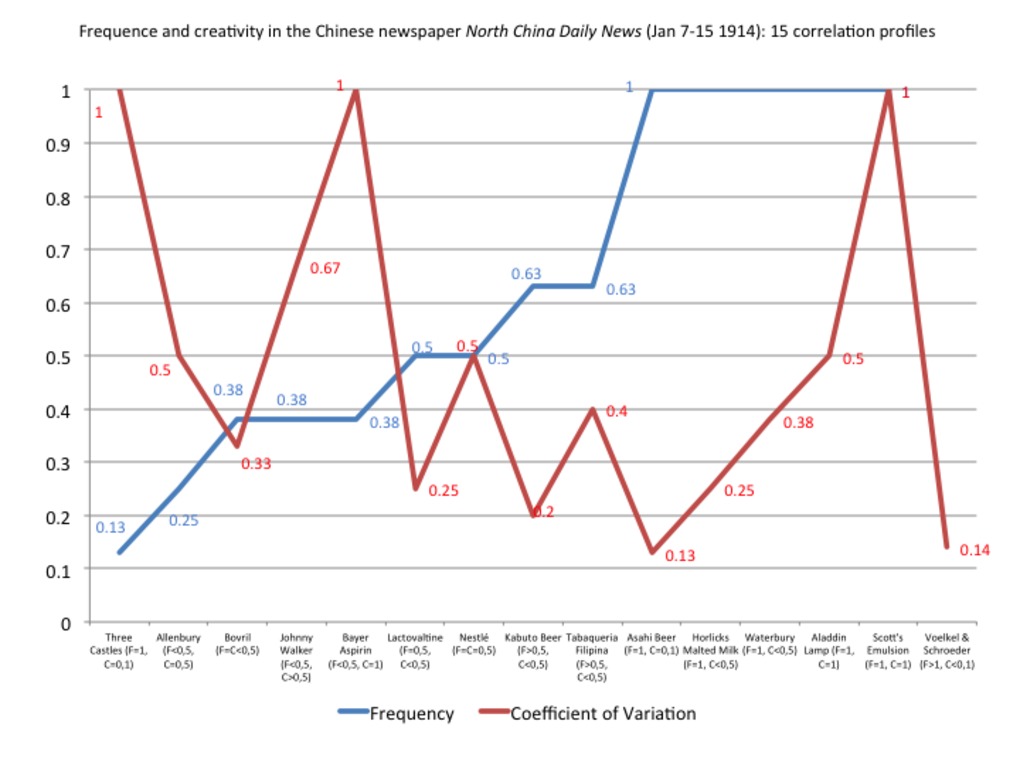 | 259 | Frequency and creativity in North China Daily News advertisements (1914) | This graph aims to correlate creativity (measured by the coefficient of variation) (red line) with frequency (blue line) in a given series of advertisements extracted from the Shanghai-based British newspaper North China Daily News in 1914.The measurements have been made after an extended weekly sample of this newspaper (Jan 7-15, 1914). Though there is a "logical" relation between high frequency and low creativity (Asahi Beer), advertising series in the Shenbao offered much more complexity in 1914. In effet, this graph actually reveals fifteen correlation profiles. |
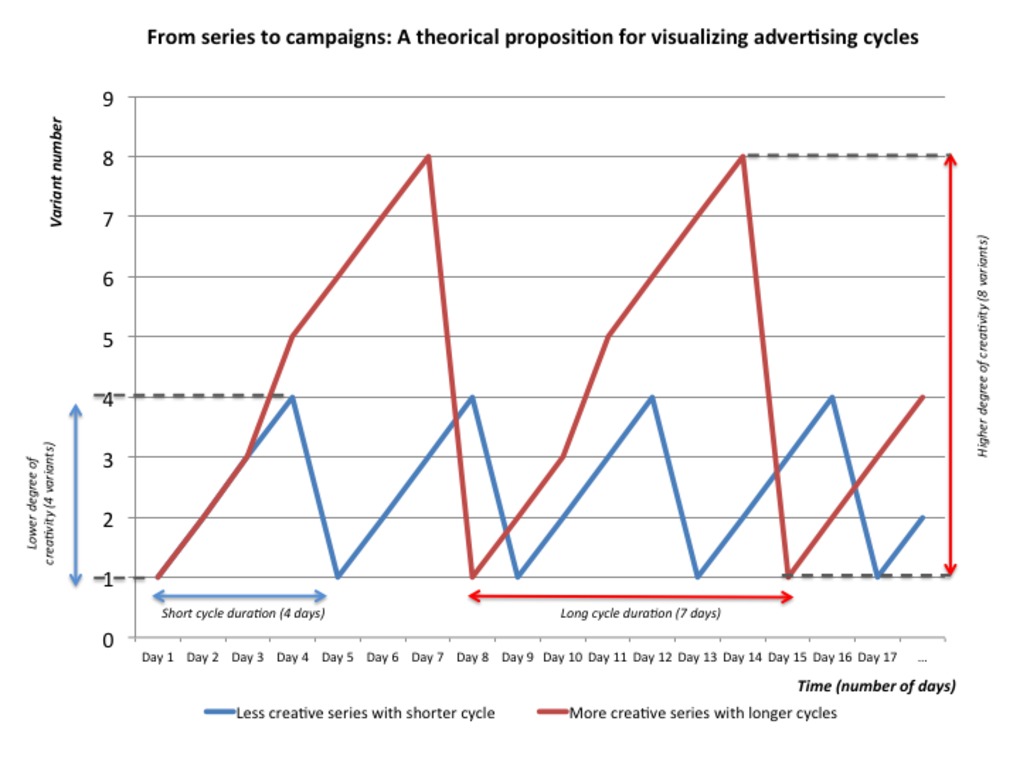 | 260 | From series to campaigns: Modelizing advertising cycles in newspapers | This graph line offers a theoretical model for visualizing advertising cycles in any newspaper - in Shanghai-based newspapers in particular. The "X" axis indicates time (numbers of day/day number), while the "Y" axis measures the number of variants in a given series of advertisements. The length of ondulations (i.e. the distance between two same variants in the series) measures the duration of serial cycles. The amplitude (or height) of ondulations indicates the degree of creativity (measured by the number of variants). The least creative series and shortest cycles are materialized by the blue line, offering the shortest ondulations (4 variants, 4 days). The most creative series and longest cycles may be materialized by the red line: offering the longest and highest ondulations (7 days, 7 variants). The ultimate goal of the model is to trace an entire campaign - a campaign consisting in the collection of all sequential cycles. This is a very simplified model, based on ideal series with daily frequency. Yet all advertisements series are not daily-based. Some may appear two or several times a day, while others may appear only one time a week, or every two, three, four... days. Therefore, this model may be complexified in practice. It needs to be adjusted to each single case study.
|
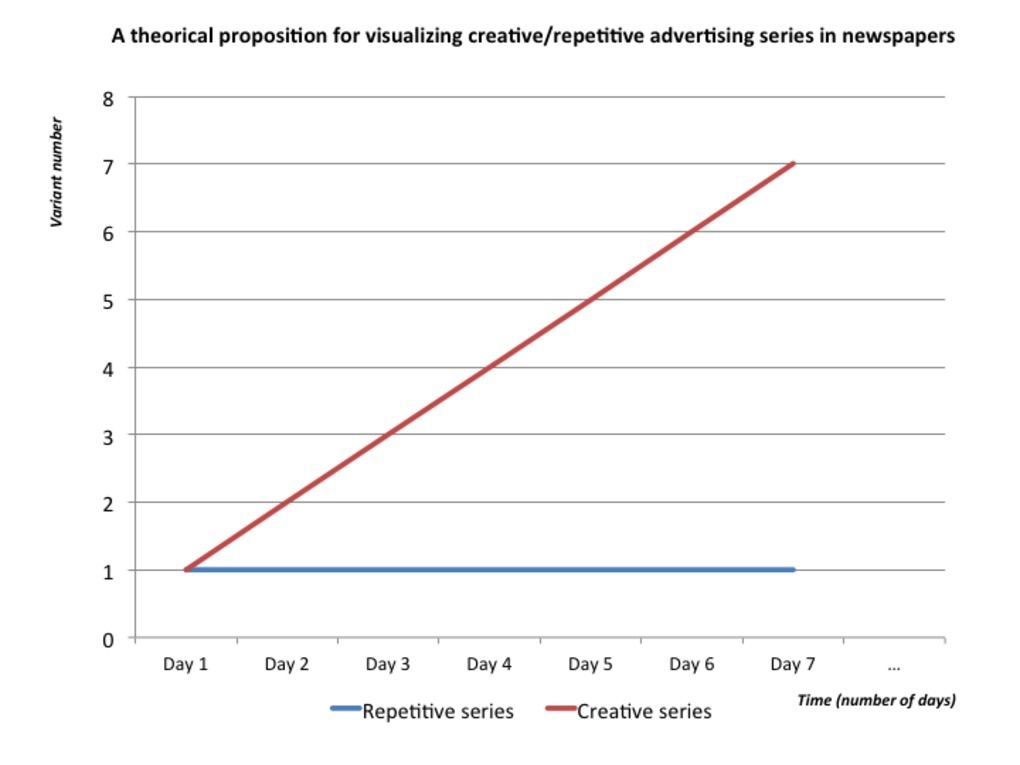 | 261 | Modelizing repetitive/creative advertising series in newspapers | This graph line offers a theoretical model for visualizing creative/repetitive advertising series in any newspaper - in Shanghai-based newspapers in particular. The model is quite simple. The "X" axis indicates time (numbers of day/day number), while the "Y" axis measures the number of variants in a given series of advertisements. Repetitive series are materialized by the blue flat line (only 1 variant during the entire period under consideration). Creative series may be materialized by the red ascending line. The most creative the series, the most numerous the variants, and the most dramatically climbing the line.
|
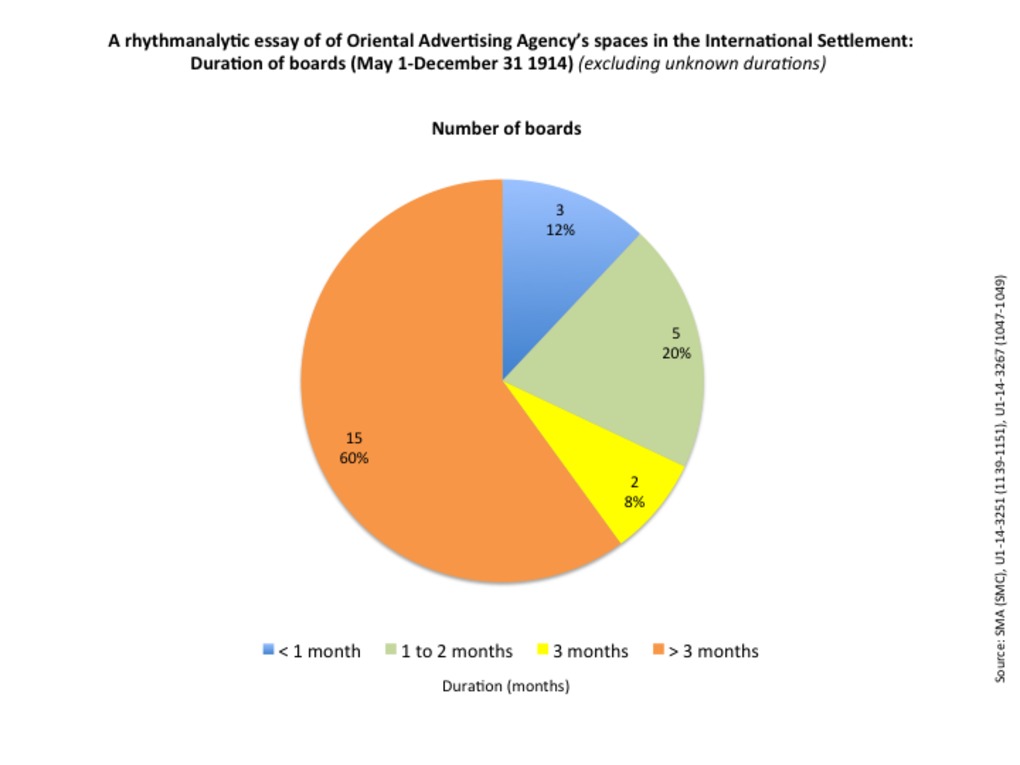 | 262 | A rhythmanalytic essay of Oriental Advertising Agency’s spaces in the International Settlement: Duration of boards (May 1-December 31 1914) | These set of three charts aims to evaluate the lifetimes of Oriental Advertising's boards in the International Settlement during the year 1914. The figure are based on the the census made by the S.M.C. in 1914 and the regular inventories of boards that Oriental Advertising Agency's sent to the Council between May 1 and December 31, 1914. Source: SMA (SMC), U1-14-3251 (1139-1151), U1-14-3267 (1047-1049). The first pie chart ignores the boards for which we do not know the date of removal or end of contract. The second pie chart includes those under-documented artifacts (63%). Both pie charts reveal that despite the war, longer contracts (more than three months) tend to dominate (60%, 22%), followed by contracts between 1 to 2 months (20%, 7%), less than one month (12%, 5%) and eventually three-month contracts (8%, 3%). The last bart chart indicates the average duration of contracts (92 days, about 3 months). Beyond this average figure, it reveals strong gaps between the maximal (153 days) and minimal durations (19 days). |
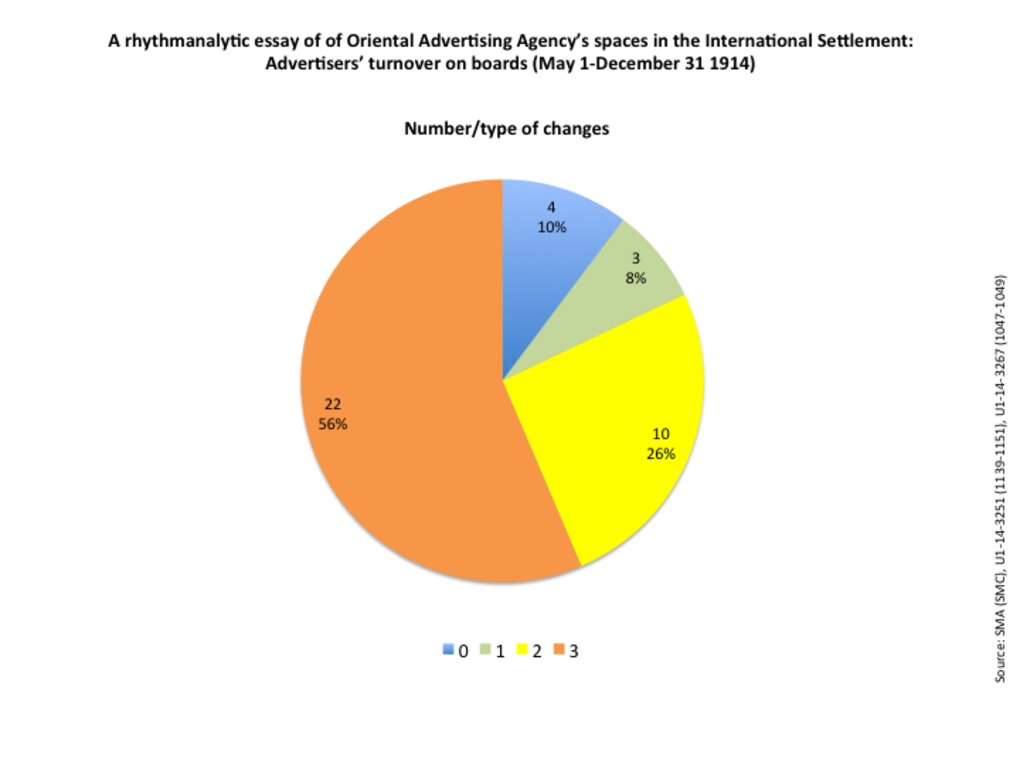 | 263 | Advertisers’ turnover on Oriental Advertising Agency's boards in the International Settlement (May 1-December 31 1914) | These set of three charts aims to refine the rhythmanalysis based on contracts duraction by appreciating the nature and degree of turnover within the same advertising spaces rented by the Oriental Advertising Agency in 1914. For that very purpose, we have established scale of change ranging from 0 to 3:
The pie chart suggests that Oriental Advertising Agency's spaces are marked by a high degree of instability in wartime. The maximal degree of change (3) represent 56% of the changes, followed by changes of location (26%), identical revewal (10%) and change of dimensions. The measurements are based on the the census made by the S.M.C. in 1914 and the regular inventories of Oriental Advertising Agency's boards sent to the Council by the company itself, between May 1 and December 31, 1914. Source: SMA (SMC), U1-14-3251 (1139-1151), U1-14-3267 (1047-1049). |
 | 264 | Variations of advertising creativity in the Chinese newspaper Shenbao (1914-1949) | Les histogrammes ci-joints proposent de mesurer les variations de créativité publicitaire dans le quotidien chinois Shenbao sur la longue durée 1914-1949. Ces histogrammes ont été construits à partir des cinq échantillons habituels, étendus à une semaine continue (7-15 janvier 1914, 1-8 janvier 1924, 1-10 janvier 1934 - les éditions des 2 et 6 janvier manquant à l’appel ; 1er-7 février 1941 ; 1er-13 janvier 1949 - les éditions des 2, 3, 4, 8, 10 janvier manquant). On n’a comptabilisé que les marques facilement identifiables, les publicités offrant un degré de visualité suffisant et apparaissant plus d’une fois dans l’échantillon. Par souci de cohérence, on a repris l'échelle de créativité établie par ailleurs (voir la section "Drawings") : 0 pour les répétitions à l'identique, 1 pour les déplacements, 2 pour les altérations purement textuelles, 3 pour les modifications plus radicales de l'image ou de la composition. Pour accéder aux résultats précis du recensement, voir le tableau associé ("Series") dans la section "Tables". Dans le quotidien chinois Shenbao, le degré de créativité le plus élevé (3 : changement structural) l’emporte sur l’ensemble de la période (50% en moyenne), suivi par les changements de localisation (40%) et les répétitions à l’identique (10%). Derrière ces moyennes, on observe néanmoins d’importants écarts d’un échantillon à l'autre : la créativité maximale est atteinte en 1934-1941 (près de 70% de changement structural, contre 15 à 25% de déplacement et 5 à 15% de répétition à l’identique). Elle est minimale au début de la période : seules 20% des publicités s’efforcent de renouveler leur imagerie, contre 70% de déplacements et 10% de répétitions identiques. L’échantillon de 1924 présente un profil de créativité intermédiaire : 10% de répétitions identiques, 40% de déplacements et près de 50% de transformation radicale. On remarque que sur l’ensemble de la période, aucune des publicités recensées ne se contentent d’altérer simplement le texte d’un jour sur l’autre. On oscille entre les deux extrêmes de la répétition et de la variation créative. Pour une approche plus qualitative et incarnée par des cas précis, extraits de chaque échantillon, se reporter aux "échelles de créativité" exposées dans la section "Drawings". |
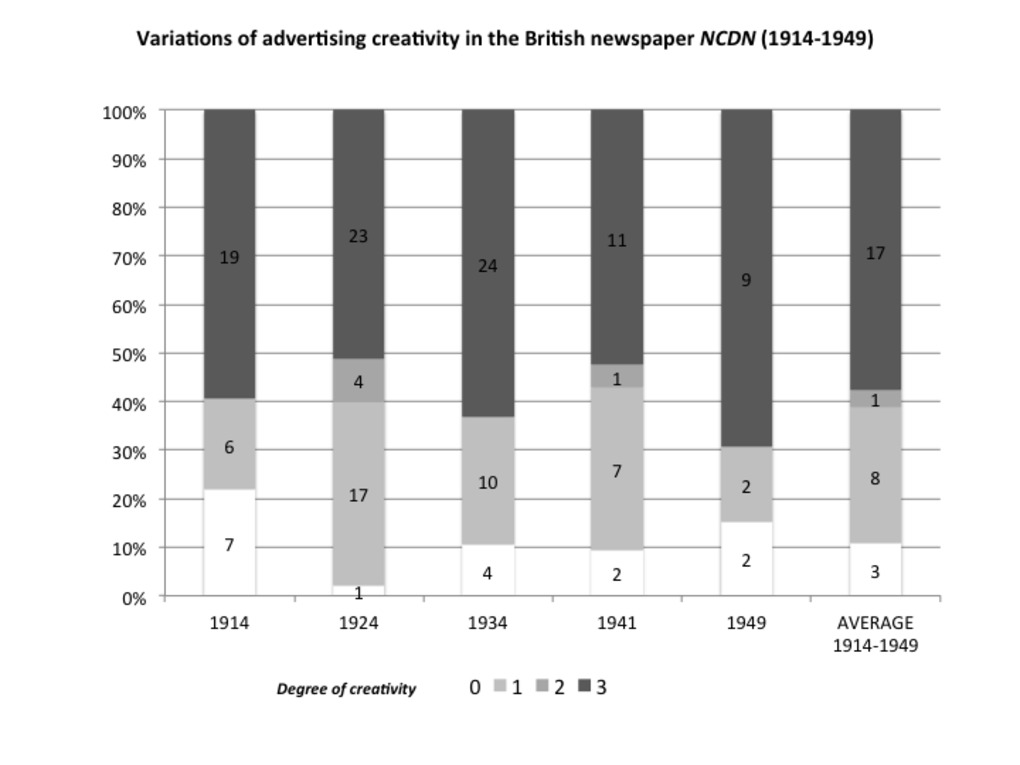 | 265 | Variations of advertising creativity in the British newspaper North China Daily News (1914-1949) | Les histogrammes ci-joints proposent de mesurer les variations de créativité publicitaire dans le quotidien britannique North China Daily News sur la longue durée 1914-1949. Ces histogrammes ont été construits à partir des cinq échantillons habituels, étendus à une semaine continue (7-15 janvier 1914, 1-8 janvier 1924, 1-10 janvier 1934 - les éditions des 2 et 6 janvier manquant à l’appel ; 1er-7 février 1941 ; 1er-13 janvier 1949 - les éditions des 2, 3, 4, 8, 10 janvier manquant). On n’a comptabilisé que les marques facilement identifiables, les publicités offrant un degré de visualité suffisant et apparaissant plus d’une fois dans l’échantillon. Par souci de cohérence, on a repris l'échelle de créativité établie par ailleurs (voir la section "Drawings") : 0 pour les répétitions à l'identique, 1 pour les déplacements, 2 pour les altérations purement textuelles, 3 pour les modifications plus radicales de l'image ou de la composition. Pour accéder aux résultats précis du recensement, voir le tableau associé ("Series") dans la section "Tables". Le quotidien britannique suit une trajectoire moins régulière que son homologue chinois (voir "Related Data"). Sa créativité moyenne surpasse légèrement celle du Shenbao : 60% pour le seuil maximal, 30% de déplacements (degré 1) et 10% de répétition identique (degré 0). La créativité publicitaire dans le North China Daily News fluctue très fortement d’un échantillon sur l’autre. On observe une nette alternance entre des phases très créatives (1914, 1934, 1949) entrecoupées de phases moins créatives (1924 et 1941). Dès 1914, le 3e degré atteint 60% contre 20% chacun pour les degré 0 et 1. En 1934, la créativité maximale se maintient autour de 60%, mais la mobilité double presque (30%), tandis que les répétitions sont plus rares (10%). Le journal atteint un record de créativité en 1949 (70% pour le 3e degré), 15% de déplacement et autant de répétitions. Dans ses phase les moins créatives en 1924 et 1941, la moitié des publicités atteint malgré tout le degré maximal de variation. Les répétitions identiques et les altérations purement textuelles restent rares (moins de 10% voire 5%). Les déplacements sont alors une forme de variation privilégiée : près de 40% des publicités en 1924, et 30% en 1941. En définitive, la créativité publicitaire dans le quotidien britannique North China Daily News est légèrement supérieure, antérieure mais aussi plus instable et plus variée que dans le quotidien chinois Shenbao sur la longue durée 1914-1949. Pour une approche plus qualitative et incarnée par des cas précis, extraits de chaque échantillon, se reporter aux "échelles de créativité" exposées dans la section "Drawings". |
 | 266 | Millington, Ltd: Profit and loss accounts (1927-1941) | This graph shows the fluctuations of profits and loss accounts of one of the main Shanghai-based advertising agency Millington, Ltd from its founding in 1927 until 1941. The figures are based on reports from boards of directors and annual general meetings either published in the local press (China Press, North China Herald), or hold in the Shanghai Municipal Archives (SMA_Q275-1-1840). The graph reveals that after a period of rapid and spectacular growth (1927-1931), the company suffered from serious losses between 1932-1935), probably due to the war in Shanghai in 1932-1933 and the economic depression that followed. The firm's situation shortly improved in Spring 1935, at the cost of a drastic reduction of its capital. Millington, Ltd. went through hard times again in the wake the bombing of Shanghai in August 1937. The first semester of the year 1938 was said to be the worst time experienced by the company during its entire life. Yet it prompty recovered and eventually recorded the best profits ever known in its history at the last annual general meeting in 1941. This case study suggests that even the strongest companies in Shanghai might suffer from political and economic troubles at various scales - not only in Shanghai, but in China and the world, especially in the case of a worldwide-connected agency like Millington, Ltd. Yet, the impacts of political events and economic conjoncture on advertising business are far from being clear and simple to reveal and interpret. The impacts of events or crisis may be postponed and experienced at a more or less later time by the company. Moreover, other internal factors, related to the specific history of the company, may interefere. As far as Millington is concerned, the crisis in Shanghai may have been either counterbalanced, either aggravated, by the profits or losses made by other branches in Hongkong and Singapore. This graph finally suggests that war is not always or necessarily detrimental to the advertising business - quite the contrary. Although Millington Ltd seemed to suffer from the first war in Shanghai in 1932-1933, and immediately after the bombing in August 1937, the war period between 1938-1940 appeared to be the most profitable time for the company in its entire history. |
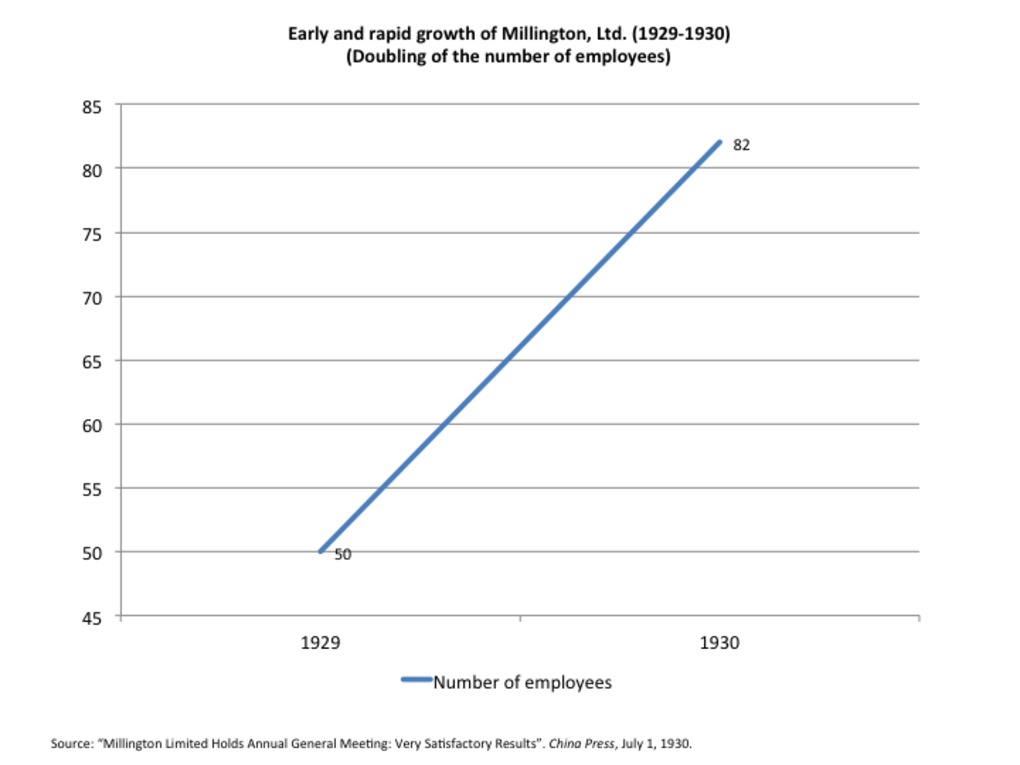 | 267 | Early and rapid growth of Millington, Ltd (1929-1930) | This set of three graphs shows offers three ways of measuring the rapid growth of the Millington, Ltd advertising agency shortly after its funding in 1927: first, by the doubling of the number of employees; second, by the doubling of the number of artists employed; last, by the number of the advertising boards erected in the streets of Shanghai. These graphs have been made after reports of Millington annual general meeting published in the local press in July 1930 (Source: “Millington Limited Holds Annual General Meeting: Very Satisfactory Results”. China Press, July 1, 1930). |
 | 268 | Millington’s investments in outdoor and indoor advertising (in $) (1929-1930) | This set of two graphs (pie charts and surface graph lines) shows the distribution and growth of Millington's investments in "indoor" (printed) and outdoor advertising (in $). The pie charts reveal a quite equal distribution between both types of advertising media. Though indoor advertising slighly dominated over outdoor advertising in 1929 (53%, almost 62000 $), outdoor advertising tended to take the advantage in 1930, both in ratio and amounts of money invested (52%, more than 100 000 $). |
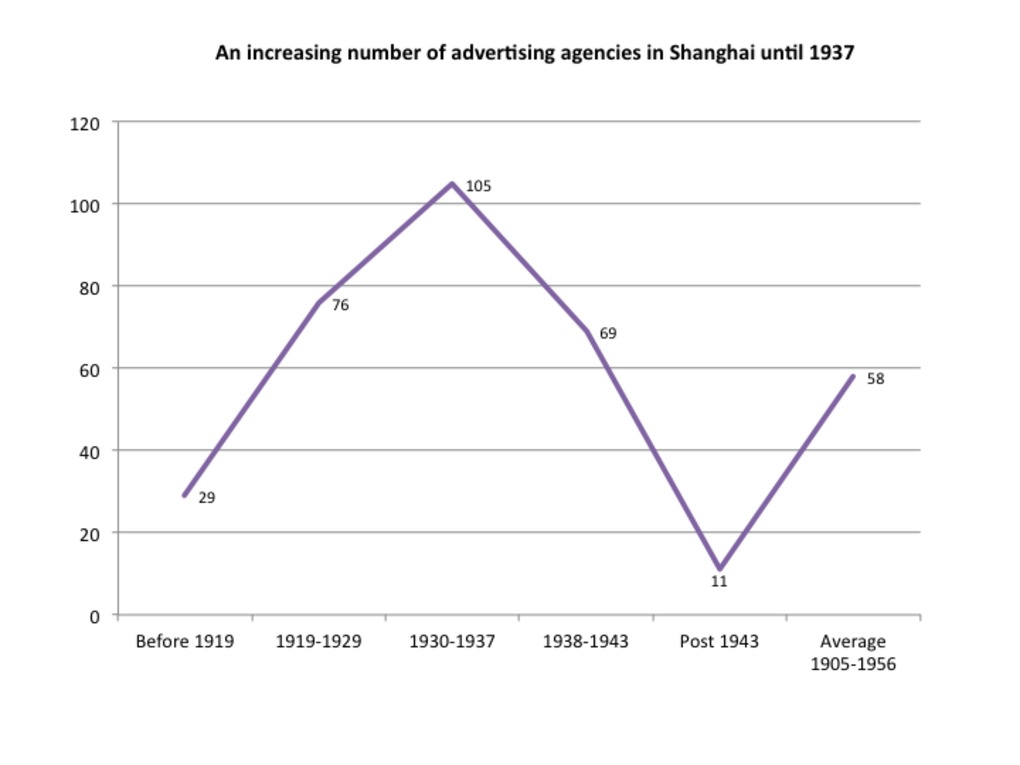 | 269 | Growth of advertising agencies in Shanghai (1905-1956) | This graph line aims to show the gradual development of advertising agencies in Shanghai. Their number more than doubled in the 1920s, then reached a climax in the 1930, and started to decline during the war 1937-1945. Yet the role of advertising agencies as central actors in the advertising profession was well established. The decline is mainly due to the departure of foreigners during the war, especially after the United States entered the war in Dec 1941, and after the restitution of foreign settlements in 1943. In 1956, the number of agencies was drastically reduced from about 60 to only 4, through a process of merging summoned by the governement at a national scale. The figures are based on the Shanghai Municipal Archives and other secondary sources (Bankers' Directory, 1933; Hong List, 1941; Morgan, 2003). |
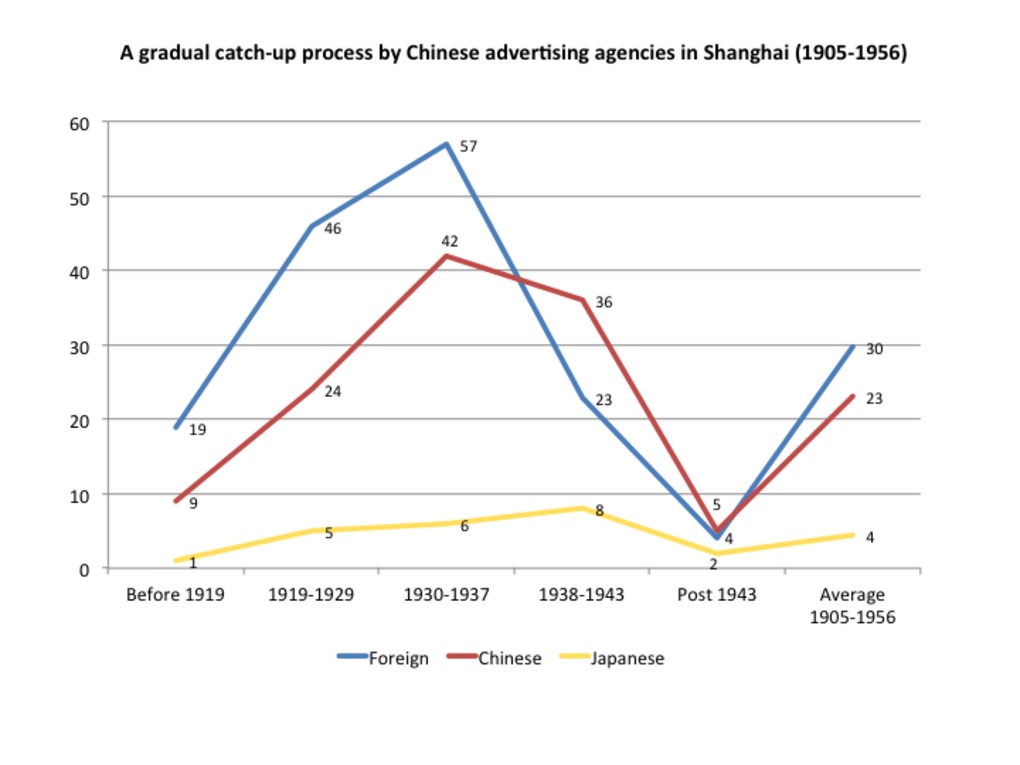 | 270 | Gradual catch-up process by Chinese advertising agencies in Shanghai (1905-1956) | This graph line aims to show the rapid growth of Chinese advertising agencies in Shanghai and gradual catch-up process in the long-term. While foreign agencies were far more numerous until 1929, the number of Chinese advertising agencies more than doubled in the 1920s (from 9 in 1919 to 24 in 1929) and 1930s (from 24 in 1930 to 42 in 1937). Although they experienced a slight decline during the war 1937-1945, Chinese agencies eventually led the profession in Shanghai at the end of the period (36 Chinese vs. 23 Western, and only 8 Japanese). This was mainly due to the massive departure of foreigners after December 1941 and the restitution of foreign settlements in 1943. Despite a gradual growth (from 1 in 1919 to 8 during the war 1938-1943), Japanese agencies remained but a minority during the entire period. The figures are based on the Shanghai Municipal Archives and other secondary sources (Bankers' Directory, 1933; Hong List, 1941; Morgan, 2003). |
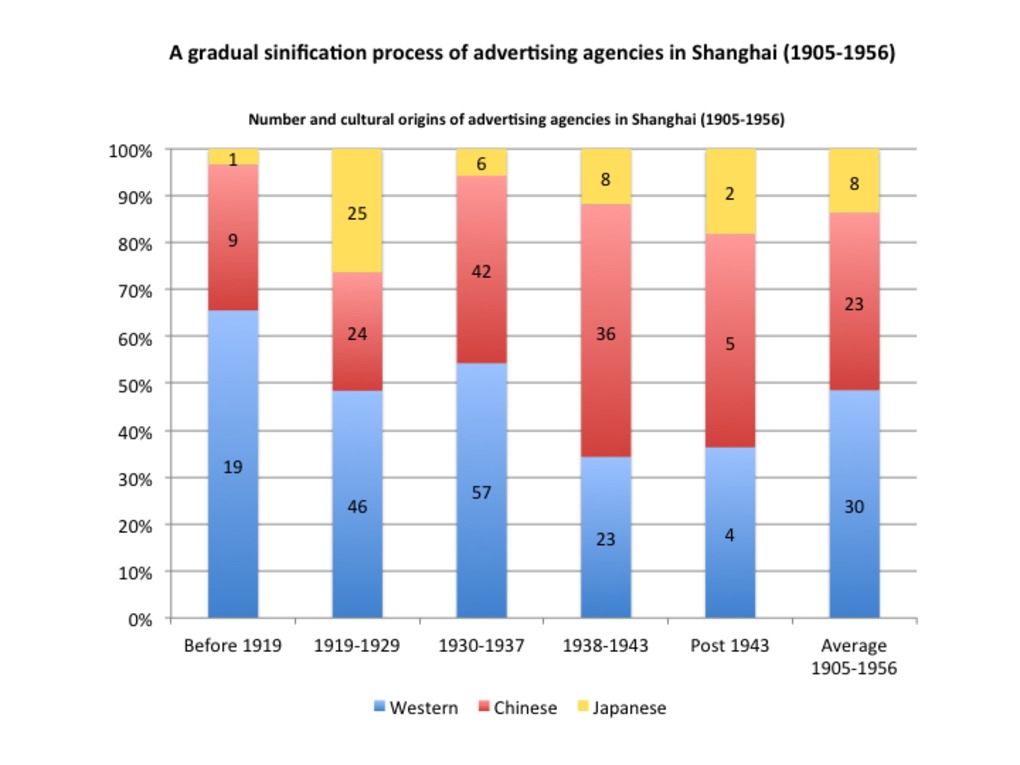 | 271 | Gradual sinification process of advertising agencies in Shanghai (1905-1956) | This bar chart aims to show the sinification process of the advertising profession in Shanghai. While foreign agencies represented 65% of all agencies in Shanghai in 1919, their share gradually declined in the long term 1919-1943. Though they still represented a short majority between 1919-1937, their share fell down to 35% at the end of the period (1938-1956). Their decline proved beneficial to Chinese agencies, whose share climbed from 30% in 1919 to almost 60% during the war 1938-1945. Japanese agencies remained a minority in Shanghai: an average of only 15% during the entire period, only 5% in 1915 (1 agency) and a maximum of 25% in the 1920s. The figures are based on the Shanghai Municipal Archives and other secondary sources (Bankers' Directory, 1933; Hong List, 1941; Morgan, 2003). |
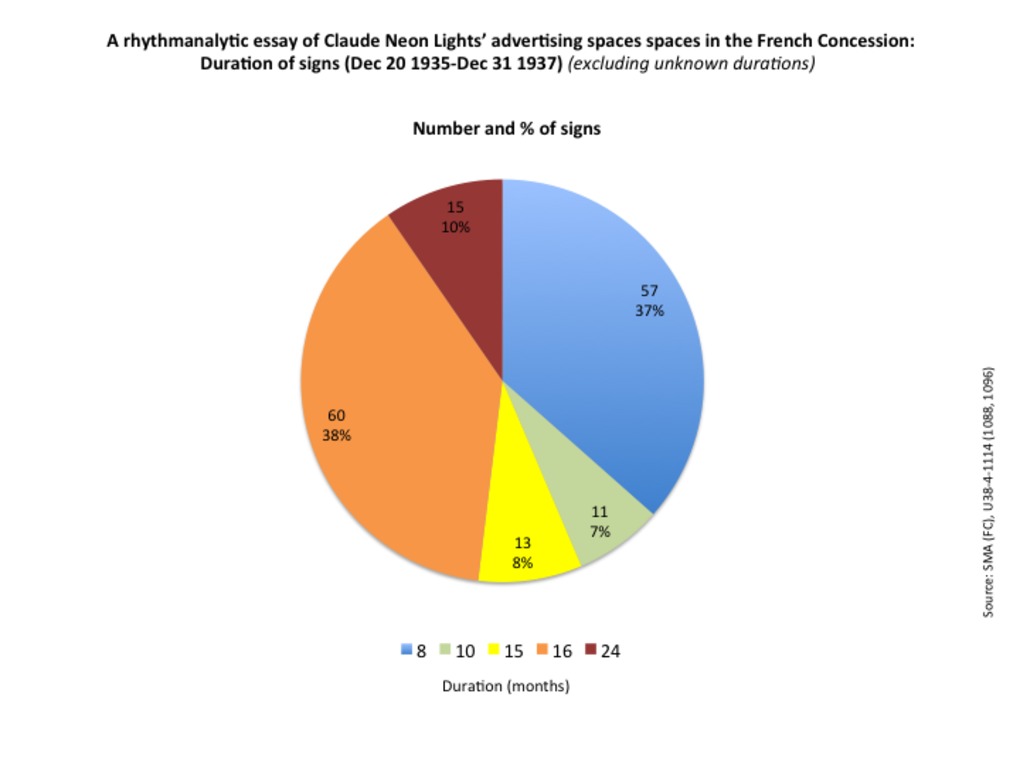 | 272 | A rhythmanalytic essay of Claude Neon Lights’ advertising spaces spaces in the French Concession: Duration of signs (Dec 20 1935-Dec 31 1937) | These set of three charts aims to evaluate the lifetime of Claude Neon Lights' signs in the French Concession between Dec 20, 1935 and Dec 31, 1937. The figures are based on the regular lists of signs that Claude Neon Lights sent to the French Municipal Council between December, 20 1935 and December, 31 1937, plus a few scattered signs recorded in other files in the Shanghai Municipal Archives (French concession and International Settlement in 1931 and 1941). Source: SMA (FC), U38-4-1114; SMA (SMC), U1-14-3261 (0246). The first pie chart ignores the boards for which we do not know the date of removal or end of contract. The second pie chart includes those under-documented artifacts (48%). The last bar charts compare the average, minimal, and maximal duration of contracts. Both pie charts reveal that Claude Neon Lights' signs enjoyed a longer lifetime than Oriental Advertising's boards in 1914. While the latter had lived for less than a year, 66% of the former lasted more than one year, 10% of which had lived for at least 2 years. This temporal lag may be due to the nature of the medium (boards being more temporary than signs, attached to a shop or a building), as well as the relative period of prosperity in the 1930 (in contrast with the war period). Yet it remains questionable to compare figures based on documentation of variable quality and length. |
 | 273 | A rhythmanalytic essay of Claude Neon Lights’ advertising spaces spaces in the French Concession: Duration of contracts/occupation of signs by advertisers (Dec 20 1935-Dec 31 1937) | These set of three charts aims to evaluate the duration of Claude Neon Lights' contracts with various clients in the French Concession between Dec 20, 1935 and Dec 31, 1937. The figures are based on the regular lists of signs that Claude Neon Lights sent to the French Municipal Council between December, 20 1935 and December, 31 1937, plus a few scattered signs recorded in other files in the Shanghai Municipal Archives (French concession and International Settlement in 1931 and 1941). Source: SMA (FC), U38-4-1114; SMA (SMC), U1-14-3261 (0246). The first pie chart ignores the boards for which we do not know the date of removal or end of contract. The second bar chart show the average, minimal and maximal duractions of contracts.
|
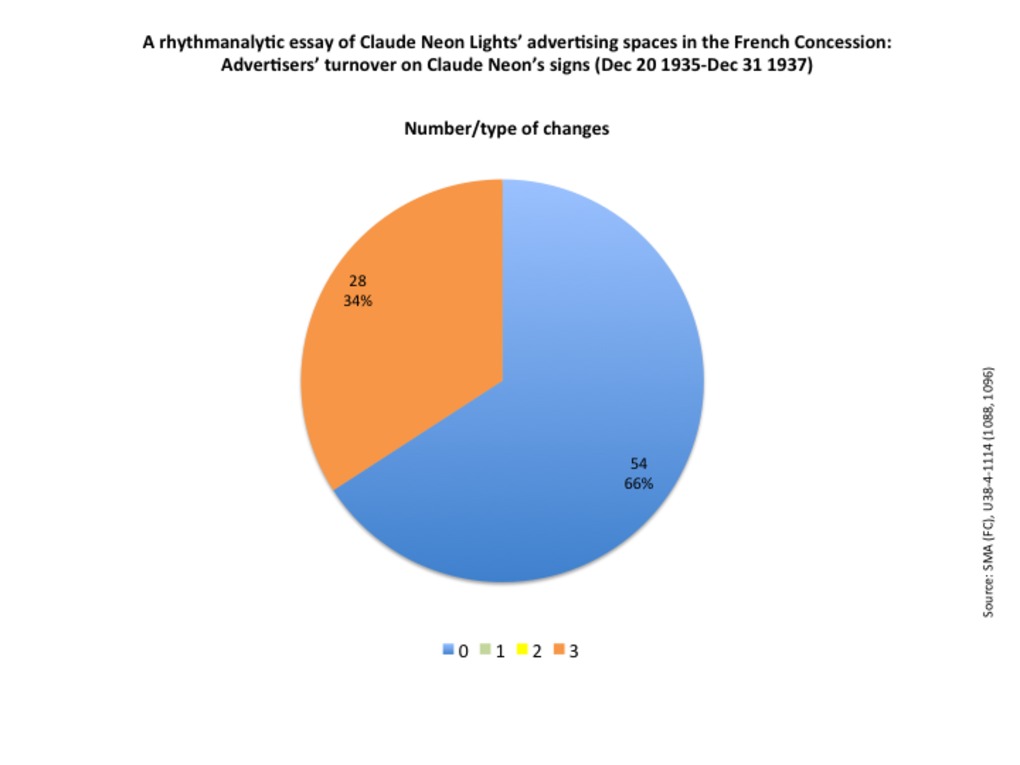 | 274 | Advertiser’s turnover on Claude Neon’s signs in the French Concession (Dec 20 1935-Dec 31 1937) | These set of three charts aims to refine the rhythmanalysis based on contracts duraction by appreciating the nature and degree of turnover within the advertising spaces owned by Claude Neon Lights between 1935 and 1937. For that very purpose, we have established scale of change ranging from 0 to 3:
The pie chart clearly reveals that Claude Neon Lights' signs enjoyed a relatively high degree of stability: 2/3 of signs remained unchanged during the entire period, while only 1/3 had experienced a change of advertiser. On can note that there is no intermediary changes, in terms of location or dimension (either a change of owner, either no change at all). This is due to the nature of the sign itsefl, firmly attached to the shop or building, with fixed dimensions. The measurements are based on the regular lists of signs that Claude Neon Lights sent to the French Municipal Council between December, 20 1935 and December, 31 1937, plus a few scattered signs recorded in other files in the Shanghai Municipal Archives (French concession and International Settlement in 1931 and 1941). Source: SMA (FC), U38-4-1114; SMA (SMC), U1-14-3261 (0246). |
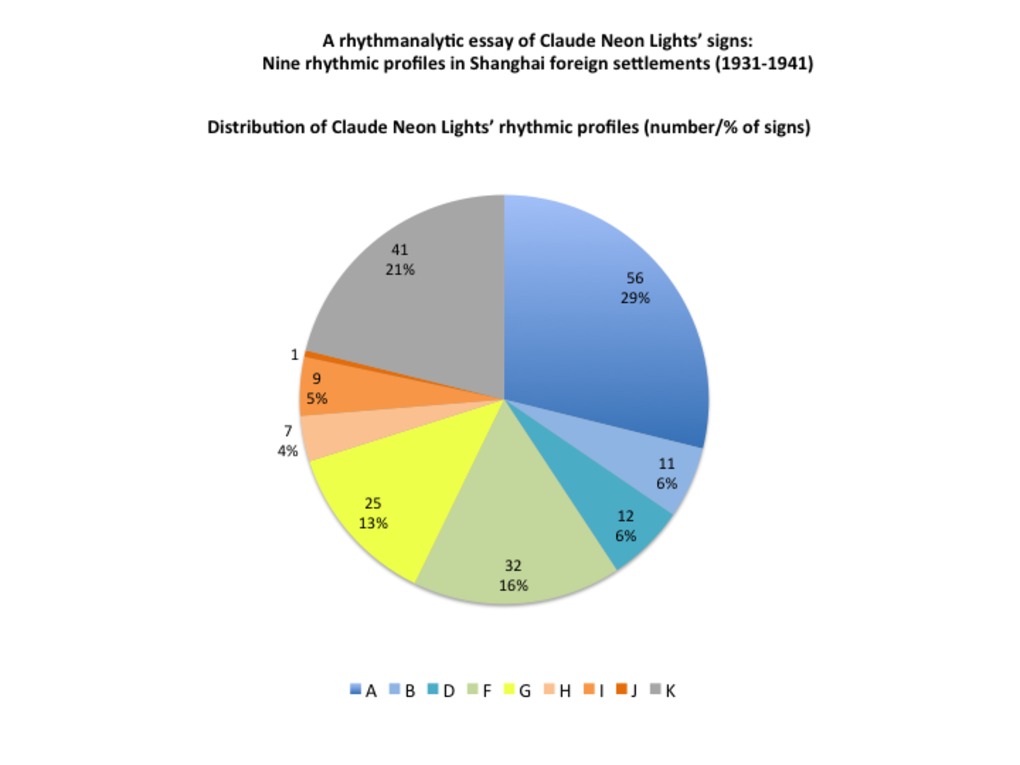 | 275 | A rhythmanalytic essay of Claude Neon Lights’ signs: Nine rhythmic profiles in Shanghai foreign settlements (1931-1941) | This table and the related pie aims to further refine the rhythmanalysis based on signs or advertisers' duraction by combining signs duration and the number of advertisers they respectfully hosted. Such combination has resulted in establishing nine rythmic profiles, noted by a letter from A to K (unknown). The typology is explained in the table, and the share occupied by each rhythmic profile is measured on the pie chart.
The pie chart shows that signs that enjoyed the shortest lifetime with a single advertiser lead the way (almost 30%), followed by longer signs with a single advertiser as well. Signs hosting two or more advertisers represent only a small minority, and the longer, the fewer (13% for shorter signs, and less than 10% for the longest signs). The measurements are based on the regular lists of signs that Claude Neon Lights sent to the French Municipal Council between December, 20 1935 and December, 31 1937, plus a few scattered signs recorded in other files in the Shanghai Municipal Archives (French concession and International Settlement in 1931 and 1941). Source: SMA (FC), U38-4-1114; SMA (SMC), U1-14-3261 (0246). |
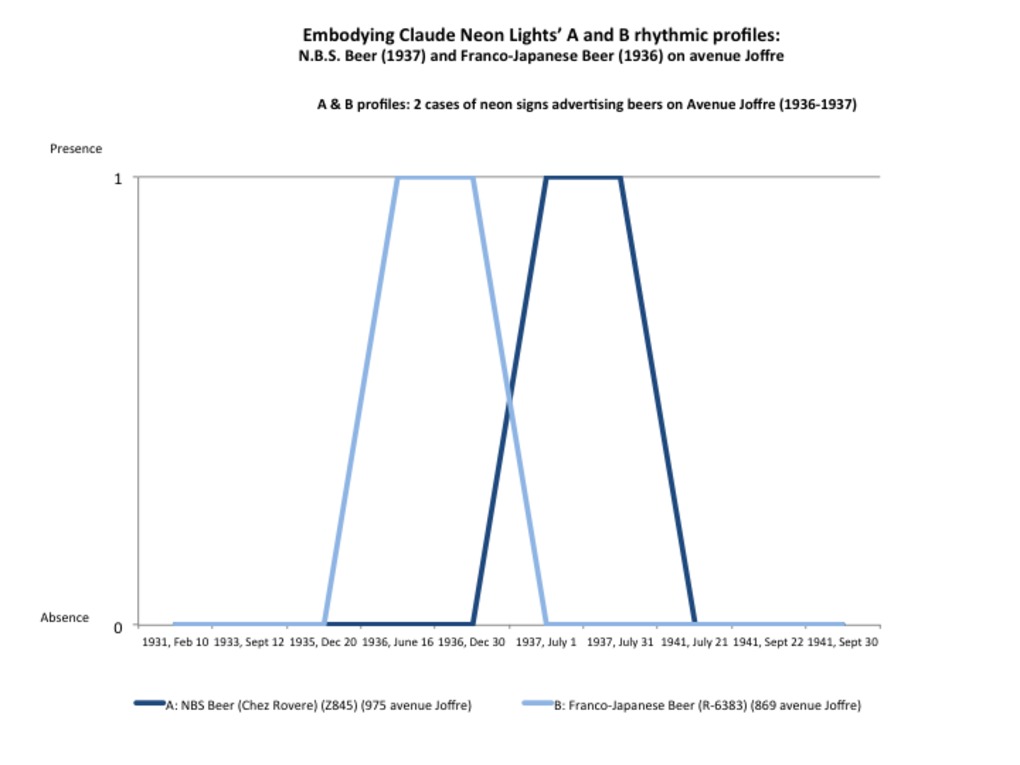
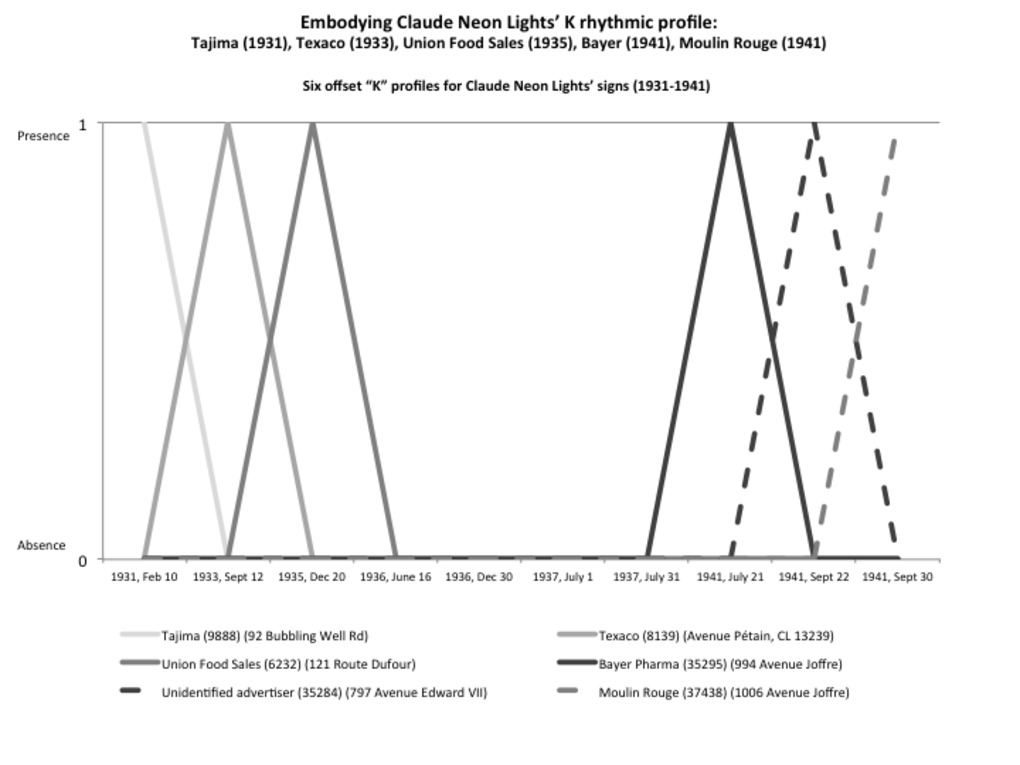 | 276 | A rhythmanalytic essay of Claude Neon Lights’ signs: Embodying the K rhythmic profile (1931-1941) | In order to re-embody to figure and abstract typology of rhythms, this set of graphs aims to trace the lifetime a well-identified sign for each rhythmic profile as described in the related table (see "Related Document"). On this graph, five case studies have been selected to embody the "K" profile (unknown duration). The measurements are based on the regular lists of signs that Claude Neon Lights sent to the French Municipal Council between December, 20 1935 and December, 31 1937, plus a few scattered signs recorded in other files in the Shanghai Municipal Archives (French concession and International Settlement in 1931 and 1941). Source: SMA (FC), U38-4-1114; SMA (SMC), U1-14-3261 (0246). |
 | 277 | A rhythmanalytic essay of Claude Neon Lights’ signs: Embodying the A, B, D, F and H rhythmic profiles (1935-1937) | In order to re-embody to figure and abstract typology of rhythms, this set of graphs aims to trace the lifetime a well-identified sign for each rhythmic profile as described in the related table (see "Related Document"). This set of five graphs precisely aim to embody the profiles with a single advertiser - namely A, B, D, F and H. The measurements are based on the regular lists of signs that Claude Neon Lights sent to the French Municipal Council between December, 20 1935 and December, 31 1937, plus a few scattered signs recorded in other files in the Shanghai Municipal Archives (French concession and International Settlement in 1931 and 1941). Source: SMA (FC), U38-4-1114; SMA (SMC), U1-14-3261 (0246). |
 | 278 | A rhythmanalytic essay of Claude Neon Lights’ signs: Embodying the G, I and J rhythmic profiles (1935-1937) | In order to re-embody to figure and abstract typology of rhythms, this set of graphs aims to trace the lifetime a well-identified sign for each rhythmic profile as described in the related table (see "Related Document"). This set of five graphs precisely aim to embody the profiles with a two or more advertisers - namely G, I and J. The measurements are based on the regular lists of signs that Claude Neon Lights sent to the French Municipal Council between December, 20 1935 and December, 31 1937, plus a few scattered signs recorded in other files in the Shanghai Municipal Archives (French concession and International Settlement in 1931 and 1941). Source: SMA (FC), U38-4-1114; SMA (SMC), U1-14-3261 (0246). |
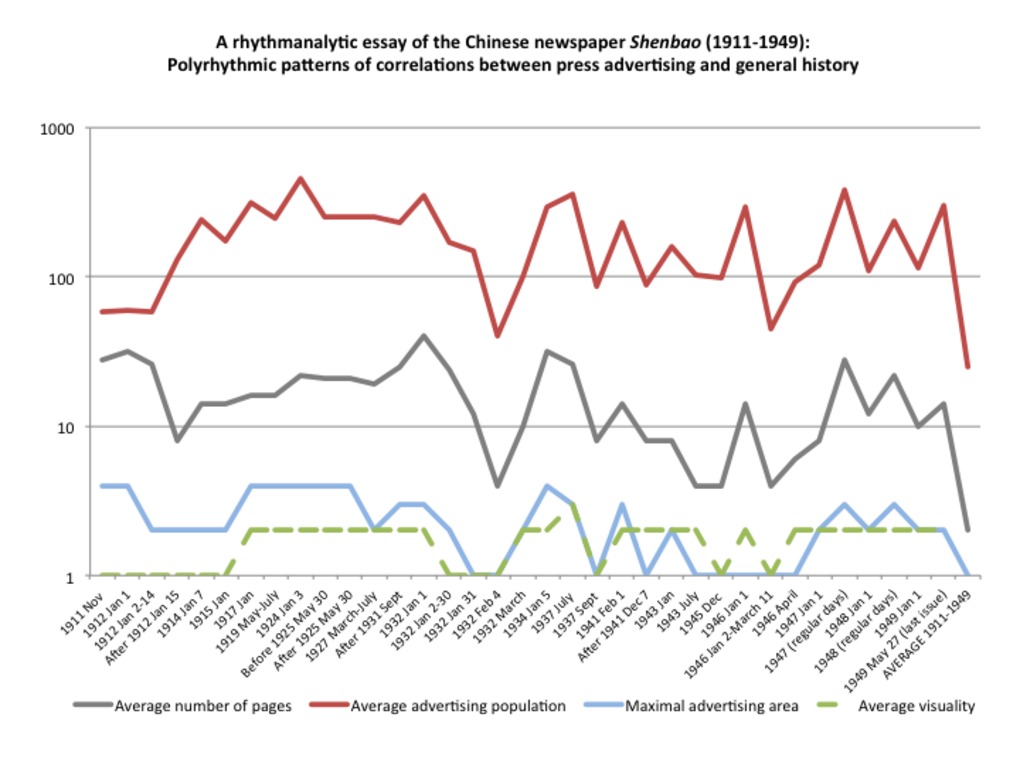 | 279 | Polyrhythmic patterns of correlations between general history and press advertising in the newspapers Shenbao and North China Daily News (1904-1951) | This set of two graphs aims to analyze polyrhythmic patterns of correlations between general history and press advertising. For that very purpose, we have first identified and listed in the related table a series of "conventional" events (i.e. recognized as "major" events in conventional chronologies of Shanghai, China and world history) (See the "Tables" section). For each event, we have then selected a relevant sample of the Chinese newspaper Shenbao and its British counterpart North China Daily (when available) - i.e. an edition published more or less shortly after the selected event. In order to measure the potential effect of each event on newspaper advertising, we have eventually established four material criteria:
Finally, the figures have been visualized on the following graph lines. The first graph traces the lifeline of the Chinese newspaper Shenbao (1911-1949), while the second graph follows the trajectory of the British newspaper North China Daily News (1904-1951). Four main observations emerged from these graphs: 1. The number of pages and ads appeared more directly affected than areas and visuality. 2. The nature, degree, moment and duration of event impact may vary according to specific event. Events impacts are often unpredictable, if not unexpected:
NB It is questionable whether or not contemporary events (for instance, 1925, 1927) can be credited for those changes in newspaper advertising (for instance, the spectacular ten-year expansion between 1925-1935). What these graphs reveal are nothing more than correlations. Yet correlations are not evidence. As any visualization, these tables/graphs may only unveil invisible patterns, open new research questions, and possibly suggest alternative paths of interpretation. By juxtaposing the Shenbao and North China Daily News (NCDN) graphs, two further observations may be made: 3. The chaotic lifeline of the Shenbao suggests that the Chinese newspaper might be more sensitive to historical conjoncture than the British newspaper. In effect, the NCDN enjoyed a remarkable stability until the Second World War (more precisely after the US entered the war in Dec 1941). Then the NCDN so deeply suffered from the war and the restitution of foreign settlements that it never recovered, even though he survived the Chinese newspaper (which ended on May 27, 1949) until March 31, 1951. 4. Despite its higher sensitivity to historical events, the Shenbao eventually managed to overcome recurrent troubles, recovering more or less rapidly after each crisis. That capacity to recover after each crisis may explain the oscillating appearance of the graph line. NB The more cahotic line of the Shenbao may also reflects a distorsion in the method of sampling. As many editions of the North China Daily News are missing, it has not be possible to examine as many samples as we did for the Chinese newspaper Shenbao. |
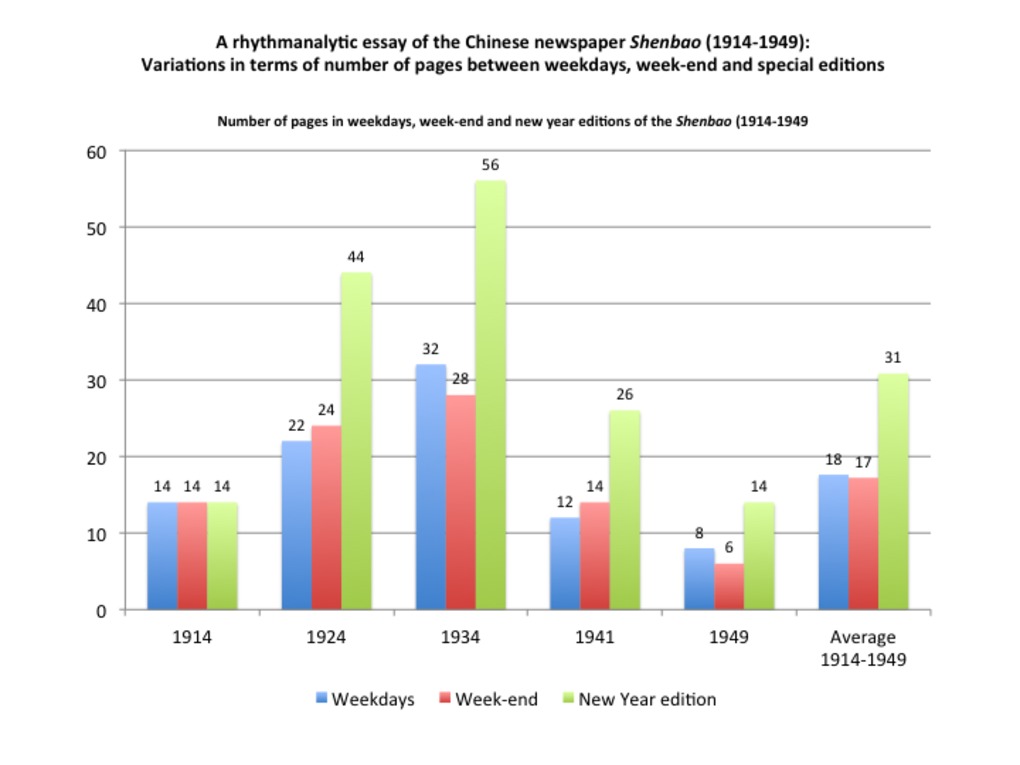 | 280 | A rhythmanalytic essay of the Chinese newspaper Shenbao: three ways of measuring variations between weekdays, week-end and special editions (1914-1949) | This set of three bar charts aims to compare weekdays, week-end and special editions (New Year) of the Chinese newspaper Shenbao between 1914 and 1949. My purpose here is to identify variations in the material dimensions of the newspaper and its advertising spaces. For that very purpose, our five usual samples (Jan 7, 1914, Jan 3 1924, Jan , 1934, Feb 1, 1941, Jan 1, 1949) have been contrasted to week-end and special editions published more or less at the same time. The list of selected samples is provided in the associated table (see the "Tables" section). In each sample issue, we have then measured the three following criteria, directly borrowed from the first and second chapters of my dissertation: number of pages in the issue, advertsing population (number of advertisements in the same issue), advertising area (precisely, the maximal area covered by a single advertisement, on a scale ranging from 0, for subdistricts covering less than 10% of the page, to 4, refering to advertising "empires", i.e. full-page advertisements). The first set of bar charts aims to measure variations in terms of number of pages between weekdays (in blue), week-end (red) and New Year (green) editions. The second bar charts does the same in terms of advertising population, while the third and last graph proceeds in a similar fashion for measuring advertising areas. These graphs reveal two main findings: (1) While there are no obvious differences between weekdays and week-end or special editions at early times (1914) - especially in the North China Daily News (NCDN), which was not published on Sundays, and whose New Year edition is not available that year - and very slight variations at the end of the period (1941-1949), the strongest contrasts are to be found in the 1920-1930s editions, especially in Chinese newspaper Shenbao, whose number of pages more than doubled in New Year editons (Jan 1 1924 and 1934). (2) The number of pages and advertisements are more subject to variations than advertising areas, which usually remained the same, except for New Year editions which are more encouraging to full-page advertisements, especially in the 1930s. By juxtaposing the graphs of the Chinese and British newspapers, two further observations shall be made: (3) The Chinese newspaper Shenbao shows stronger contrasts (between weekdays, week-end and New Year editions) than the British newspaper. Compared to the Chinese newspaper, the NCDN appeared very stable, if not conservative, from one day to another. In 1914 and 1924, it was not published on Sundays (the Sunday edition was probably replaced by its weekly edition, the North China Herald). The sharpest contrasts are to be found in the 1930s, due to the publications of Sunday magazines and special editions (70th Anniversary supplement on July 29, 1934). At the end of the period, (1941-1949), the NCDN appeared more repetitive than ever, probably due to the reduction of expenses and creativity during wartime. (4) Paradoxically, the Chinese newspaper proved more affected by the Western New Year than its British counterpart NCDN. The Chinese editors seemed to have cleverly appropriated the Western tradition as a profitable opportunity for expanding newspaper and advertising spaces. By contrast, the NCDN New Year edition had nothing special. From 1914 to 1949, it appeared quite similar to ordinary editions. |
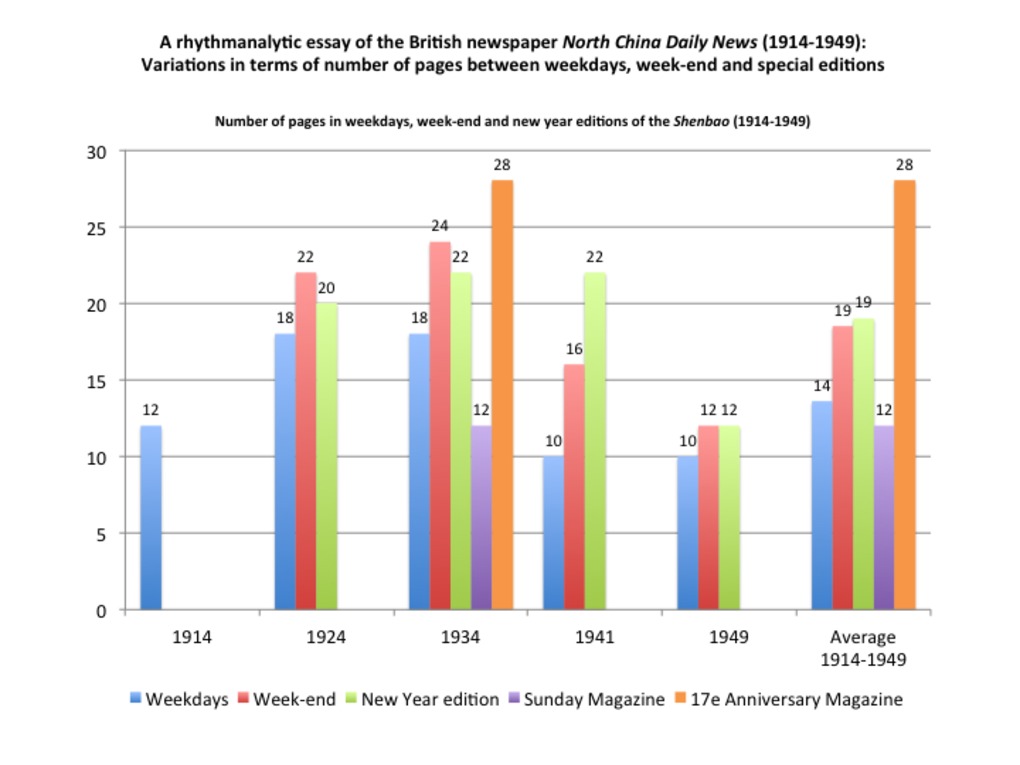 | 281 | A rhythmanalytic essay of the British newspaper North China Daily news: three ways of measuring variations between weekdays, week-end and special editions (1914-1949) | This set of three bar charts aims to compare weekdays, week-end and special editions (New Year) of the Biriths newspaper North China Daily News between 1914 and 1949. My purpose here is to identify variations in the material dimensions of the newspaper and its advertising spaces. For that very purpose, our five usual samples (Jan 7, 1914, Jan 3 1924, Jan , 1934, Feb 1, 1941, Jan 1, 1949) have been contrasted to week-end and special editions published more or less at the same time. The list of selected samples is provided in the associated table (see the "Tables" section). In each sample issue, we have then measured the three following criteria, directly borrowed from the first and second chapters of my dissertation: number of pages in the issue, advertsing population (number of advertisements in the same issue), advertising area (precisely, the maximal area covered by a single advertisement, on a scale ranging from 0, for subdistricts covering less than 10% of the page, to 4, refering to advertising "empires", i.e. full-page advertisements). The first set of bar charts aims to measure variations in terms of number of pages between weekdays (in blue), week-end (red), New Year editions (green), 1930s Sunday magazine (orange) and special Anniversary magazine (purple) in the 1930s. The second bar charts does the same in terms of advertising population, while the third and last graph proceeds in a similar fashion for measuring advertising areas. These graphs reveal two main findings: (1) While there are no obvious differences between weekdays and week-end or special editions at early times (1914) - especially in the North China Daily News (NCDN), which was not published on Sundays, and whose New Year edition is not available that year - and very slight variations at the end of the period (1941-1949), the strongest contrasts are to be found in the 1920-1930s editions, especially in Chinese newspaper Shenbao, whose number of pages more than doubled in New Year editons (Jan 1 1924 and 1934). (2) The number of pages and advertisements are more subject to variations than advertising areas, which usually remained the same, except for New Year editions which are more encouraging to full-page advertisements, especially in the 1930s. By juxtaposing the graphs of the Chinese and British newspapers, two further observations shall be made: (3) The Chinese newspaper Shenbao shows stronger contrasts (between weekdays, week-end and New Year editions) than the British newspaper. Compared to the Chinese newspaper, the NCDN appeared very stable, if not conservative, from one day to another. In 1914 and 1924, it was not published on Sundays (the Sunday edition was probably replaced by its weekly edition, the North China Herald). The sharpest contrasts are to be found in the 1930s, due to the publications of Sunday magazines and special editions (70th Anniversary supplement on July 29, 1934). At the end of the period, (1941-1949), the NCDN appeared more repetitive than ever, probably due to the reduction of expenses and creativity during wartime. (4) Paradoxically, the Chinese newspaper proved more affected by the Western New Year than its British counterpart NCDN. The Chinese editors seemed to have cleverly appropriated the Western tradition as a profitable opportunity for expanding newspaper and advertising spaces. By contrast, the NCDN New Year edition had nothing special. From 1914 to 1949, it appeared quite similar to ordinary editions. |
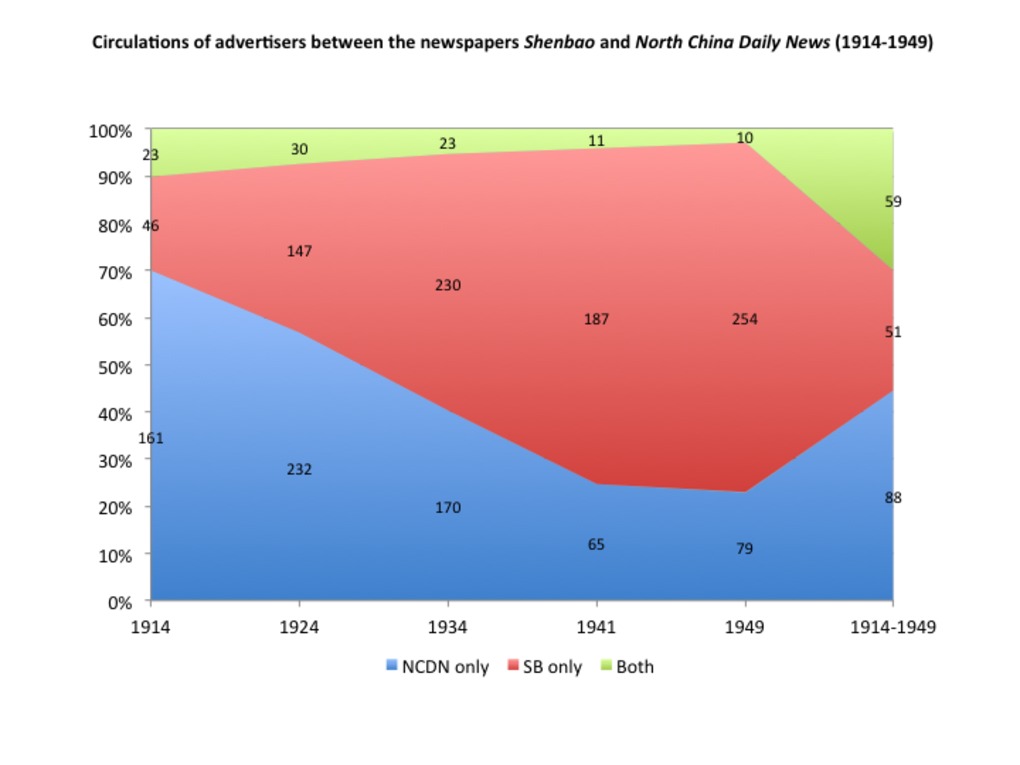 | 282 | Advertisers circulating between the newspapers Shenbao and North China Daily News (1914-1949) | Ce graphique a été réalisé à partir de la table associée : http://madspace.org/cooked/Tables?ID=158 |
 | 283 | Advertisers circulating between the press and streets of Shanghai (1905-1949) | Ce graphique a été réalisé à partir de la table associée : http://madspace.org/cooked/Tables?ID=158 |
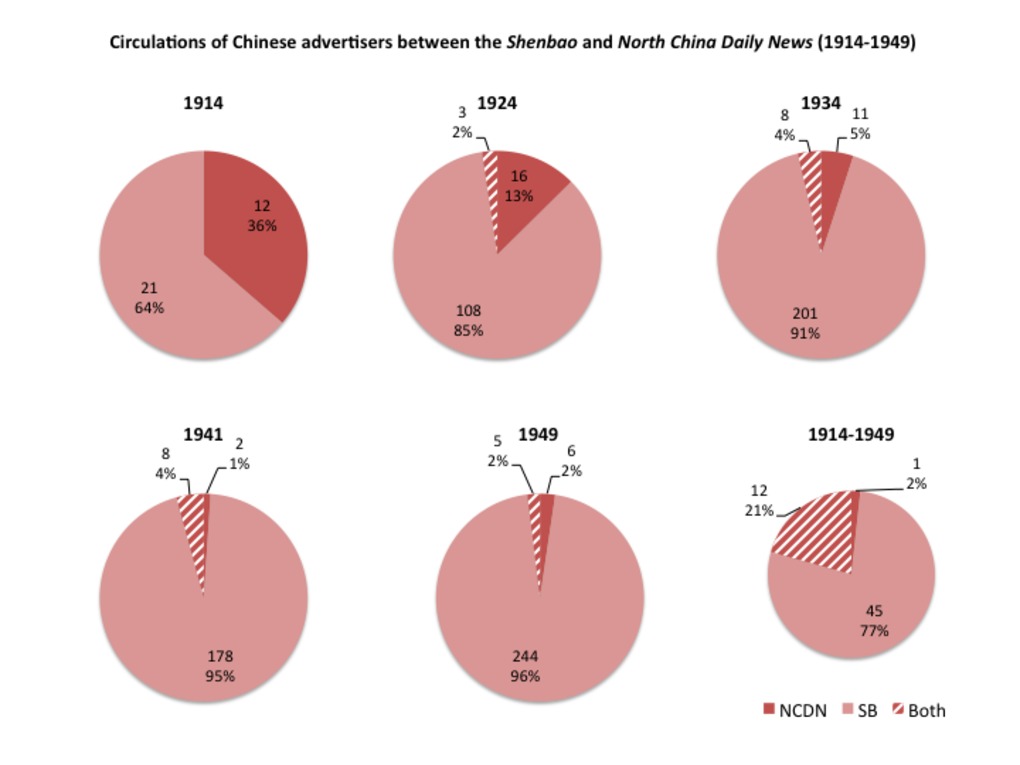 | 284 | Advertisers circulating within the Shanghai press, according to their nationalities: Chinese, Western, Japanese (1914-1949) | Ce triple jeu de six camemberts chacun suit les circulations (ou les blocages) des annonceurs entre le quotidien chinois Shenbao et son homologue britannique North China Daily News, en fonction de leur nationalité. L'objectif est de savoir si certaines "nationalités" sont plus mobiles que d'autres, si les circulations sont multilatérales ou unilatérales d'un journal à l'autre. Ce tableau a été réalisé à partir de la table associée : http://madspace.org/cooked/Tables?ID=158 Le premier ensemble de camemberts suit les annonceurs chinois (rouge), le deuxième les annonceurs "occidentaux" (européens et américains) en bleu, le troisième procède de même pour les annonceurs japonais (en jaune). |
 | 285 | Advertisers circulating between the press and streets of Shanghai, according to their nationalities: Chinese, Western, Japanese (1905-1949) | Ce triple jeu de six camemberts chacun suit les circulations (ou les blocages) des annonceurs la presse et les rues de Shanghai, en fonction de leur nationalité. L'objectif est de savoir si certaines "nationalités" sont plus mobiles que d'autres, si les circulations sont multilatérales ou unilatérales d'un espace à l'autre. Ce tableau a été réalisé à partir de la table associée : http://madspace.org/cooked/Tables?ID=158 Le premier ensemble de camemberts suit les annonceurs chinois (rouge), le deuxième les annonceurs "occidentaux" (européens et américains) en bleu, le troisième procède de même pour les annonceurs japonais (en jaune). |
 | 286 | Advertisers circulating within the Shanghai press, according to their business sector: appearance (B) and culture (C) (1914-1949) | Ce triple jeu de six camemberts chacun suit les circulations (ou les blocages) des annonceurs entre le quotidien chinois Shenbao et son homologue britannique North China Daily News, en fonction de leur secteur d'activité (selon le code adopté dans le quatrième chapitre, associant une lettre et une couleur à chaque secteur: http://madspace.org/cooked/Tables?ID=103). L'objectif est de savoir si certains secteurs productifs sont plus mobiles que d'autres, et si les circulations sont multilatérales ou unilatérales d'un journal à l'autre. Ce tableau a été réalisé à partir de la table associée : http://madspace.org/cooked/Tables?ID=158 Le premier ensemble de camemberts concerne la culture des apparences (B, en rose : cosmétiques, parures, objects décoratifs pour la maison, etc); le second la culture et les produits dits "culturels" (C, en marron). On rappelle que cette catégorie globale inclut les livres, radio, musique, annonces scolaires, cinéma, photographie, matériel bureautique, etc). |
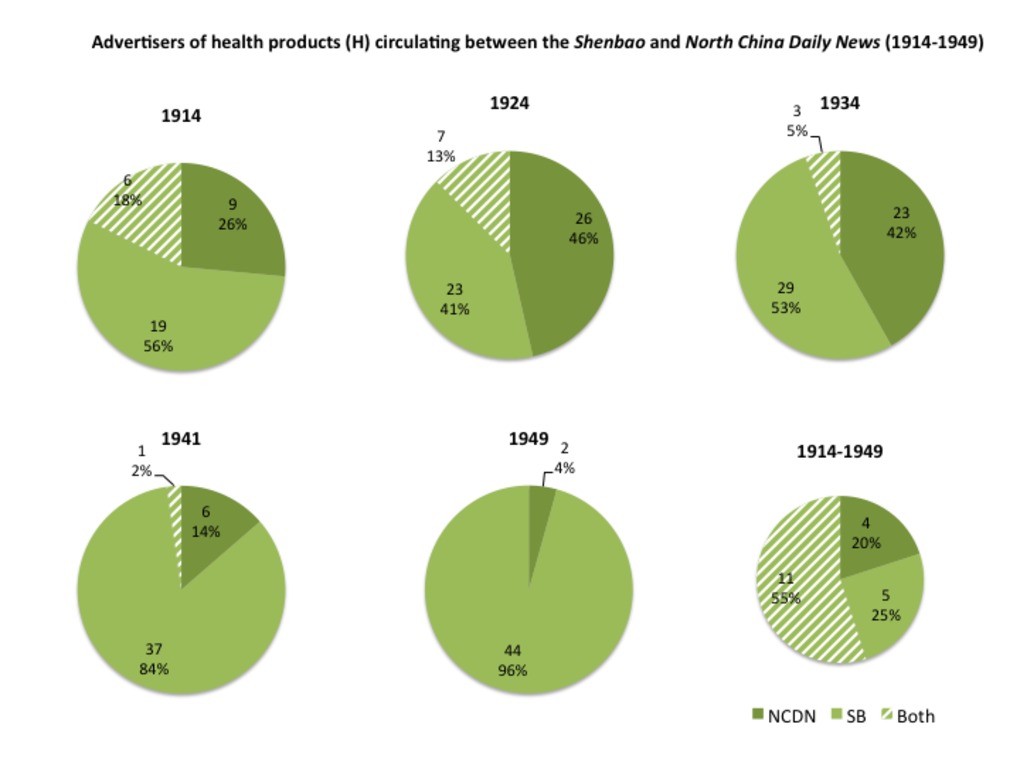 | 287 | Advertisers circulating within the Shanghai press, according to their business sector: health (H) and nutrition (N) (1914-1949) | Ce triple jeu de six camemberts chacun suit les circulations (ou les blocages) des annonceurs entre le quotidien chinois Shenbao et son homologue britannique North China Daily News, en fonction de leur secteur d'activité (selon le code adopté dans le quatrième chapitre, associant une lettre et une couleur à chaque secteur: http://madspace.org/cooked/Tables?ID=103). L'objectif est de savoir si certains secteurs productifs sont plus mobiles que d'autres, et si les circulations sont multilatérales ou unilatérales d'un journal à l'autre. Ce tableau a été réalisé à partir de la table associée : http://madspace.org/cooked/Tables?ID=158 Le premier ensemble de camemberts concerne la santé (H, en vert); le second les aliments et les boissons (N, en marron-vert). |
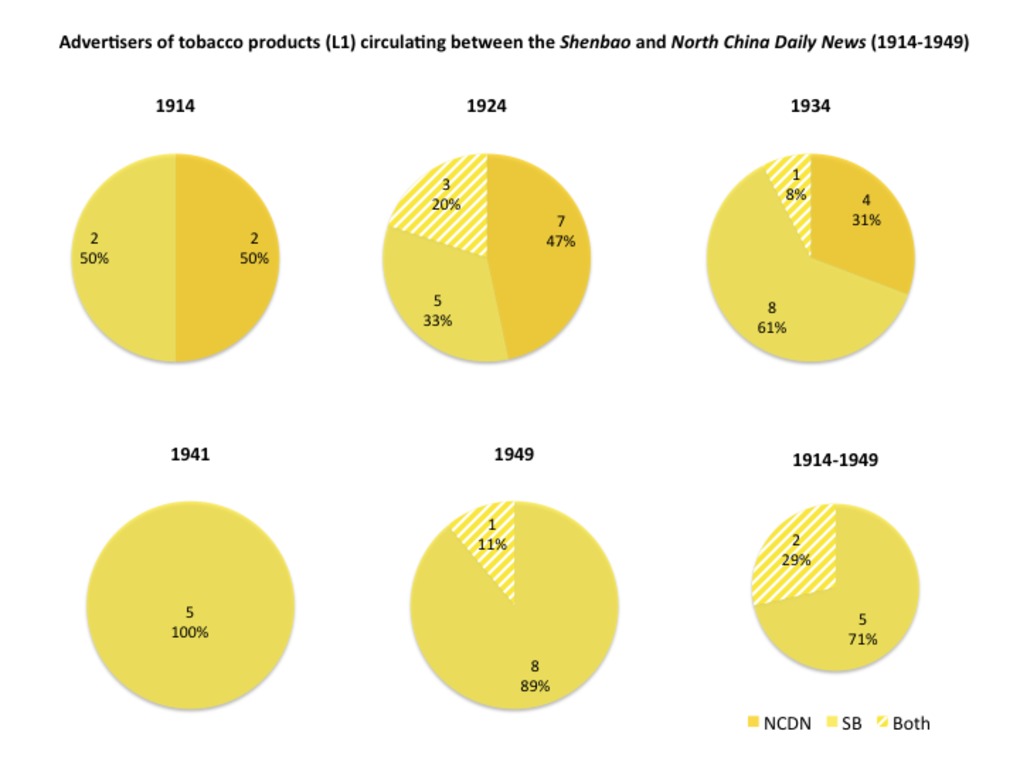 | 288 | Advertisers circulating within the Shanghai press, according to their business sector: tobacco (L1), alcohol (L2) and leisure (L3-L5) (1914-1949) | Ce triple jeu de six camemberts chacun suit les circulations (ou les blocages) des annonceurs entre le quotidien chinois Shenbao et son homologue britannique North China Daily News, en fonction de leur secteur d'activité (selon le code adopté dans le quatrième chapitre, associant une lettre et une couleur à chaque secteur: http://madspace.org/cooked/Tables?ID=103). L'objectif est de savoir si certains secteurs productifs sont plus mobiles que d'autres, et si les circulations sont multilatérales ou unilatérales d'un journal à l'autre. Ce tableau a été réalisé à partir de la table associée : http://madspace.org/cooked/Tables?ID=158 Le premier jeu de camemberts concerne le tabac (L1, en jaune); le deuxième les boissons alcoolisées (L2, en orange foncé); le troisième les loisirs et autres formes de plaisirs (L3-L5) (théâtre, cinéma, bar, restaurant, grand magasin, etc). |
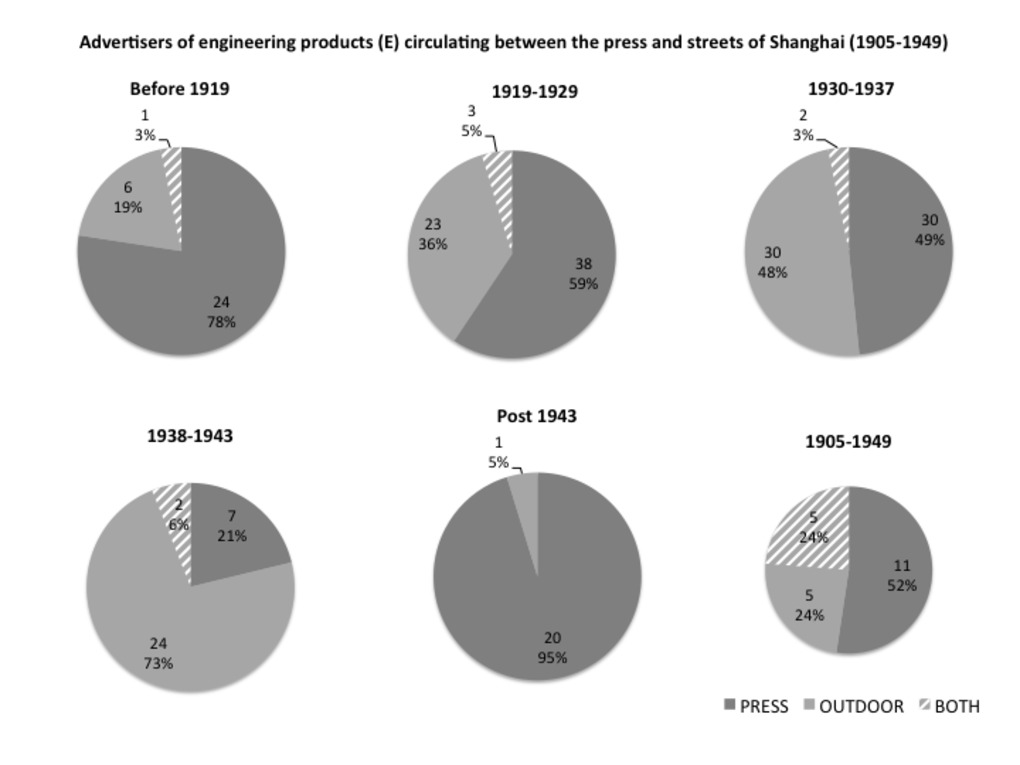
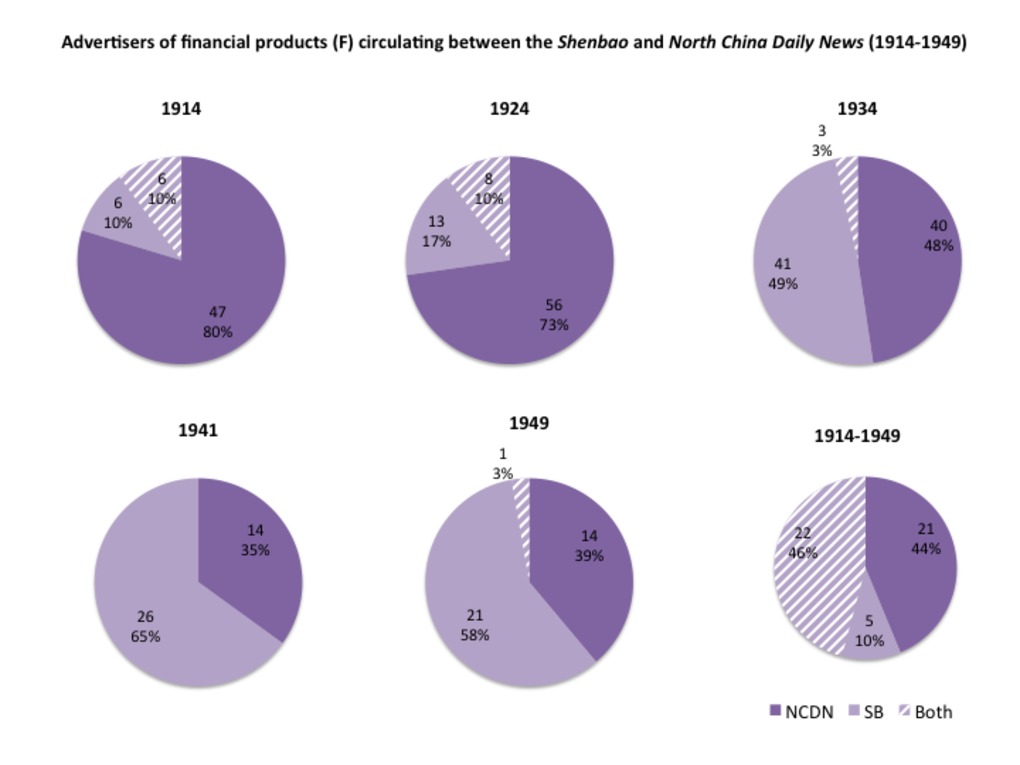 | 289 | Advertisers circulating within the Shanghai press, according to their business sector: industry (E), finance (F) and urban services (U) (1914-1949) | Ce triple jeu de six camemberts chacun suit les circulations (ou les blocages) des annonceurs entre le quotidien chinois Shenbao et son homologue britannique North China Daily News, en fonction de leur secteur d'activité (selon le code adopté dans le quatrième chapitre, associant une lettre et une couleur à chaque secteur: http://madspace.org/cooked/Tables?ID=103). L'objectif est de savoir si certains secteurs productifs sont plus mobiles que d'autres, et si les circulations sont multilatérales ou unilatérales d'un journal à l'autre. Ce tableau a été réalisé à partir de la table associée : http://madspace.org/cooked/Tables?ID=158 Le premier jeu de camemberts concerne le secteur financier (F, en violet); le deuxième l'industrie (E, en gris); le troisième les services (énergie et transports) (U, en bleu). |
 | 290 | Advertisers circulating between the press and streets of Shanghai, according to their business sector: appearance (B) and culture (C) (1914-1949) | Ce triple jeu de six camemberts chacun suit les circulations (ou les blocages) des annonceurs entre la presse et les rues de Shanghai, en fonction de leur secteur d'activité (selon le code adopté dans le quatrième chapitre, associant une lettre et une couleur à chaque secteur: http://madspace.org/cooked/Tables?ID=103). L'objectif est de savoir si certains secteurs productifs sont plus mobiles que d'autres, et si les circulations sont multilatérales ou unilatérales d'un journal à l'autre. Ce tableau a été réalisé à partir de la table associée : http://madspace.org/cooked/Tables?ID=158 Le premier ensemble de camemberts concerne la culture des apparences (B, en rose : cosmétiques, parures, objects décoratifs pour la maison, etc); le second la culture et les produits dits "culturels" (C, en marron). On rappelle que cette catégorie globale inclut les livres, radio, musique, annonces scolaires, cinéma, photographie, matériel bureautique, etc). |
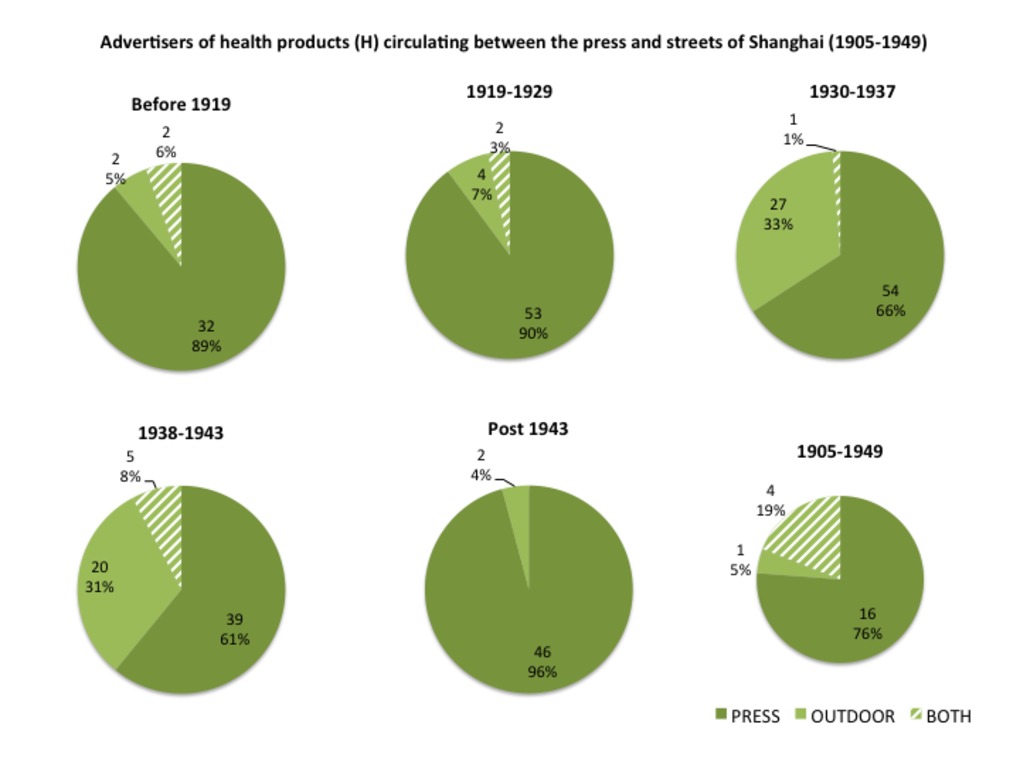 | 291 | Advertisers circulating between the press and streets of Shanghai, according to their business sector: health (H) and nutrition (N) (1914-1949) | Ce triple jeu de six camemberts chacun suit les circulations (ou les blocages) des annonceurs entre la presse et les rues de Shanghai, en fonction de leur secteur d'activité (selon le code adopté dans le quatrième chapitre, associant une lettre et une couleur à chaque secteur: http://madspace.org/cooked/Tables?ID=103). L'objectif est de savoir si certains secteurs productifs sont plus mobiles que d'autres, et si les circulations sont multilatérales ou unilatérales d'un journal à l'autre. Ce tableau a été réalisé à partir de la table associée : http://madspace.org/cooked/Tables?ID=158 Le premier ensemble de camemberts concerne la santé (H, en vert); le second les aliments et les boissons (N, en marron-vert). |
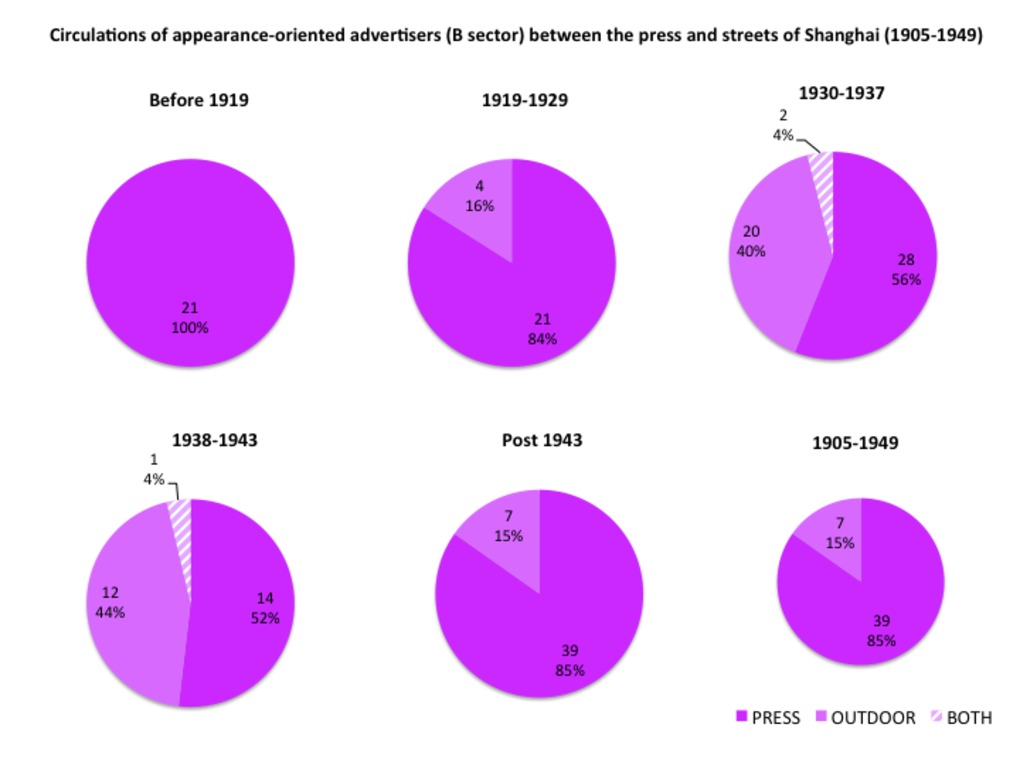
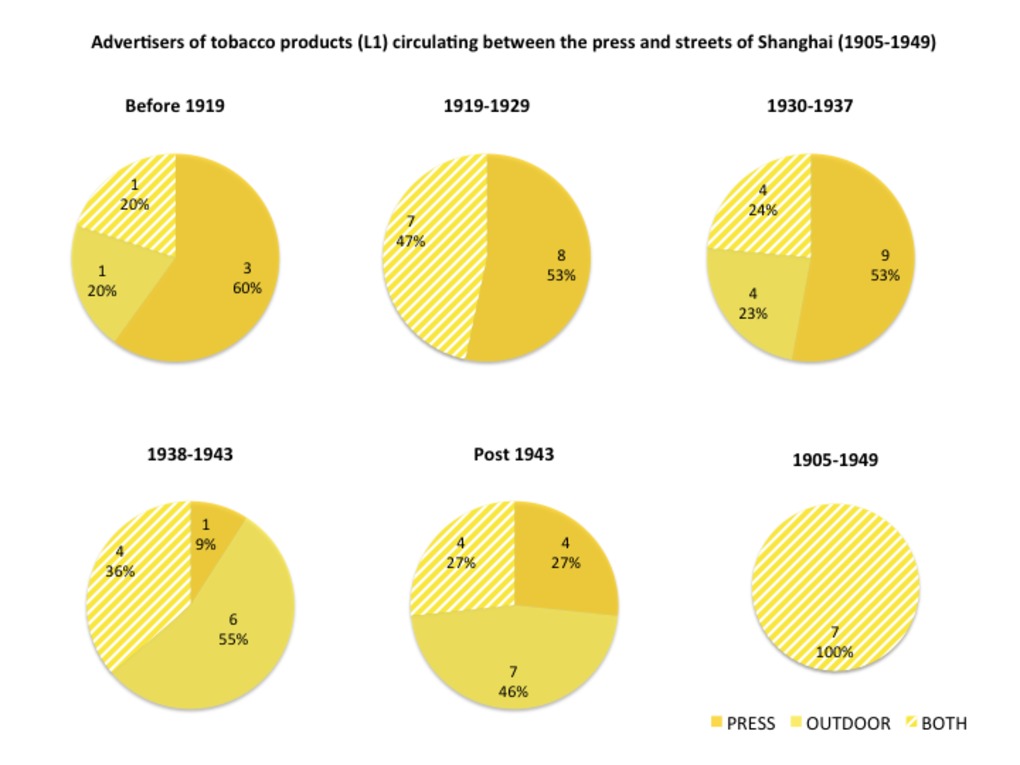 | 292 | Advertisers circulating between the press and streets of Shanghai, according to their business sector: tobacco (L1), alcohol (L2) and leisure (L3-L5) (1914-1949) | Ce triple jeu de six camemberts chacun suit les circulations (ou les blocages) des annonceurs entre la presse et les rues de Shanghai, en fonction de leur secteur d'activité (selon le code adopté dans le quatrième chapitre, associant une lettre et une couleur à chaque secteur: http://madspace.org/cooked/Tables?ID=103). L'objectif est de savoir si certains secteurs productifs sont plus mobiles que d'autres, et si les circulations sont multilatérales ou unilatérales d'un journal à l'autre. Ce tableau a été réalisé à partir de la table associée : http://madspace.org/cooked/Tables?ID=158 Le premier jeu de camemberts concerne le tabac (L1, en jaune); le deuxième les boissons alcoolisées (L2, en orange foncé); le troisième les loisirs et autres formes de plaisirs (L3-L5) (théâtre, cinéma, bar, restaurant, grand magasin, etc). |
 | 293 | Advertisers circulating between the press and streets of Shanghai, according to their business sector: industry (E), finance (F) and urban services (U) (1914-1949) | Ce triple jeu de six camemberts chacun suit les circulations (ou les blocages) des annonceurs entre la presse et les rues de Shanghai, en fonction de leur secteur d'activité (selon le code adopté dans le quatrième chapitre, associant une lettre et une couleur à chaque secteur: http://madspace.org/cooked/Tables?ID=103). L'objectif est de savoir si certains secteurs productifs sont plus mobiles que d'autres, et si les circulations sont multilatérales ou unilatérales d'un journal à l'autre. Ce tableau a été réalisé à partir de la table associée : http://madspace.org/cooked/Tables?ID=158 Le premier jeu de camemberts concerne le secteur financier (F, en violet); le deuxième l'industrie (E, en gris); le troisième les services (énergie et transports) (U, en bleu). |