
 12345
12345 

filter by Title A B C D E F G H I J K L M N O P Q R S T U V W X Y Z [all]
| ID | Title | Description | |
|---|---|---|---|
 | 169 | Une domination croissante des annonceurs chinois dans le Shenbao (1914-1949) | Ces trois courbes mesurent l'évolution du nombre d'annonceurs chinois (en rouge) et étrangers ("occidentaux" en bleu et japonais en vert) dans le Shenbao entre 1914 et 1949, à partir des cinq échantillons habituels (7 janvier 1914, 3 janvier 1924, 5 janvier 1934, 1er février 1941, 1er janvier 1949). Si les annonceurs chinois dominent déjà largement en 1914, leur supériorité s'affirme et se renforce à partir de 1924, tandis que la présence étrangère décline progressivement, dès 1924-1934 pour les Japonais, et surtout après 1941 pour les Occidentaux. |
 | 170 | Une présence chinoise variable selon les secteurs productifs : répartition des annonceurs chinois par secteurs productifs dans le Shenbao (1914-1949) | Ces cinq camemberts (à raison d'un part échantillon) mesurent la présence inégale des annonceurs chinois selon les secteurs productifs, et l'évolution de cette répartition productive dans le Shenbao entre 1914 et 1949. Les mesures ont été réalisées à partir de nos cinq échantillons habituels du Shenbao (7 janvier 1914, 3 janvier 1924, 5 janvier 1934, 1er février 1941, 1er janvier 1949). On observe que les annonceurs chinois dominent et se maintiennent dans quatre secteurs clés : les médicaments, l'éducation, la finance et les loisirs. Ils régressent dans certains (la finance), conquièrent de nouveaux secteurs (transports et services) tandis que d'autres ne se développent que tardivement et restent secondaires (culture des apparences, industrie). Les années 1930 semblent marquer un tournant pour le système productif chinois. |
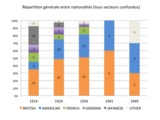 | 171 | Répartition générale entre annonceurs étrangers dans le Shenbao (1914-1949) | Ces histogrammes courbes visualisent la répartition entre annonceurs de nationalités étrangères et son évolution dans le Shenbao entre 1914 et 1949, à partir des cinq échantillons habituels (7 janvier 1914, 3 janvier 1924, 5 janvier 1934, 1er février 1941, 1er janvier 1949). Si les Britanniques dominent tout au long de la période, ils profitent du retrait des Japonais et Allemands après 1924-1934, mais sont soumis à la concurrence croissante des Américains qui finissent par s'imposer en 1941-1949. |
 | 172 | Répartition générale entre annonceurs étrangers dans le secteur pharmaceutique et cosmétique dans le Shenbao (1914-1949) | Ces histogrammes courbes visualisent la répartition entre annonceurs pharmaceutiques et cosmétiques de nationalités étrangères et son évolution dans le Shenbao entre 1914 et 1949, à partir des cinq échantillons habituels (7 janvier 1914, 3 janvier 1924, 5 janvier 1934, 1er février 1941, 1er janvier 1949). Ce secteur suit l'évolution générale : les Britanniques dominent tout au long de la période, ils profitent du retrait des Japonais et Allemands après 1924-1934, mais sont soumis à la concurrence croissante des Américains qui ont toutefois du mal à s'imposer face aux Britanniques, même à la fin de la période. |
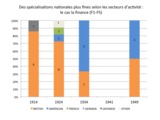 | 173 | Répartition générale entre annonceurs étrangers dans le secteur financier dans le Shenbao (1914-1949) | Ces histogrammes courbes visualisent la répartition entre annonceurs financiers de nationalités étrangères et son évolution dans le Shenbao entre 1914 et 1949, à partir des cinq échantillons habituels (7 janvier 1914, 3 janvier 1924, 5 janvier 1934, 1er février 1941, 1er janvier 1949). Ce secteur suit l'évolution générale : les Britanniques dominent tout au long de la période, ils profitent du retrait des Japonais après 1924, mais sont soumis à la concurrence croissante des Américains qui ont toutefois du mal à s'imposer face aux Britanniques, même à la fin de la période. Quelques minorités présentes en 1924 (française, belge) ont du mal à s'installer durablement. |
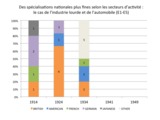 | 174 | Répartition générale entre annonceurs étrangers dans le secteur automobile dans le Shenbao (1914-1949) | Ces histogrammes courbes visualisent la répartition entre annonceurs automobile de nationalités étrangères et son évolution dans le Shenbao entre 1914 et 1949, à partir des cinq échantillons habituels (7 janvier 1914, 3 janvier 1924, 5 janvier 1934, 1er février 1941, 1er janvier 1949). Ce secteur suit une trajectoire atypique. Les Britanniques s'effacent derrière d'autres nationalités : Allemands, Japonais et Français en 1914, Américains à partir de 1924 et Italiens en 1934. Les étrangers semblent disparaître du secteur à partir de 1941. |
 | 175 | Répartition générale entre annonceurs étrangers dans le secteur des services et transports urbains dans le Shenbao (1914-1949) | Ces histogrammes courbes visualisent la répartition entre annonceurs de nationalités étrangères spécialisés dans les services et transports urbains, et son évolution dans le Shenbao entre 1914 et 1949, à partir des cinq échantillons habituels (7 janvier 1914, 3 janvier 1924, 5 janvier 1934, 1er février 1941, 1er janvier 1949). Ce secteur suit une trajectoire atypique. Le secteur est partagé entre Britannique et Japonais au début mais s'ouvre aux Américains et à des "minorités" européennes (en vertu de la spécialisation géographique des lignes de transports maritimes longue distance). |
 | 176 | Répartition générale entre annonceurs étrangers dans le secteur de la nutrition et des boissons dans le Shenbao (1914-1949) | Ces histogrammes courbes visualisent la répartition entre annonceurs de nationalités étrangères spécialisés dans la nutrition et les boissons, et son évolution dans le Shenbao entre 1914 et 1949, à partir des cinq échantillons habituels (7 janvier 1914, 3 janvier 1924, 5 janvier 1934, 1er février 1941, 1er janvier 1949). Le secteur se partage en alternance entre quatre nationalités principales : Français, Allemands, Britanniques et Américains. |
 | 177 | Répartition générale entre régions ou localités chinoises annonceuses dans le Shenbao (1914-1949) | Ces histogrammes courbes visualisent la répartition entre annonceurs chinois issus de régions ou localités variées, et son évolution dans le Shenbao entre 1914 et 1949, à partir des cinq échantillons habituels (7 janvier 1914, 3 janvier 1924, 5 janvier 1934, 1er février 1941, 1er janvier 1949). Les Cantonais dominent ou sont présents tout au long de notre période, mais les années 1934-1941 marquent une phase d'ouverture à d'autres localités plus lointaines. En dehors de cette période exceptionnelle, les annonceurs chinois du Shenbao restent très proches de Shanghai et sa région. |
 | 178 | Le cas des annonceurs cantonais dans le Shenbao : une présence variable selon les secteurs (1914-1949) | Ces cinq camemberts (à raison d'un par échantillon) étudient le cas des Cantonais annonceurs dans le Shenbao : ils montrent leur spécialisation privilégiée dans le secteur pharmaceutique, et dans une moindre mesure, la nutrition. Cette répartition productive se modifie fortement au cours du temps : très diversifié en 1924, plus monotone en 1934-1941, les Cantonais investissent de nouveaux secteurs à la fin de la période (finance et loisirs en 1949). |
 | 179 | Emergence différenciée des marques selon les secteurs productifs dans le Shenbao (1914-1949) | Ces cinq jeux de trois camemberts chacun (à raison d'un camembert par échantillon) montre que les secteurs productifs sont inégalement touchés par le processus de branding dans le Shenbao entre 1914 et 1949. Ces inégalités se manifestent par le nombre de marques identifiées dans chaque secteur et par les décalages dans le temps. Les mesures ont été réalisées à partir de nos cinq échantillons habituels du Shenbao (7 janvier 1914, 3 janvier 1924, 5 janvier 1934, 1er février 1941, 1er janvier 1949). On a repris les trois indicateurs utilisés pour mesurer de manière générale le phénomène de branding : nombre de marques, d'occurrences des termes 牌 (pai) et 商標 (shangbiao) dans les publicités, en les applicant à chaque catégorie productive. |
 | 180 | Evolution de l’offre en marques de cigarettes dans le Shenbao (1914-1949) | Ces deux courbes visualisent l'évolution de l'offre en cigarette dans le Shenbao entre 1914 et 1949 : la courbe la plus foncée indique le nombre de marques, la plus claire le nombre de compagnies. L'offre est très irrégulière au cours de la période, et il est difficile de dégager une tendance générale. |
 | 181 | Evolution de l’offre en marques de cigarettes dans les rues de Shanghai (1912-1949) | Ces deux courbes visualisent l'évolution de l'offre en cigarette dans les rues de Shanghai (concessions étrangères) entre 1912 et 1949 : la courbe la plus foncée indique le nombre de marques, la plus claire le nombre de compagnies. L'offre est très irrégulière au cours de la période, et il est difficile de dégager une tendance générale. Les mesures ont réalisées à partir des archives municipales et des photographies de rue peuvent expliquer ces irrégularités. |
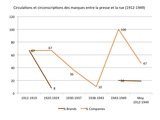 | 182 | Circulations et circonscriptions des marques de cigarettes entre la presse et la rue (1912-1949) | Ces deux courbes visualisent les circulations des marques et des compagnies de cigarettes entre le Shenbao et les rues de Shanghai : la courbe la plus foncée indique le pourcentage de marques communes aux deux espaces, la plus claire le pourcentage de compagnies partagées. Les années 1920-1929 et 1943-1949 sont les périodes de circualtions maximales, mais il est difficile de se fier à ses chiffres en raison des lacunes de la documentation (surtout dans la rue et à partir d'échantillons aussi restreints dans la presse). |
 | 183 | Nombre de marques de cigarettes proposées simultanément par chaque compagnie dans le Shenbao et les rues de Shanghai entre 1912 et 1949 | Ces cinq camemberts (à raison d'un par période) visualisent l'évolution du nombre moyen de marques proposées simultanément par chaque compagnie. |
 | 184 | Nombre total de marques de cigarette par compagnie sur la totalité de leur existence dans le Shenbao et dans les rues de Shanghai (1912-1949) | Ce camembert visualise le nombre maximal de marques offertes par chaque compagnie au cours de son existence. |
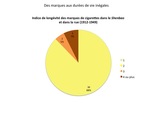 | 185 | Indice de longévité des marques de cigarettes dans le Shenbao et dans la rue (1912-1949) | Ce camembert visualise les inégalités de longévité entre marques de cigarettes exposées dans le Shenbao et dans les rues de Shanghai entre 1912 et 1949. La longévité est mesurée par le nombre d'échantillons où la marque est présente (de 1 à 4 ou plus). On observe toujours une relation inverse entre indice de longévité et nombre de marque : l'écrasante majorité des marques est éphémère (88%), seule une minorité (7%) atteint l'indice de longévité maximale (4 échantillons ou plus). |
 | 186 | Nombre de marques de médicaments proposées simultanément par chaque compagnie dans le Shenbao (1914-1949) | Ces cinq camemberts (à raison d'un par période) visualisent l'évolution du nombre moyen de marques proposées simultanément par chaque compagnie pharmaceutique. |
 | 187 | Evolution du nombre d'annonceurs (advertisers) dans les rues de Shanghai entre 1914 et 1943 | Nombre total d'annonceurs (advertisers) dans les rues de Shanghai, rapporté au nombre total de publicités. Les mesures ont été réalisées à partir des recensements et demandes de permis relevés dans les archives municipales. La fiabilité des chiffres varie selon les périodes :le recensement de 1914 dans la concession internationale offre une base solide pour les débuts de la période, néanmoins restreinte aux clients de l'Oriental Advertising Agency. Les données sont très clairsemées en 1919-1929 et biaisées en 1930-1937 par les relevés de Claude Neon Light qui constituent notre principale source dans la concession française. Si les chiffres sont plus fiables pour la période 1938-1943 (recensement relativement exhaustif de 1943 dans la concession internationale), l’historien souffre de l’absence d’archives après 1943. L'écart entre les courbes est inverse de celui dans la presse : le nombre d'annonceurs connus est inférieur ou égal à celui des artefacts : les archives s'intéressent davantage au support qu'à l'annonceur, et n'enregistrent généralement qu'un seule compagnie. L'augmentation du nombre d'annonceurs sur la longue durée s'explique d'abord et avant tout par l'augmentation du nombre d'artefacts/supports recensés et d'annonceurs identifiés. La courbe ascendante est donc le reflet de la réalité documentaire et des préoccupations municipales plus que celle du terrain : elle traduit l'attention plus aiguë des autorités pour la publicité de rue et la précision accrue des instruments de mesure et des informations recensées. |
 | 188 | Une compétition variable selon les secteurs dans les rues de Shanghai (1914-1943) | Cette série de cinq camemberts complète le graphique ci-joint : elle montre le degré variable de concurrence selon les secteurs, à raison d'un camembert par période. Les mesures ont été réalisées à partir des relevés des archives municipales, quantitativement et qualitativement inégaux selon les périodes. On a repris le code couleur et les lettres habituels pour les secteurs. Plus la tranche est large, plus le secteur est concurrentiel : plus le nombre d'acteurs en compétition est élevé. Inversement, plus la tranche est fine, plus le secteur tend au monopole.
|
 | 189 | Evolution du nombre d'annonceurs (advertisers) par secteurs productifs dans les rues de Shanghai (1914-1943) | Nombre d'annonceurs (advertisers) identifiés pour chaque secteur productif dans les rues de Shanghai entre 1914 et 1943 Les mesures ont été réalisées à partir des archives municipales, dont les relevés sont quantitativement et qualitativement inégaux. L'axe des abscisses indiquent les années, l'axe des ordonnées le nombre de compagnies. On a repris le code couleur et les lettres habituels pour les secteurs. Ce jeu de courbes est difficilement lisible mais il a le mérité de montrer que le degré de compétition varie selon les secteurs et au fil du temps. |
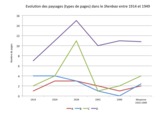 | 190 | Evolution des paysages (types de pages) dans le Shenbao entre 1914 et 1949 | Ces courbes mesurent l'importance de chaque type de page dans le Shenbao, et leur évolution au cours du temps entre 1914 et 1949. Les mesures ont été réalisées à partir des cinq échantillons habituels du Shenbao : 7 janvier 1914 (14p), 3 janvier 1924 (22p), 5 janvier 1934 (32 p), 1er février 1941 (14p), 1er janvier 1949 (14p). L'axe des ordonnées indique le nombre de pages, l'axe des abscisses sert de ligne du temps. A chaque type est associée une couleur : rouge pour la colonne verticale (type A), bleu pour la bande horizontale (B), vert pour la grille/quadrillage (C), violet pour la mosaïque (D). |
 | 191 | Types of page-landscapes in the Chinese newspaper Shenbao (1914-1949) | Evolution des paysages (types de pages) dans le Shenbao entre 1914 et 1949 Cette succession d'histogramme mesurent l'importance relative de chaque type de page dans le Shenbao, et leur évolution au cours du temps entre 1914 et 1949. Les mesures ont été réalisées à partir des cinq échantillons habituels du Shenbao : 7 janvier 1914 (14p), 3 janvier 1924 (22p), 5 janvier 1934 (32 p), 1er février 1941 (14p), 1er janvier 1949 (14p). L'axe des ordonnées indique le nombre de pages, l'axe des abscisses sert de ligne du temps. A chaque type est associée une couleur : rouge pour la colonne verticale (type A), bleu pour la bande horizontale (B), vert pour la grille/quadrillage (C), violet pour la mosaïque (D). Types of page-landscapes in the Chinese newspaper Shenbao (1914-1949) This set of bar charts aims to measure the proportion of the various types of pages in the five usual samples of the Chinese newspaper Shenbao (January 7, 1914; January 3, 1924; January 5, 1934; February 1, 1941; January 1, 1949), according to the same following typology and color code; vertical column-style (A, red), horizontal stripe-style (B, blue), grid (C, green), mosaïc/patchwork (D, purple). |
 | 192 | Répartition des paysages (types de pages) dans chaque échantillon du Shenbao entre 1914 et 1949 | Cette succession de camemberts mesurent l'importance relative de chaque type de page dans chaque échantillon du Shenbao. Les mesures ont été réalisées à partir des cinq échantillons habituels du Shenbao : 7 janvier 1914 (14p), 3 janvier 1924 (22p), 5 janvier 1934 (32 p), 1er février 1941 (14p), 1er janvier 1949 (14p). L'axe des ordonnées indique le nombre de pages, l'axe des abscisses sert de ligne du temps. A chaque type est associée une couleur : rouge pour la colonne verticale (type A), bleu pour la bande horizontale (B), vert pour la grille/quadrillage (C), violet pour la mosaïque (D). |
 | 193 | Localisation des paysages (types de pages) dans le Shenbao entre 1914 et 1949 | Ces courbes localisent les types de page dans chaque échantillon du Shenbao, à raison d'un graphique par échantillon. Les mesures ont été réalisées à partir des cinq échantillons habituels : 7 janvier 1914 (14p.), 3 janvier 1924 (22p), 5 janvier 1934 (32p.), 1er février 1941 (14p), 1er janvier 1949 (14p). L'axe des ordonnées signale la présence (1) ou l'absence (0) de ce paysage, l'axe des abscisses indique le numéro de page. A chaque type est associée une couleur : rouge pour la colonne verticale (type A), bleu pour la bande horizontale (B), vert pour la grille/quadrillage (C), violet pour la mosaïque (D). |
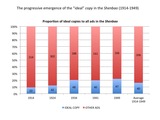 | 195 | Proportion of "ideal copies" to other advertisements in the Shenbao (1914-1949) | Le premier groupe d'histogrammes retrace l'émergence progressive de la "copy" idéale* dans le quotidien Shenbao etre 1914 et 1949 : leur part dans la population publicitaire totale double entre 1914 et 1949, passant de 10% en 1914-1024 à 20% à partir de 1934-1949 (cf. diapo 1). Toutefois, la "copy" modèle reste un idéal, atteint par une minorité de publicités sur la longue durée (15% en moyenne, 20% maximum). Ces chiffres sont légèrement supérieurs lorsqu'on les rapporte aux publicités pour produits "marqués" uniquement, en excluant les publicités scolaires, financières et autres services (cf. diapo 2) : on passe alors de 20% en 1914-1924 à près de 50% en 1934-1949, avec une moyenne de 30% sur la longue durée 1914-1949. Les marques sont donc les plus enclines à suivre le modèle. Toutefois, cette progression n'est pas linéaire : la part de publicités "idéales" régressent en 1949. Faut-il y voir une réduction des moyens investis dans les images en période de crise, ou bien un changement de modèle ? Les mesures ont été réalisées à partir de nos échantillons habituels du Shenbao : 7 janvier 1914, 3 janvier 1924, 5 janvier 1934, 1er février 1941, 1er janvier 1949. *Par "copy" idéale, il faut entendre toute publicité composée d'au moins deux des élement textuels et un des éléments visuels définis dans les manuels publicitaires (cf. chapitre 5 et échelle graduée de la visualité/écarts à la norme dans la section "Drawings"). Rough translation The first set of histograms traces the gradual emergence of the "ideal copy" * in the newspaper Shenbao between 1914 and 1949 : their proportion to the total advertising population doubled between 1914 and 1949 (from 10% in 1914-1924 to 20% in 1934-1949 (slide 1). However, the model copy is an ideal attained by a minority of advertisements only. (average 15%, maximum 20%). These figures are slightly higher when compared with advertisements for branded products only (excluding school advertisements, financial and other services) (slide 2): from 20% in 1914-1924 to 50% en 1934-1949 (an average of 30% in 1914-1949). Branded products appear to be the more liable to follow the "ideal copy" model. Yet there is no linear progression: in 1949, the proportion of "model" ads falls from 50% to 30%. It is because of economic restrictions (costs of paper and impression refraining the use of images), or does it herald the emergence of a new model? These measurements were made from the our usual samples of the Shenbao: January 7, 1914; January 3, 1924; January 5, 1934; February 1, 1941; January 1, 1949. * By "ideal copy", I mean any advertising composed of at least two of the textual elements and one of the visual elements identified by contemporary handbooks (see Chapter 5 and my own scale of visuality/deviations from the ideal copy in the "Drawings" section). |
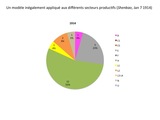 | 196 | The unequal adoption of the "ideal copy" by the various types of products in the Shenbao (1914-1949) | Ce jeu de cinq camembers (à raison d'un par échantillon) révèle l'adoption inégale de la "copy" idéale selon les types de produits. Les médicaments sont les premiers et les plus enclins à suivre le modèle, même si cette part décline progressivement sous la concurrence de nouveaux produits (de 55% en 1914 à 13% en 1949). En 1914, ils sont suivis par l'industrie (23%), l'alcool (9%), la nutrition (5%), les cigarettes et la culture des apparences (4% chacun). En 1924, ces secteurs ne s'écartent pas de la norme et de nouveaux l'adoptent à leur tour ; culture (8%), divertissements (5%) et dans une moindre mesure, services (finance et transport, 3% chacun). Ces secteurs maintiennent leur attachement au modèle : les cosmétiques (9% en 1934, 7% en 1941, 41% en 1949), les divertissements (23% en 1934, 43% en 1941, 18% en 1949), les cigarettes (8% en 1934, 3% en 1941, 10% en 1949) et la nutrition (6% en 1934, 8% en 1941) se montrant les plus fidèles. Les mesures ont été réalisées à partir de nos échantillons habituels du Shenbao : 7 janvier 1914, 3 janvier 1924, 5 janvier 1934, 1er février 1941, 1er janvier 1949. *Par "copy" idéale, il faut entendre toute publicité composée d'au moins deux des élement textuels et un des éléments visuels définis dans les manuels publicitaires (cf. chapitre 5 et échelle graduée de la visualité/écarts à la norme) Rough translation This set of five pie charts (one per sample) reveals the uneven adoption of the "copy" ideal by the various types of products. Health products were the first and most likely to follow the pattern, although their share gradually declined under competition from new products (55% in 1914 to 13% in 1949). In 1914, medicines are followed by industrial products/services (23%), alcoholic drinks (9%), foodstuff (5%), cigarette and beauty products (4% each). In 1924, the pionneering products do not deviate from the norm and new ones started to follow the trend: culture (8%), entertainments (5%) and to a lesser extent, services (finance and transportation, 3% each). Until the end of the period, those sectors maintained their conformity to the model: cosmetics (9% in 1934, 7% in 1941, 41% in 1949), entertainments (23% in 1934, 43% in 1941, 18% in 1949), cigarettes (8 % in 1934, 3% in 1941, 10% in 1949) and foodstuff (6% in 1934, 8% in 1941) proved the closest to the ideal copy. These measurements were made from our usual samples of the Shenbao: January 7, 1914; January 3, 1924; January 5, 1934; February 1, 1941; January 1, 1949. * By "ideal copy", I mean any advertising composed of at least two of the textual elements and one of the visual elements identified by contemporary handbooks (see Chapter 5 and my own scale of visuality/deviations from the ideal copy). |
 | 197 | Types of titles in Shenbao advertisements (1914-1949) | This set of six bar charts measures the relative importance of the various types of advertisement titles in our usual samples of the Shenbao (January 7, 1914; January 3, 1924; January 5, 1934; February 1, 1941; January 1, 1949). The figures show that the "name" type (name of either the company or the product/brand) predomines during the whole period (between 60% in 1914/1949 to 90% in 1941, average: 75%). This preference for title-names (mingcheng) was also noticed by contemporary handbooks (Su, 1929: 43). |
 | 198 | Types of discursive styles in the Chinese newspaper Shenbao advertisements (1914-1949) | This set of six bar charts measure the relative importance of the three main types of discursive styles (or "ages") in our usual samples of the Shenbao: January 7, 1914; January 3, 1924; January 5, 1934; February 1, 1941; January 1, 1949. The figures show that the "rational" style prevailed during the whole period (average: 60%). Yet it tends to decline between 1914 (75%) and 1934-1949 (50%), gradually competed by the emotional/suggestive style (from 5% in 1914 to 45% in 1934, average 25%). The hyperbolic (exaggeration) remained marginal (less than 10%): pertaining to the age of "quack advertising", it was above all represented at the beginning of the period (20% in 1914). However, the three styles continued to cohabit on the pages of the same newspaper issue, and even on the same advertisement. The hyperbolic style was never eradicated by the rational or emotional styles asosicated with "modern" advertising, nor did the emotional tone replace reason-why copies. |
 | 199 | Repartition of styles according to the type of product in Shenbao advertisements (1914-1949) | This set of bar charts examines to which types of products the three main styles were specifically applied to. The measurements were made from our usual samples of the Shenbao: January 7, 1914; January 3, 1924; January 5, 1934; February 1, 1941; January 1, 1949. Each chart stands for a given sample (issue/year). The charts reveal that the rational style was used for any type of product during the whole period. Since the beginning of the period, the hyperbolic style more specifically applied to medicines, industry, alcohol, and to a lesser extent, cigarettes. It was then adopted by appearance culture, entertainments and nutrition in the 1930-1940s. Confined to medicines and tobacco, the emotional/suggestive discourse became widespread after 1924-1934. Only the industrial and financial sectors escaped from the emotional wave. |
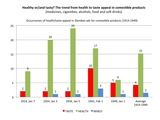 | 200 | Healthy or/and tasty? The trend from health to taste appeal in Shenbao advertisements for comestible products (1914-1949) | This set of bar charts measure the relative importance of two major appeals that were used to advertise comestible products at the time: health and taste/appetite, which either compete or complete each other. By "comestible products", we mean medicines, tobacco, alcholic drinks, food and soft drinks. The measurements were made from our usual five samples of the Shenbao (January 7, 1914; January 3, 1924; January 5, 1934; February 1, 1941; January 1, 1949). In each sample, we have recorded the occurrences of each appeal: health only (green), taste only (red), or a combination of the two appeals in the same advertisement (blue). The figures show that the "health" appeal remains predominant during the entire period (average of 15 occurrences, reaching a peak in 1934 (24 occurrences, while the taste appeal occured only two times). After a period of stagnation (two occurrences per issue in 1914-1924), the taste appeal dramatically raised in 1941 (10 occurrences), but fall again to 5 occurrences in 1949. Starting from 1924, health and taste appeals began to be combined (1 case in 1924-1934, 3 in 1941). The fifth following charts examine more closely to which products each appeal was specifically applied to. Obviously, health was constantly and systematically associated to medicines. Yet, it was also used to advertise alcohol in 1914 and nutritional products in 1924. As soon as 1924, alcoholic drinks were preferentially associated with taste, as it was the case for tobacco since 1914. Therefore, the "taste appeal" participated in the gradual association of alcohol and tobacco with pleasure. |
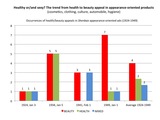 | 201 | Healthy or/and sexy/trendy? The trend from health to beauty/fashion appeal in Shenbao advertisements for appearance-oriented products (1914-1949) | This set of bar charts measure the relative importance of two major appeals that were used to advertise appearance-oriented products at the time: health and beauty/sex appeal, which either compete or complete each other. Behind the phrase "appearance products", we mainly include cosmetics, clothing, culture, automobile and hygienic products. The measurements were made from our usual samples of the Shenbao (January 3, 1924; January 5, 1934; February 1, 1941; January 1, 1949). Jan 7 1914 was deliberately excluded since none of these products were represented in this issue. In each sample, we have recorded the occurrences of each appeal: health only (green), beauty/sex only (red), or a combination of the two appeals in the same advertisement (blue). The figures show that the "beauty" appeal remains predominant during the entire period (average of 4 occurrences, reaching a peak in 1949 (7 occurrences, while the "health" appeal occured only one or two times per issue). After a period of equal stagnation (one occurrences per issue for each appeal in 1924), the beauty and health appeals dramatically emerged in parallel in 1934 (5 occurrences for each one). In 1941, it fell to 3 occurrences, while the purely health appeal temporarily disappeared. Yet this was balanced by the combination of the health/beauty appeal (3 occurrences in 1941). The four following charts examine more closely to which products each appeal was specifically applied to. Before 1941, cosmetics were equally advertised as either "health" or "beauty" products, first mixed in the same advertisements (1924), then as separate appeals (1934). After 1941, cosmetics were exclusively advertised as "beauty" products. This confirms the cosmetics' gradual process of specialization and separation from medical products. Advertisements for hygienic products were more complex: they alternatively used health (1934) and beauty appeal (1934-1941), or a combination of them (1949). Less frequent than hygienic goods or cosmetics, other products prove difficult to trace on the long-term: culture/productivity, clothing and automobile appear to be systematically associated with social distinction. |
 | 202 | Woman, man and child appeals in Shenbao advertisements (1914-1949) | This set of bar charts measure the relative importance of sex and age appeals in Shenbao advertisements from 1914 to 1949. Note that these appeals do not exclude each other: children and mothers are often associated on the same picture, as are elegant men and sexy women. The measurements were made from our usual five samples of the Shenbao (January 7, 1914; January 3, 1924; January 5, 1934; February 1, 1941; January 1, 1949). In each sample, we have recorded the occurrences of each appeal: sexy woman, corresponding to the seducive Modern Girl or independant New Woman (red), the patriotic mother or housewife (green), men (blue) or children (purple). Unexpectedly, the figures reveal that men were almost as prominent as women in advertising: same number as female occurrences in 1914 (7/6), only 3 in 1924, but 18 in 1934 (24 women), 25 in 1941 (30 female appeals), and finally exceeding women in 1941 (19 men, 13 sexy women and only one mother). Women studies and their focus on either "Modern Girl", "New Woman" or "Perfect Mother/Housewife" in a nationalistic context may have led us to under-estimate the male presence in Shanghai advertising. Women/gender studies may equally have hidden the importance of children and age appeal in advertising, especially in the 1924. Children gradually emerged between 1914 and 1924 in advertising (doubling the number of occurences, from 5 to 12), but entered a phase of stagnation and decline after 1934 (less than 5 occurrences). The progress of the child appeal approximately paralleled that of the "mother" appeal, to whom they were usually associated. The fifth following charts examine more closely to which products each appeal was specifically applied to. Sexy women were first preferentially associated with appearance culture, tobacco, and entertainement, but finally generalized to every type of product after 1934. The mother appeal "naturally" applied to medicines, hygiene, electrical appliances (1924) and nutritional products. Before 1934, the child appeal were primarily associated with medicines and food, and then gradually applied to culture/education and appearance (clothing). Men could be associated to any type of product, but preferentially to health product (medicines, hygiene), alcohol and tobacco, finance, automobile and entertainment, and even food in 1934. |
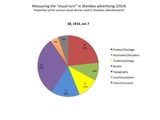 | 203 | Measuring the “visual turn” in Shenbao advertising (1914-1949) | This set of pie charts is an attempt to evaluate the so-called "visual turn" which obsesses quite a number of scholars dealing with advertising today. Though such a "visual turn" was in a way advocated by professionals at the time, it should not be over estimated, and above all, it should not be used to support anachronistic assumptions. To evaluate the actual importance of the "visual turn" in Shenbao advertisements from 1914 to 1949, it is first necessary to define precisely what we mean by "visual". Thus seven "visual devices" have been identified, each one associated to a given color: image of the product/package (red), illustrated situation/life scene (green), trademark/logo (yellow), border/frame (blue), typography/punctuation, line/orientation/composition (orange) and colors/contrasts (grey). The proportion of each device was then measured in the "model" advertisements extracted from our usual five samples of the Shenbao (January 7, 1914; January 3, 1924; January 5, 1934; February 1, 1941; January 1, 1949). The fifth pie charts reveal that paradoxically, the share of figurative images (package or situation) tend to stagnate or even decline across time, at least until 1941 : from 23% in 1914 to 9% in 1941 for images of the package, from 10% in 1914 to 15% (1949) for illustrations. The costs of production of sophisticated images may have forced advertisers to turn towards cheaper visual devices, such as plays on typography (32-34% in 1914-1924, 19% in 1934 and still 10% in 1949), black/white contrasts (from 5% in 1914 to 34% in 1941, still 18% in 1949), borders/frames (from 15% in 1914 to about 30% in 1949, which also reveals an increased competition) and to a lesser extent, lines and composition (average of 5%). The use of trademarks/logos remains quite stable during the whole period (around 10%, after falling to 2% in 1934). |
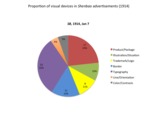 | 204 | Proportion of visual devices in Shenbao advertisements (1914-1949) | La succession des cinq camemberts ci-joints (à raison d'un camembert par échantillon) mesure la part de chaque élément visuel par rapport à l'ensemble des éléments visuels disponibles au copywriter, tels que définis dans les manuels contemporains (Kuai, 1928, Su, 1929, Lu 1940, Wu et Zhu, 1946). Les mesures ont été réalisées à partir de nos échantillons habituels du Shenbao (7 janvier 1914, 3 janvier 1924, 5 janvier 1934, 1er février 1941, 1er janvier 1949). On a ici adopté une définition plus lâche de la copy « idéale », en intégrant les publicités qui présentaient un intérêt du point de vue visuel. Sur ces graphiques, chaque élément visuel est désigné par le code qu'on lui attribué et par une couleur fixe : image du produit/emballage (B1) en rouge ; logo/trademark (B2) en jaune ; situation illustrée (B3) en vert ; bordure (B4) en bleu ; autres dispositifs visuels ou mi visuels (B5) en violet (typographie), orange (lignes, orientation, composition), gris (couleurs et contrastes). Ces cinq camemberts montrent que les images figuratives tendent à stagner voire à décliner (1941) au cours de la période 1914-1949 : si les illustrations (B3) augmentent légèrement de 10% en 1914 à 15% en 1949, les images d’emballage ou de produit (B1) chutent dramatiquement de 23% en 1914 à 9% en 1941, et remontent à 14% en 1949. L’usage des logos (B2) est relativement constant, autour de 10% en moyenne (malgré un creux de 2% en 1934). D’autres dispositifs visuels (bordure, typographie, lignes, contrastes), plus secondaires dans les manuels ou les discours des praticiens, occupent une place croissante dans les publicités du Shenbao, passant de 56% en 1914 à 62% en 1949, avec un pic de 80% en 1924-1934. Certes, les jeux typographiques stagnent voire reculent au cours de la période, passant de 32-34% en 1914-1924 à 19% en 1934 et 10% en 1949. Le travail sur les lignes et le mouvement de l’image et ne touchent que 5% des publicités en moyenne. En revanche, l’usage des bordures (B4) se généralise : leur part double au cours de la période, passant de 15% en 1914 à 30% en 1949. Plus spectaculaires encore, les jeux de contrastes passent de 5% en 1914 à 34% en 1941 (mais retombent à 18% en 1949). Rough translation This set of pie charts measures the proportion of the various visual devices in Shenbao advertisements and their evolution between 1914-1949. Seven "visual devices" have been identified, each one associated to a code (B1, B2, etc) and to a given color: image of the product/package (B1, red), trademark/logo (B2, yellow), illustrated situation/life scene (B3, green), border/frame (B4, blue), and other visual devices (B5): typography/punctuation (purple), line/orientation/composition (orange) and colors/contrasts (grey). The proportion of each device was then measured in the "model" advertisements extracted from our usual five samples of the Shenbao (January 7, 1914; January 3, 1924; January 5, 1934; February 1, 1941; January 1, 1949). The fifth pie charts reveal that paradoxically, the share of figurative images (package or situation) tend to stagnate or even decline across time, at least until 1941 : from 23% in 1914 to 9% in 1941 for images of the package, from 10% in 1914 to 15% (1949) for illustrations. The costs of production of sophisticated images may have forced advertisers to turn towards cheaper visual devices, such as plays on typography (32-34% in 1914-1924, 19% in 1934 and still 10% in 1949), black/white contrasts (from 5% in 1914 to 34% in 1941, still 18% in 1949), borders/frames (from 15% in 1914 to about 30% in 1949, which also reveals an increased competition) and to a lesser extent, lines and composition (average of 5%). The use of trademarks/logos remains quite stable during the whole period (around 10%, after falling to 2% in 1934). |
 | 205 | Proportion of advertisements using various textual devices in the newspaper Shenbao (1914-1949) | Ces histogrammes groupés proposent une première méthode pour mesurer la proportion et l'évolution des éléments textuels dans les publicités du Shenbao entre 1914 et 1949 : ils mesurent le pourcentage de publicités qui comportent l'élément textuel donné, dans chaque échantillon. Les mesures ont été réalisées à partir d'un nombre limité de publicités jugées pertinentes, c’est-à-dire correspondant peu ou prou à la copy « idéale », extraites de nos échantillons habituels : 7 janvier 1914 (27 publicités) ; 3 janvier 1924 (48 publicités) ; 5 janvier 1934 (49 publicités) ; 1er février 1941 (41 publicités) ; 1er janvier 1949 (30 publicités). Sur ces graphiques, chaque élément textuel est désigné par le code qu'on lui attribué plus haut et matérialisé par une couleur fixe : slogan/phrase d'accroche (A2) en rouge ; texte principal (A3) en vert ; nom de marque/produit (A4) en jaune ; nom de la compagnie productrice (A5) en bleu ; adresse ou contact local (A6) en violent ; prix (A7) en orange. Le titre (A1) a été exclu des calculs car toutes les publicités portent un titre. D’après ces histogrammes, on peut distinguer deux ensembles d'éléments textuels :
On obtient des résultats comparables avec les camemberts mesurant la part des éléments textuels par rapport à l'ensemble des dispositifs textuels à disposition du copywriter. |
 | 206 | Proportion of textual devices in Shenbao advertisements (1914-1949) | Ces cinq camemberts successifs (à raison d'un camembert par échantillon) proposent une deuxième méthode pour mesurer la proportion et l'évolution des éléments textuels dans les publicités du Shenbao entre 1914 et 1949 : ils mesurent la part de chaque élément textuel par rapport à l'ensemble des éléments textuels disponibles au copywriter. Les mesures ont été réalisées à partir d'un nombre limité de publicités jugées pertinentes, c’est-à-dire correspondant peu ou prou à la copy « idéale », extraites de nos échantillons habituels : 7 janvier 1914 (27 publicités) ; 3 janvier 1924 (48 publicités) ; 5 janvier 1934 (49 publicités) ; 1er février 1941 (41 publicités) ; 1er janvier 1949 (30 publicités). Sur ces graphiques, chaque élément textuel est désigné par le code qu'on lui attribué plus haut et matérialisé par une couleur fixe : slogan/phrase d'accroche (A2) en rouge ; texte principal (A3) en vert ; nom de marque/produit (A4) en jaune ; nom de la compagnie productrice (A5) en bleu ; adresse ou contact local (A6) en violent ; prix (A7) en orange. Le titre (A1) a été exclu des calculs car toutes les publicités portent un titre. D'après ces graphiques, trois tranches se dessinent :
On observe enfin deux évolutions notables, qui sont étroitement liées : le recul du texte (A3), qui chute de 25% en 1914 à 15% en 1949, est compensé par le progrès des slogans ou accroches, qui passent de 9% à 20% entre 1914 et 1949. On obtient des résutlats comparables avec les histogrammes associés. |
 | 207 | Measuring the division between advertising space/non commercial space in the Chinese newspaper Shenbao between 1914 and 1949 (close reading/quantitative approach) | Ces histogrammes montrent la répartition de l'espace du journal entre espace publicitaire/zone autorisée (en bleu) et contenus non commerciaux/zone interdite de publicité (en rouge) dans nos cinq échantillons habituels du Shenbao : 7 janvier 1914, 3 janvier 1924, 5 janvier 1934, 1er février 1941, 1er janvier 1949. La démarche s'inspire directement de l'étude conduite par deux chercheurs de Qinghua dans cinq quotidiens chinois en décembre 1923 (Source: “An Analytical Study of Advertisements in Chinese Newspapers”. Chinese Economic Monthly (CEM). April 1926. Vol. III, No. 4, p.139-143). Bénéficiant du cumul d’expériences, on s’est appuyé sur les modèles d’aires publicitaires élaborés dans le premier chapitre : la somme des surfaces publicitaires individuelles sur une page donnée ou dans un numéro donné permet ainsi d’obtenir facilement la surface publicitaire totale sur la page ou dans le numéro en question. On rappelle qu'à défaut d’avoir accès aux originaux, les mesures ont été réalisées à partir des numérisations, toutes placées à la même échelle. On a ensuite calculé la surface effectivement occupée en rapportant ces chiffres fictifs aux données dont on dispose sur les dimensions réelles du journal entre 1872 et 1949 : http://madspace.org/cooked/Tables?ID=108, http://madspace.org/cooked/Drawings?ID=101, http://madspace.org/cooked/Drawings?ID=102. Rough English translation These bar charts measure the division between advertising space (blue)/non commercial space (red) in the newspaper Shenbao between 1914 and 1949. The measurements were made from our usual samples of the Shenbao: January 7, 1914; January 3, 1924; January 5, 1934; February 1, 1941; January 1, 1949. The method was inspired by a contemporary study of newspaper advertising conducted in 1923 and published in the Chinese Economic Monthly in 1926 (source: “An Analytical Study of Advertisements in Chinese Newspapers”. Chinese Economic Monthly (CEM). April 1926. Vol. III, No. 4, p.139-143). |
 | 208 | Distribution of advertising/restricted zones in the newspaper Shenbao (1914-1949) | Rough English translation This set of line five graphs aim to visualize the distribution of advertising zones in the newspaper Shenbao, in our five usual samples: Jan 7, 1914 ; Jan 3, 1924 ; Jan 5, 1934 ; Feb 1, 1941 ; Jan 1, 1949. Page numbers are indicated on the X axis ; Y axis indicate the presence (1) or absence (1) of advertisements on the corresponding page. This graphs help to locate authorized/restricted zones in the newspaper Shenbao. By juxtaposing the five successive graphs, one can trace the changes in the newspaper policy towards advertising - either to a more restrictive or liberal policy, and the possible migrations of restricted/authorized zones from one page to aonther accross time. |
 | 209 | Measuring advertising areas in the newspaper Shenbao (1914-1949) | Rough English translation This bar charts charts aim to measure the relative importance of various advertising areas in our five usual samples of the newspaper Shenbao: Jan 7, 1914 ; Jan 3, 1924 ; Jan 5, 1934 ; Feb 1, 1941 ; Jan 1, 1949. Borrowing the vocabulary from urban/political geography, four types of advertising areas has been identified, from the smallest to the largest, each one associated to a distinct color and number :
By juxtaposing the five bar charts, one can trace the changes in the sizes of advertising areas between 1914 and 1949. |
 | 210 | Division between advertising space/non commercial space (restricted zone) in the Chinese newspaper Shenbao between 1914 and 1949 (distant reading) | Ces histogrammes mesurent à distance ou "à vue de nez" (en nombre de pages) la répartition de l'espace du journal entre espace publicitaire/zone autorisée (en bleu) et contenus non commerciaux/zone interdite de publicité (en rouge) dans nos cinq échantillons habituels du Shenbao : 7 janvier 1914, 3 janvier 1924, 5 janvier 1934, 1er février 1941, 1er janvier 1949. Dans un premier temps, on s'est contenté de recenser et départager les pages qui étaient occupées par des publicités (pages autorisées) de celles qui en étaient dépourvues (zones interdites). Cette approche sera affinée par des mesures rigoureuses de la surface effectivement occupée par chaque type de zone. Rough English translation These bar charts offer a distant measuring (by counting the number of pages) of the division between advertising space (blue)/non commercial space (red) in the newspaper Shenbao between 1914 and 1949. The measurements were made from our usual samples of the Shenbao: January 7, 1914; January 3, 1924; January 5, 1934; February 1, 1941; January 1, 1949. In this preliminary approach, the method simply consists in counting the numbers of pages occupied by advertisements (authorized pages/zones), and separating them from the pages strictly deprived from advertisements (restricted zones/pages). This "distant approach" will be refined by a close and precise measuring of the surfaces actually occupied by each type of zone.
|
 | 211 | Distribution of advertising areas in the newspaper Shenbao (1914-1949) | Rough English translation This set of five graphs aim to visualize the distribution of the four types of advertising areas previously identified:
N.B. Number "0" and white color stand for restricted zones (no ads). Page numbers are indicated on the "X" axis, while area code (from 1 to 4) are indicated on the "Y axis". By juxtaposing the five successive graphs, one can trace the changes of sizes and the migrations of advertising areas accros the newspaper issue between 1914 and 1949. The measurements were made from our five usual samples of the newspaper Shenbao: Jan 7, 1914 ; Jan 3, 1924 ; Jan 5, 1934 ; Feb 1, 1941 ; Jan 1, 1949.
|
 | 212 | Situation of advertising zones in the newspaper Shenbao (1914-1949) | This set of bar charts aim to locate advertising zones in each sample issue of the newspaper Shenbao from 1914 to 1949. For that very purpose, three gradual types of situation have been identified, according to their actual position in the newspaper issue (page numbers), from an editorial point of view; and to their presumed effect on the reader attention, from a psychological point of view, based on Chinese handbooks (Wu, Zhu, 1946) which were inspired by contemporary American studies in psychology. Each situation was associated to a given color and number :
The measurements were made from our five usual samples of the newspaper Shenbao: Jan 7, 1914 ; Jan 3, 1924 ; Jan 5, 1934 ; Feb 1, 1941 ; Jan 1, 1949. |
 | 213 | Page location of advertising zones in the newspaper Shenbao (1914-1949) | This set of bar charts aim to finely locate advertising zones on each page of the newspaper Shenbao from 1914 to 1949. For that very purpose, two hierarchic types of page location have been identified, according to their actual/visible position on the page, and their presumed capacity to attract the reader's eye. Each one was associated to a given color and number :
N.B. Number "0" and white color stand for restricted zones (no ads). The measurements were made from our five usual samples of the newspaper Shenbao: Jan 7, 1914 ; Jan 3, 1924 ; Jan 5, 1934 ; Feb 1, 1941 ; Jan 1, 1949. |
 | 215 | Modelizing advertising spatial patterns in the newspaper Shenbao: an essay to correlate area, situation and page location in the newspaper Shenbao (1914-1949) | This set of five graphs offers a synthetical view of the previous analyses made from our five usual samples of the newspaper Shenbao (Jan 7, 1914 ; Jan 3, 1924 ; Jan 5, 1934 ; Feb 1, 1941 ; Jan 1, 1949). Each graph aims to modelize advertising zones in each sample issue by correlating the three criteria previously measured (area, situation, page location). For that very purpose, we have recycled the number and color code used for previous analyses. The "X" axis indicates page numbers (situation), while the "Y axis" is used to measure areas as well as page location. The ultimate goal of this modelizing essay is to reveal spatio-temporal patterns and to re-conciliate quantitative/qualitatve approaches of advertising spaces in the newspaper Shenbao. By juxtaposing the five graphs, one can trace changes in the newspaper advertising geography between 1914-1949.
|
 | 216 | Measuring the relative importance of gradual types of borders in the newspaper Shenbao (1914-1949) | This set of bar charts aims to measure the relative importance of the three main types of borders identified in the newspaper Shenbao between 1914-1949, each one associated to a given number and color:
This gradual typology was freely inspired by E. Casey in his reply to P. Ethington's project of "Placing history". Source: Casey, Edward, ‘Boundary, Place, and Event in the Spatiality of History’, Rethinking History, 11 (2007), 507–12. We have only counted the dominant type of border on each page. For an illustrated or more embodied version of this typology, see: http://madspace.org/cooked/Drawings?ID=119. The measurements were made in our five usual samples of the newspaper Shenbao (Jan 7, 1914 ; Jan 3, 1924 ; Jan 5, 1934 ; Feb 1, 1941 ; Jan 1, 1949). |
 | 217 | Types of advertisement borders correlated to situation, page location and density in the newspaper Shenbao (1914-1949) | This triple line graph aims to correlate types of borders to their situation (page number), page location and to the density of advertisements on each page in our usual samples of the newspaper Shenbao (Jan 7, 1914 ; Jan 3, 1924 ; Jan 5, 1934 ; Feb 1, 1941 ; Jan 1, 1949). The blue line stands for border types, the red line for page density and the grey line for page location. The "X" axis indicates page numbers. The "Y" axis measures either the type of border (0 for open space, 1 for boundary, 2 for border), the density of advertisements on each page (from 0 : < 5 ads/page; 1: between 5 and 10 ads; 2 : > 10 ads/page) or the page location (0 for maginal, 1 for central).
|
 | 220 | Advertising-populated regions in the Chinese newspaper Shenbao (1914-1949) | This set of bar charts aims to measure the surfaces covered by advertisements in the newspaper Shenbao, according to the following gradual scale of areas*:
*For visibility and convenience reasons, each type has been associated with a letter and a color ("S" standing for "surface"): The measurements have been made after our five usual sample issues of the newspaper Shenbao (Jan 9, 1914; Jan 3, 1924; Jan 5, 1934; Feb 1, 1941; Jan 1, 1949). *** Les histogrammes ci-joint mesurent en termes numériques (nombre d’aires relevant de chaque catégorie) : l’importance relative des aires publicitaires dans le Shenbao, selon l'échelle graduée établie par ailleurs :
Par commoditité et par souci de lisibiité, une lettre et un code couleur a été associé à chaque catégorie. Plus la couleur est « froide » (bleu), plus les aires sont petites (types A, B, C : moins de 15% de la page). Inversement, plus les couleurs sont « chaudes » (du jaune au rouge), plus les surfaces sont étendues (type F et G : plus de 25% de la page). Le vert signale finalement les surface intermédiaires (D et E : entre 15 et 25%). La contance de ce code permet de suivre l’évolution des surfaces au fil des âges et de comparer le Shenbao à d'autres quotidiens. Par souci de cohérence, les mesures ont été réalisées à partir de nos cinq échantillons habituels du Shenbao (7 janvier 1914, 3 janvier 1924, 5 janvier 1934, 1er février 1941, 1er janvier 1949). |
 | 222 | Distribution of the advertising population in the newspaper Shenbao (1914-1949) | This set of five curves aims to trace the distribution of the advertising population (number of advertisements per page) in each sample of the newspaper Shenbao. Each curve reveal the variations of population from a page to another. By juxtaposing the five curves, one can trace the changes in this demographic distribution. The measurement have been made our five usual samples of the Shenbao (January 7, 1914; January 3, 1924; January 5, 1934; February 1, 1941; January 1, 1949). The blue color indicates minimal figures; the red color stands for maximal numbers. |
 | 223 | Advertising population in the Chinese newspaper Shenbao (1914-1949) | This set of three curves traces the evolutions of advertising population and density in the Chinese newspaper Shenbao between 1914 and 1949. The green curve stands for the total number of advertisements (in each sample issue), the grey line indicates the total number of pages in each sample issue, the purple line indicates the average density of ads (number of ads/number of pages) in each sample issue). The measurements were made after our usual five samples of the Shenbao (January 7, 1914; January 3, 1924; January 5, 1934; February 1, 1941; January 1, 1949). *** Le jeu des trois courbes ci-joint retrace les tendances démographiques globales dans le quotidien chinois Shenbao entre 1914 et 1949 : l’évolution la population totale par numéro (courbe verte), évolution du nombre de pages (en gris), ainsi que l’évolution de la densité moyenne (c’est-à-dire le rapport entre nombre de publicités totale et nombre de pages, en violet). Les mesures ont été réalisées à partir de nos cinq échantillons habituels (7 janvier 1914, 3 janvier 1924, 5 janvier 1934, 1er février 1941, 1er janvier 1949) |
 | 224 | Uneven distribution of recorded advertisements in Shanghai foreign settlements (1905-1943) | This set of bar charts shows the uneven distribution of recorded advertisements in Shanghai foreign settlements between 1905-1943, in terms of both spatial (unequal documentation between the two settlements) and temporal coverage (variations across time). These charts have been established after the Shanghai municipal archives (hundreds of files in the International Settlement, dozens of files in the French Concession). |
 | 225 | Uneven distribution of recorded advertisements in Shanghai foreign settlements (1905-1943) | This set of three lines shows the uneven distribution of recorded advertisements in Shanghai foreign settlements between 1905-1943, in terms of both spatial (unequal documentation between the two settlements) and temporal coverage (variations across time). These curves have been established after the Shanghai municipal archives (hundreds of files in the International Settlement, dozens of files in the French Concession). |
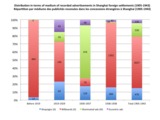 | 226 | Distribution in terms of medium of recorded advertisements in Shanghai foreign settlements (1905-1943) | This set of five bart charts shows the distribution of recorded advertisements in Shanghai settlements between 1905 and 1943, in terms of mediums, based on a simplified version of the typology established in the associated table (shopsigns/signboards, billboards, illuminated and other "eccentric" structures) (see the "Tables" section). |
 | 227 | Actual and virtual spaces of advertising in Shanghai (1905-1943) | This pie chart shows the global distribution between virtual (imaginary) (in blue) and actual (red) spaces of advertising in Shanghai foreign settlements (1905-1943). Uncertain status is materialized by the green color. This chart has been established after the Shanghai municipal archives. |
 | 228 | Advertising surfaces (standards and size slices) in Shanghai foreign settlements (1905-1943) | This set of bar charts shows the distribution of advertising structures according to their dimensions in Shanghai foreign settlements (1905-1943). The size standards and "slices" have been identified after two main sources: professional handbooks (Crow, 1926, Bacon, 1929) and my own records in the Shanghai municipal archives. |
 | 229 | Distribution of advertising areas in the Chinese newspaper Shenbao (1914-1949) | This set of five areal curves aims to trace the distribution of advertising areas in each sample issue of the newspaper Shenbao. The letters and colors refer to the following gradual scale of areas:
The measurements were made after our usual five samples of the Shenbao (January 7, 1914; January 3, 1924; January 5, 1934; February 1, 1941; January 1, 1949). Each curve reveals the uneven distribution of areas between pages. By juxtaposing the five curves, one can trace the changes in this demographic distribution. |
 | 230 | Annual advertising expenses in China: distribution betwen newspaper and outdoor advertising (1929) | This pie charts shows the distribution of the money spent in advertising between newspaper and outdoor advertising in China before 1929 (expressed in million of mexican dollars/year). Source: Bacon, 1929 (754-755) |
 | 231 | Annual advertising expenses in China newspapers: distribution betwen Chinese and foreign newspaper (1929) | This pie charts shows the distribution of the money spent in advertising newspapers between Chinese and foreign newspaper in China before 1929 (expressed in million of mexican dollars/year). Source: Bacon, 1929 (754-755) |
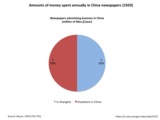 | 232 | Annual advertising expenses in Shanghai and China newspapers (1929) | This pie charts shows the distribution of the money spent in advertising newspapers in Shanghai and other cities in China before 1929 (expressed in million of mexican dollars/year). Source: Bacon, 1929 (754-755) |
 | 233 | Annual advertising expenses by Chinese and foreign firms in China (1929) | This pie charts shows the distribution of the money spent in advertising by Chinese and foreign firms in China before 1929 (expressed in million of mexican dollars/year). Source: Bacon, 1929 (754-755) |


